Abstract: Still in this 21st century, it is a great challenge for the Project Managers to make the software projects successful. The success of software projects relies on how accurately the estimates of effort, cost and duration can be made. Most of the standard surveys stated that only 30-40% of software projects are successful and the remaining are either challenged, cancelled or failed. One of the key reasons for failure of projects is inaccurate estimations. Effort Estimation should be carried out in the early stage of Software Development Life Cycle (SDLC) and it is an essential activity to establish scope & business case of software project management activities. Over estimation or under estimation leads to failure of the software projects. Many of the stakeholders are expecting the estimation of development effort in early stage for their better bidding. There are many methodologies like KLOC, Use Case Points (UCP), Class Points, Story Points, Test Case Points, Functional Points (FP), etc. to estimate effort in the software development. To estimate the effort in the early stage of software development, UCP, Story Points and FP are more preferable. The methods for estimation may be adopted based on the project complexity, functionality, approaches etc. In order to achieve an efficient and reliable effort estimate and thereby have a proper execution of software development plan, Soft Computing Techniques can be adopted in the various organizations and different research domains. In this paper, Functional Points have been selected for effort estimation and implemented using soft computing techniques like Neural Networks and Neuro Fuzzy techniques. After examination the results are evaluated using different error measures like VAF,MMRE,RAE, RRSE and PRED. Basing on results it is observed that the Neuro Fuzzy techniques provided better effort estimates
Keywords : SDLC, Soft Computing, KLOC, FP, Story Points, Neural Networks, Neuro-Fuzzy, PM..
I. INTRODUCTION
Now a days, the biggest challenge for the stakeholders who are involved in the development of software products is to provide the early and accurate effort estimations. Most of the projects fail due to inaccurate effort estimation. The Standish Group Report Chaos published in 2015 states that only 30% projects are delivered in time, 40% projects are
more challenged and gets delayed and remaining 30% projects are cancelled after some amount of time. Either over estimations or under estimations leads to failure of the
Revised Manuscript Received on August 05, 2019.
Dr. S. Rama Sree, Dept. of CSE, Aditya Engineering College, JNTUK Kakinada, AP, INDIA. [email protected]
Ramesh S.N.S.V.S.C, Dept. of CSE, Aditya College Of Engineering& Technology, JNTUK Kakinada, AP,INDIA, [email protected]
Prasada Rao Ch, Dept. of CSE, Aditya Engineering College, JNTUK Kakinada, AP, [email protected]
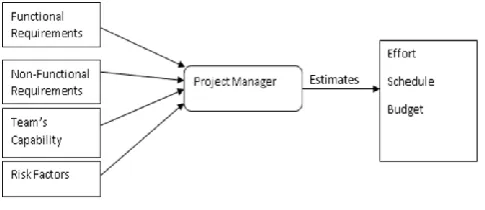
[image:1.595.306.549.343.448.2]software projects [1]. The main reasons for inaccurate estimations in the software industry are unable to identify the functional requirements and non-functional requirements requested by the customer in the early stage of the SDLC. The capability of the Project Manager (PM) also influences the estimation of accurate and efficient software development effort as shown in Fig1. The PM is one who identifies the software development team’s capability to deploy the requested software product within the schedule and budget[3]. Identifying the Risk factors in the early stage of the SDLC also can be a part of accurate software predictions.
Fig 1: Project Managers Activity
Once these issues are resolved and known, the effort required to deploy the software product can be more accurately predicted. Functional Point Analysis (FPA) developed by IFPUG provides more precise measurements of software size and cost to develop quality software
A.
Functional Points
Alan Albrecht while working for IBM, recognized
the problem in measuring the size of the entire
software product in the early stage of SDLC
[2]
.
The basic idea of Albercht is that “the amount of services provided by system to the end user” can be evaluated by the data used by the product and transactions through which the services are delivered to the user [4]. In 1970, he
developed a technique called Functional Point
Analysis which appeared to be a solution to the size
measurement problem.
Function Point metrics are nowwidely used in determining the taxable value of software when industries are bought or sold. Function Points (FPs) measures the software product by quantifying the requested requirements of the user. Function Point Analysis (FPA) is a method of determining the size
and complexity of the system in terms of the services provided
Rama Sree S, Ramesh S.N.S.V.S.C, Prasada Rao Ch
An Effective Software Effort Estimation based
on Functional Points using Soft Computing
by the end product to the end user[5]. FPs are measured in logical size as opposed to physical size like KLOC. The literature shows many drawbacks while estimating the effort using KLOC. KLOC cannot be used to estimate the project in the early stage as it cannot be determined until the completion of the implementation. If the architectural and low level designs are good, then only the measurable size of the software is accurateand otherwise it leads to lot of rework. It results in over budget and over schedule. KLOC is purely language dependent and completely depends on the programmer domain experience. Functional Points are language independent and are broadly categorized into data functions and transactional functions. Each category has its own objectives, strategies and deliverables. There are five elements to determine the Function Points[6] and each and every element has its own weight as per their complexity level as shown in Table 1.
1. Number of Inputs (I) 2. Number of Outputs (O) 3. Number of Inquiries (Q) 4. Number of Logical Files (LF) 5. Number of Interface (IF) 6. Complexity Factors
Table 1: Corresponding Functional Points Weights
UFP = EI*W+EO*W+EQ*W+ILF*W+EIF*W (1) Both data and transactions are evaluated according to the user’s perceptions. Therefore, the IFPUG Function Points are counted based on the User Requirement Specification. To determine the total Function Points first we need to find out the Unadjusted Function Points (UFP) as follows
B.
Non-Functional Requirements
In the development of any customized or commercial software products, the Non-Functional requirements (NFR) are very crucial and are required along with the functional requirements expected by the user. NFRs are equally important as the functional requirements of the end product. The functional requirements should describe what a system should do, NFR describes how well the software is functioning. NFR covers all the remaining specifications which are not covered by the functional requirements. General NFRs are performance, availability, usability, portability, reliability, scalability, security, maintainability, recoverability, etc. IFPUG Counting Manual Practice provides 14 General System Characteristics (GSC) which are treated as NFRs for so many years as shown in given Table 2 [5].
Table 2: General System Characteristics
Each and every GSC will be assigned the Degree of Influence (DI) between 0 to 5, where 0 represents Not Present or No Influence and 5 represents Strong Influence throughout. The sum of weights of these individual GSC will be in the scale of 0 to 70 and it was applied to compute the Value Adjustment Factor (VAF) and multiplied with UFP to calculate total Function Points
Total Degree of Influence (TDI) = ∑114 GSC * DI (2)
VAF = [TDI * 0.01] + 0.65 (3) FP = UFP * VAF (4) VAF can be varying in between 0.65 (when all the GSC’s are not influence or not present) to 1.35 (when all the GSC’s have strong influence)
C.
Risk Factors
To achieve accurate and efficient assessment of the software effort in the early stage of the SDLC, the Project Manager should identify the reasonable risks to the project and can also set the strategies to mitigate the impact of those risks. Software Risks are like errors that indicate something may go wrong while developing the software or after deploying the end product to customer. Risks are of two types positive risks and negative risks. Positive risks are asset to the organization to improve their return on investment (ROI) and Negative risks are those that have an impact on the development schedule, budget and quality. Few of the factors that influence the software development are as follows.
Are team size and appropriate managers involved in the development of software?
Do all stakeholders agree on schedule, budget and others?
Whether the customer has given complete, clear and unambiguous requirements?
Are the team members are sound in the particular domain (insurance, tourism, hospital maintenance etc.)
Is the customer willing to involve in throughout the software development?
Is the design components are flexible enough to change the requirements?
Are the teams members are self-organized or self-managed?
Is the project manager well experienced?
Does the tester do their prominent role to design and execute the test case as per V&V?
How much of the effort (% of the total derived) is dedicated to uncertainty and rework in the SDLC activities?
If the manager is able to extract the complete, correct requirements, unambiguous requirements, understand the non-functional requirements,
project can be completed within schedule, within budget, meet all the customer expectations and would exist with the high quality.
II. RELATED WORK
There has been a lot of research carried out towards predicting the software effort in the early stage of SDLC for last three decades. To predict the effort, we use different methodologies like KLOC, FPA, UCP, Class Points, WBS, Test Suits, Story Points and others. FPA, WBS and UCP are widely used for many years to estimate the software development effort in the early stage of software development. Story points in Agile Methodologies are also rapidly being used in the estimation of effort in early stage. In this paper, FPA is considered and implemented using soft computing techniques. Soft Computing models are widely used in the industry as well as research to estimate the software effort. The literature shows the findings of effort estimation carried out by different people.
Tharwon [6], implemented FP using Data Flow Diagrams (DFD) for better extraction of functionalities of the software product. He converted the FPs into KLOC using traditional COCOMO with different productive rates of programming languages. Each and every organization should have its own project data to attain the appropriate productive rates. He also concluded that COCOMO cost estimation model is not recommendable while estimating effort using FP.
Luigi & Sandro[7], estimated the effort using two different methods like Average Functional Process (AFP) and Equal Size Bands (ESB) in the early phases of software development using standard COSMIC method. Both methods provide accurate estimations when the distribution of functional processes across the band is the same in the historical data set. If it differs the ESB provides better estimations than AFP but both of them require efficient human measures while classifying the functional process. Lvazza et al [8], investigated the subsets of Base Functional Components (BFC) to acquire the Functional Size Measures (FSM) that simplify the Functional Points. It provides the same effort which has been extracted from older Functional Points and the goal of this process is to optimize the measurement cost and time. The authors used only EI, EQ, and EO to calculate the BFC and ignoring the ILF, EIF. Lvazza et al [9], proposed a new methodology to estimate the development effort in the early phase of software development called Simple Function Point (SiFP). It is relatively efficient than IFPUG FP while measuring the size using Data elements and Transactional elements. The SiFP is not an innovative approach but it uses the simplified process to evaluate the size of development effort through IFPUG FP. The SiFP adopted the methodologies from NESMA FP and Early & Quick FP. The SiFP method defines only two Basic Functional Components (BFC) like Unspecified Generic Elementary Process (UGEP) & Unspecified Generic Data Group (UGDG) to calculate the total Function Points (FP). They have compared and correlated the development effort developed by IFPUG FP and SiFP and both of them given the same results but the process of measuring the size by SiFP is easier than IFPUG FP.
Prasad Reddy et al [10], proposed a neural network model for accurate prediction of the effort using KLOC. They have used Radial Basis and General Regression techniques for
training and testing of Nasa93 data set and compared the performance metrics like VAF, MMRE,MARE, VARE, Mean BRE and PRED with traditional Intermediate COCOMO model. They have shown that Radial Basis Neural Networks performed well.
Kaur et al [11], have taken up the 20 project’s data which contains the FP count and measured effort using Particle Swarm Optimization (PSO). They evaluated the performance using the metrics like MMRE & RMSE. The authors compared the proposed model results with Albrecht Gaffney and Kemerer Model results and concluded that the proposed model outperforms well.
Sultan et al [12], used three machine learning models like Linear Regression Model, Support Vector Machine (SVM) and Artificial Neural Network (ANN) to estimate the development effort. The authors have done the estimation based on KLOC, KLOC with Development Methodology (ME) and number of Inputs, Outputs, Interfaces, Enquiries using mentioned machine learning techniques. They have trained and tested with the real project data by the above models. The ANN models outperformed well with other models with respect to error computation. For the function point’s estimation, all the three models were almost similar with slight improvement in the mean absolute error in SVM.
III. PROPOSEDMETHODOLOGY
A.
Soft Computing Techniques
Soft Computing (SC) techniques do not require any mathematical equations or models for solving various problems. The algorithms use in SC is so flexible where it can adjust to the change of dynamic environments. SC techniques are used to solve various application domain problems like medical, education, stock exchange, marketing, etc. The SC Techniques are derived from Human Brain. SC techniques are not transparent and clearly defined area at present. It includes lot of emerging and established set of problem statements and respective solution methods that avoids ambiguity in intelligence found in nature. In the process of developing solutions from the soft computing techniques, it learns from experimental datasets and uses Fuzzy Logic Model, Neural Networks, Support Vector Machines, Evolutionary Algorithms, Chaos Theories, etc. According to Zadeh the basic principles of soft computing is to exploit imprecision, uncertainty, and partial truth to achieve robustness and low solution cost. In the proposed method the hybrid method of Adaptive Neuro-Fuzzy Inference System and Generalized Regression Neural Networks and are used to estimate the software development effort, cost and duration.. In this paper, we have implemented the SC Techniques to estimate development effort using the China dataset.
B.
Adaptive Neuro-Fuzzy Interface System
(ANFIS)
For the case study on China dataset, Adaptive Neuro-Fuzzy Interface System (ANFIS) is
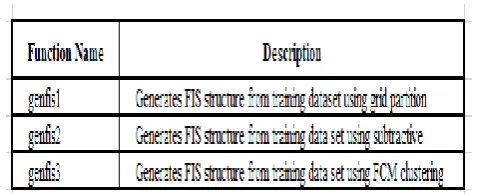
system and the training is done using neuro-adaptive learning methods as in the case of neural network training. MATLAB provides a Fuzzy Logic Toolbox which provides number of command-line functions to train Sugeno-type Fuzzy Interface System (FIS) using the data provided for training. Firstly we need to generate FIS structure using genfis function available in the MATLAB toolbox. There are three genfis methods available in the toolbox. The purpose of each of the genfis function is given in Table 3.
Table 3: genfis functions
For the proposed approach, genfis2 was used. The syntax used is
F = genfis2(I, O, R, B, Os) (5) where I – Input training data matrix, O – Output matrix, R – Cluster center’s range of influence, B –Bounds of Min & Max axis range, Os- Options vector for specifying cluster parameters. The anfis function is used to further train the FIS basing on least squares methods and back propagation gradient descent method . The Syntax of anfis function is: Fis1 = anfis(Tdata, F, TrainOpt, Displayopts) (6) Where Tdata- Training dataset, F – The output generated using Eq 5, TrainOpt- Vector of training options, Displayopts- Vector of Display options.
In the Adaptive Neuro-Fuzzy Modeling, the last step is performing fuzzy interface calculations. For this we need evalfis algorithm. The syntax used in the proposed approach is:
Estimated = evafis(TestInput,Fis1) (7) Where TestInput- Input data from test set, Fis1- FIS structure generated by using Eq. 6
C.
Generalized Regression Neural Network
(GRNN)
GRNN is a type of Radial Basis Network used for function approximation. It is a quick to design. To design a GRNN the function newgrnn ia available in MAT Lab tool box. The general form of newgrnn function is:
net = newgrnn(I, O, S) (8)
Where I- Input training Vector, O- Training data output, S- Spread Constant Value
The GRNN model is simulated using the new input test data to get predicted values. The following function is used to simulate the GRNN model.
Estimated = sim(net, testdata) (9)
where net-output of newgrnn function and testdata- new test data to get the predicted values
IV. EXPERIMENTATION
To estimate the effort/cost/schedule during software development, the proposed models ANFIS & GRNN are developed using the China dataset available publicly. The China dataset consists of 499 records with 19 attributes. The attributes are PID, AFP, Input, Output, Enquiry, File, Interface, Added, Changed, Deleted, PDR-AFP, PDR-UFP,
NPDR-AFP, NPDU-UFP, Resource, Dev.Type,
Duration,N-Effort and Effort. For the implementation 18 attributes are used except the Dev.Type. The 17 attributes are independent and the only dependent attribute is Effort. These 17 attributes are used as input to the proposed soft computing models and the output of these models is Effort.
Out of 499 records, 399 records (80%) are used for training the models and the models are tested using the leftout 100 records (20%).
For designing the GRNN, the function newgrnn is examined with the Input as the 17 attributes data of the 399 records, Output as the 18th attribute i.e. Effort and Spread as 106. The output of the GRNN is the estimated effort. The designed GRNN is tested with 100 records. The estimated effort is compared with the actual effort. The performance metrics used are VAF, MMRE, RAE, RRSE and Pred(25). To generate an ANFIS Model, the input parameters are the 17 attributes data of the 399 records and the output is the the 18th attribute i.e. Effort of the same dataset. The ANFIS model is created using genfis2 with Rad as 1.01 and the Options vector as [1.02 0.2 0.02 0]. The default value of Bounds is considered. The generated FIS is further trained using the anfis function. The finally generated FIS is tested using the 100 records and the performance metrics are measured.
V. EVALUATIONCRITERIA
The performance of various methods discussed in the proposed approach are compared by using the following evaluation criteria
The Mean Magnitude of Relative Error can be calculated as
(10)
Prediction Accuracy can be calculated as
(11)
Relative Absolute Error (RAE):
(12)
Root Relative Squared Error (RRSE):
RRSE =
thor-1 Photo
Author-2 Photo
Variance Accounted For (VAF):
VAF= (14)
Where
Pi-Estimated effort of ith project Ai-Actual effort of ith project Am- Mean of all Ai
n-total number of project records
X-MMRE value of the test set for which we are calculating the prediction
The model with high VAF and PRED value and low MMRE, RAE and RRSEvalues are considered to be more efficient.
VI. RESULTSANDDISCUSSION Table 4: Evaluation Criteria of different models
Model MMRE RAE RRSE VAF PRED ANFIS 5.985 0.043 0.037 99.8 98 GRNN 8.3565 0.103 0.119 98.2 98
Table 3 shows the results of the proposed models: Adaptive Neuro-Fuzzy Inference System and Generalized Regression Neural Network. The obtained results are based on the training set and test set that have been used. For the present work, 80% of the entire data set was used for training and 20% of the dataset was used for testing. It was observed that ANFIS performed well compared to GRNN based on the performance metrics like MMRE, RAE, RRSE, VAF, and PRED(25).
VII. CONCLUSION
The main aim of this paper was to show that it was possible to estimate the software development effort in the early stage with a reasonable error before a project is started. Functional size measures are required in the early stage of SDLC. Albrecht proposed Function Points as software size metric in the early stage as opposed to SLOC in later stage. In this paper Functional Point approach is used for predicting the software effort in the early stage of the software development. It helps the project managers and as well as customers for the better bidding in the early stage of SDLC. In this paper two Soft Computing Techniques are chosen for better predicting the software effort on China Dataset. The two techniques are Adaptive Neuro-Fuzzy Inference System and Generalized Regression Neural Network. Adaptive Neuro Fuzzy Inference System and GRNN are developed using MATLAB toolbox functions. The results are analyzed using MMRE, RAE, RRSE, VAF, and PRED(25) parameters. The ANFIS model outperformed compared to GRNN.
In future work Functional Points can be used as Story points in Agile methodologies and predicting the sprints duration and cost. The study can also be expanded using FireWorks Algorithm (FWA), Random Forest, ensemble techniques, Evolutionary Algorithms, etc.
REFERENCES
1. Kjetil and Dr. Mark “ A reflection on why large public projects fail” in 2013
2. TSOI Ho-Leung “To Evaluate the Function Point Analysis-A Case Study”, International Journal of The Computer, the Internet and Management Vol. 13#1 (January – April, 2005) pp 31 - 40
3. Amit Johnsonbabu “Reinventing the role of Project manager in the Artificial intelligence era” , Project management national conference, india,2017.
4. Lavazza, Luigi, and Roberto Meli. "AnEvaluation of Simple Function Point as a Replacement of IFPUG Function Point", 2014 Joint Conference of the International Workshop on Software Measurement and the International Conference on Software Process and Product Measurement, 2014.
5. Garmus, David. "A Guide to Sizing and estimating Projects Using international Function Point Users Group Function Points",The IFPUG Guide to IT and Software Measurement, 2012
6. Manideep Kaur, Sumeet Kaur “Particle Swarm Optimization Based Effort Estimation Using Function Point Analysis” Internationai Conference on Issues and Challenges in Intelligent Computing Techniques (ICICT), 2014
7. Tharwon Arnuphaptrairong “Early Stage Software Effort Estimation Using Function Point Analysis: An Empirical Validation” international journal of design, analysis and tools for intergrated circuits and systems, vol. 4, no. 1, december 2013
8. Gianfranco Lanza “Function Point: how to transform them in effort? This is the problem!” Proceedings 5th Software Measurement European Forum, Milan 2008
9. Luigi Lavazza and Sandro Morasca “An Empirical Evaluation of Two COSMIC Early Estimation Methods” Joint Conference of the International Workshop on Software Measurement and the International Conference on Software Process and Product Measurement, 2016.
10. Prasad Reddy P.V.G.D , Sudha K. R , Rama Sree P “Prediction of Software Development Effort Using RBNN and GRNN” IJCSET | May 2011 | Vol 1, Issue 4,185-190
11. Prabhakar and Maitreyee Dutta “Application of machine learning techniques for predicting software effort” Prabhakar et al./ Elixir Comp. Sci. & Engg. 56 (2013) 13677-13682
12. Sultan Aljahdali “Estimating Software Effort and Function Point Using Regression, Support Vector Machine and Artificial Neural Networks Models” IEEE,2015
AUTHORSPROFILE
Dr. S. Rama Sree obtained her B. Tech. in CSE from KLCE, Affiliated to Acharya Nagarjuna University in 2001, M.Tech in Computer Science from Jawaharlal Nehru Technological University Kakinada in 2006 and Ph.D in CSE from Jawaharlal Nehru Technological University, Hyderabad in 2015. She is currently working as Professor in CSE & Vice Principal, Aditya Engineering College(A), Surampalem, AP, India. She has 18 years of teaching experience, 25 International Journal Papers and 7 National/International Conference Papers to her credit. Her research interests include Software Cost Estimation, Software Reusability, Software Reliability, Software Prioritization, Software Defect Prediction, Software Maintenance, Soft Computing, Cloud Computing and Medical Diagnosis.
Mr. S N S V S C Ramesh is currently working as Associate Professor in CSE & Officer Incharge of Examinations in Aditya College of Engineering and Technology,Surampalem, AP, India. He has 21 years of teaching experience, 15 International Journal Papers and 4 National/International Conference Papers to his credit. His research interests include Mobile Computing, Software Engineering, Soft Computing, Cloud Computing and Medical Diagnosis.
Mr. Ch. Prasada Rao is currently working as Associate Professor in CSE in Aditya Engineering College (A), Surampalem, AP, India. He is pursuing Ph.D in K L University and he has totally 10 years of teaching Experience with 5 International Conferences papers & 4 International Journal papers to his credit. His research areas are Software Effort Estimation, Test Suite Prioritization & Optimization, Machine Learning Techniques, Soft Computing