Abstract: Topological error free data in the database is very essential for Geographic Information System (GIS) analysis. To minimize some of the most common GIS errors, five Quality Assessment/Quality Control tools has indigenously discussed in this paper, namely Auto registration tool, Dangles correction tool, Irrelevant points removal Tool, Delete polygon less than 4 vertices and Connect and Split using the programming language Python. Tools are developed for ArcMap environment for more effective data cleaning and validation. ArcMap is one of the main components in Architecture Geographical Information system (ArcGIS) suite.
These tools will be helpful to identify the possible errors in a particular sheet and will navigate user to the error positions. These tools not only finds the errors they also provides several solutions to solve those errors in automatic or semi-automatic mode, hence making the data best suited for use in GIS.
This paper describes the brief details of all the 5 developed tools, and also demonstrates the benefits of applying these tools.
Keywords:QA/QC Tools, ArcMap, ArcGIS, Data Cleaning
I. INTRODUCTION
Nowadays, Geographical Information systems (GIS) are becoming more and more popular for their ability to manage spatial data and analysis. Under this perspective, decision support systems with intensive GIS analysis, are becoming more prevalent in present workflow. To achieve this objective, topological error free data into the database is required. Therefore, it is very much needed to develop the necessary topological error correction tool/modules to address the issue.
Topology manages geometric relationship between nodes, edges and the faces they created. Based on the type of the Topology (arc-node, Polygonal etc.) and data model requirement, appropriate topology rules are defined. Errors in data may lead to violate these topology rules, incorrect definitions of relationship between features, therefore failure to meet data qualify criteria. Such errors are called Topological errors [1].
Spatial vector data contains many topological errors arising from the quality of the source material, data collection techniques and human interaction, acquisition of vector data for GIS requires further processing in order to use it for some advanced spatial analysis. Spatial data must be made topologically correct before using it for analysis
Revised Manuscript Received on September 06, 2019
P. Chinnammalu, M. Tech Student, SIT, JNTU, Hyderabad, India. Email: [email protected]
R. Mahesh, Deputy Surveyor General, IISM, Survey of India, Hyderabad, India.
J. Venkatesh, Associate Professor, CSIT, JNTU, Hyderabad, India.
Most common Topological error types in spatial vector data are: Dangling lines, Floating or Short lines, Overlapping of lines, Overshoot & Undershoots and Unclosed & Weird Polygons etc.
S.S. Maras etal [2] studied some of the topological errors i.e. methods of removing duplicating arcs, intersecting arcs, correcting overshoot and short line removal.
N. Solommakhina etal [3] studied on methods for identifying and correcting dangling lines in datasets aiming to reconstruct incorrect topological relationships between lines and other features.
Ismail Elkhrachy [4], developed a “flash flood” tool in ArcMap environment to generate flash flood ma p to identify sites in high risk flood zones.
L. Lenka Kocianova and R. Melichar [5] developed Orientation Analysis Tools (OATools), a new add-in, which has been developed for ArcGIS software (ESRI) to allow the spatial analysis of structural data.
Architecture Geographical Information system (ArcGIS) software suite by ESRI is mainly used to create, manage, share, and analyze spatial data. In ArcGIS, ArcMap is one of the main component which is primarily used to explore data within geographic dataset, query spatial data to find and understand relationships among geographical features, and create professional quality maps, graphs and reports. ArcGIS has the option of writing a script to automate geoprocessing work flows. ArcGIS introduces scripting support for many of today‟s most popular scripting environments, such as Python, VBScript, JScript, and Perl. Python has the programming capabilities of a complete developer language and also it has the ease of use of a scripting language.
Feature Clean (F_CLEAN) tool programmed in Visual Basic (VB) for MicroStation environment has more advanced and user friendly functionalities for effective data cleaning and validation.
In this paper, to address some of the most common topological errors, five new Quality Assessment (QA)/ Quality Control (QC) tools are developed in ArcMap environment similar to the features of F-Clean tool in MicroStation Geographics but powered some additional functionalities compared to F-Clean tool.
Development of Quality Control Tools for
ARCMAP using Python
II. DEVELOPMENTOFQA/QCTOOLSFOR ARCMAP
TOOL-1: AUTO REGISTRATION TOOL 1.1 Working Principle:
[image:2.595.320.530.175.291.2]Auto Registration tool mainly identifies inconsistent portions of the input features against target features within a search distance and aligns them with the target features. In this tool input and target features are need to be assigned with appropriate feature classes. Some of the registration problems are shown in the Fig.1 & Fig.2
Fig. 1. Example of registration error in Line feature
Fig. 2.Example of registration error in Polygon feature
1.2 Methodology Adopted:
[image:2.595.115.224.315.369.2]Step by step methodology adopted for the development of the Auto Registration Tool is summarized in the Flowchart of Fig.3.
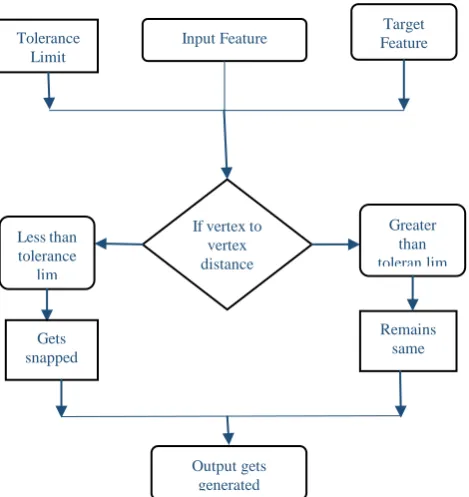
Fig. 3. Flowchart of Auto Registration tool Based on the given tolerance value, the tool checks the vertex to vertex distance for the given input. If the vertex to
vertex distance is less than the tolerance limit, output gets snaps. Otherwise, the output remains same.
1.3 Graphical User-Interface (GUI) & Run Manual of Auto Registration tool:
Auto Registration tool is developed using programming language PYTHON. Screenshot of Graphical User-Interface
(
GUI) of Auto Registration toolbox is shown in Fig.4.Fig. 4. Screenshot of Auto Registration toolbox For the Auto Registration toolbox, two different feature classes namely input feature class and target feature class are given as the „input‟. Polygon feature is considered as the input for both the feature classes. Tolerance distance must be specified and it must be greater than zero. According to this limit, output is getting snapped or remaining the same. And an output folder is introduced where the output is created. There is Tool help and Environments at the bottom of the box for any further searching purpose.
[image:2.595.48.283.466.715.2]After clicking on the „ok‟ button of the Auto Registration toolbox, output gets generated with a popup box as shown in the Fig.5. It shows a completed message of the script developed and the succeeded time and date along with it.
Fig. 5.Screenshot showing that output gets succeeded of Auto Registration toolbox
1.4 Results and Discussions:
Auto Registration tool adjusts the features without any gaps if the vertex to vertex distance is less than the tolerance limit. And remains the same if the vertex to vertex count is greater than the tolerance limit. It is as shown in the below figures Fig. 6 & Fig. 7 with the yellow color demarcation. For easy
Input Feature Feature Target Tolerance
Limit
If vertex to vertex distance Less than
tolerance lim
Greater than toleran lim
Gets snapped
Remains same
[image:2.595.306.545.500.603.2]identification of the output a small part of the portion is taken into consideration.
[image:3.595.81.251.97.196.2]Fig. 6. Input of Auto Registration tool
Fig. 7. Output of Auto Registration tool
TOOL-2: DANGLES CORRECTION TOOL 2.1 Working Principle:
It finds polyline features that have nodes which are within a user-defined tolerance but not connected to other polyline. After finding the error this automatic gap correction tool fix dangles error automatically within a user defined range. It will fix the errors feature category wise. The polyline feature can be compared within its feature class or across other polyline feature class. Fig.8 represents the dangles on a polyline feature. Some of the dangle errors encountered while performing with the tool are undershoots, overshoots and the gaps. All these are rectified with the tool in automatic mode.
Fig. 8. A view of the dangles on a polyline feature
2.2 Methodology Adopted:
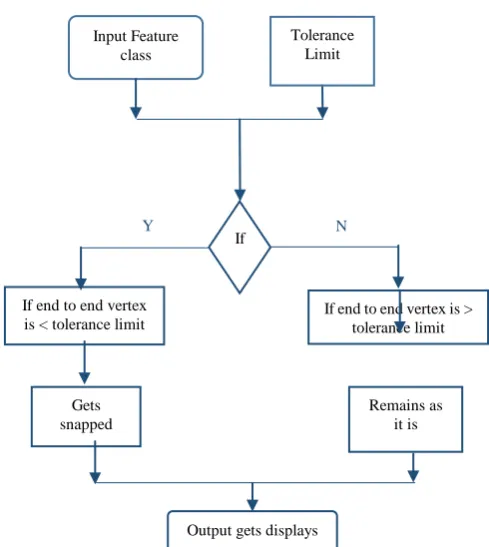
Step by step methodology is adopted for the development of the Dangles Correction tool which is summarized as a Flowchart in Fig.9. Based on the given tolerance value, the tool checks the end to end vertex gap. If the end to end vertex
[image:3.595.303.548.110.384.2]gap is less than the tolerance limit, output gets snaps. Otherwise output creates a point feature.
Fig. 9. Flowchart of Dangles correction tool 2.3 GUI & Run Manual of Dangles Correction tool:
Dangles correction tool is developed by using programming language PYTHON. Screenshot of GUI of Dangles correction tool is as shown in Fig. 10.
Fig. 10. Screenshot showing the Dangles tool
Toolbox for the dangles tool takes the input feature class as the Line Feature only. Tolerance limit can be set accordingly with respect to the user in meters. By clicking ok button respective output of the tool is shown on the panel window of the ArcMap.
2.4 Results and Discussions: Fig.11 shows that input contains more number of nodes on the Line Feature, in Fig.12 all
Y N
o
Tolerance Limit
If end to end vertex
is < tolerance limit If end to end vertex is > tolerance limit
Gets snapped
Remains as it is Input Feature
class
If
[image:3.595.82.251.227.331.2] [image:3.595.314.539.487.623.2] [image:3.595.131.206.572.665.2]those errors got reduced if the end to end vertex is less than the tolerance limit. Otherwise if the end to end vertex is greater than the tolerance limit then it remains.
Fig. 11. Input of Dangles tool
Fig. 12. Output of Dangles tool
TOOL-3: IRRELEVNT POINTS REMOVAL TOOL 3.1 Working Principle:
This tool deletes the unnecessary points which are outside the boundary and keeps the points which are of inside the boundary. It is useful for the whole sheet to work on where we can grab the points in a particular area of interest
3.2 Methodology Adopted:
[image:4.595.326.523.127.236.2] [image:4.595.367.513.447.554.2]Flowchart of Irrelevant points removal tool is shown in Fig.13. Takes both point and polygon features as input. Both of them are combined by placing polygon feature inside the point feature. Then it deletes the irrelevant points with the boundary. In this tool, Boundary is taken as the Polygon feature. It is the final output which gets generated at the end.
Fig. 13. Flowchart of Irrelevant points removal tool
3.3 GUI & Run Manual of Irrelevant points removal tool:
Irrelevant points removal tool is developed by using programming language PYTHON. Screenshot of GUI of Irrelevant points removal tool is as shown in Fig. 14.
Fig. 14. Screenshot showing the Irrelevant Points removal tool
Toolbox for this tool creates Input Feature classes namely „Point‟ and the „Polygon‟ features. In this context Boundary is taken as the Polygon feature.
3.4 Results and Discussions:
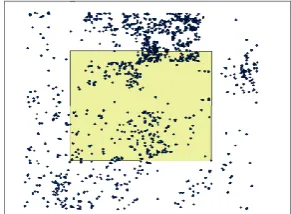
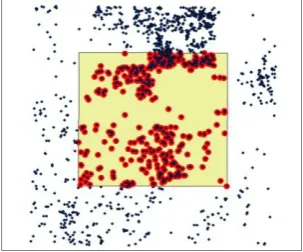
[image:4.595.349.521.451.649.2]Fig.15 shows the input containing more irrelevant points in outside boundary. This tool only gives the points which are relevant and inside the boundary, removes the irrelevant points which are unnecessary and are outside the boundary as shown in Fig.16. Combined mapping of input and output file is shown in Fig.17.
Fig. 15.Input of Irrelevvant Points Removal tool
Fig. 16.Output of Irrelevvant Points Removal tool
Polygon Feature
Deletes the irrelevant points with boundary
Output gets generated Point
featur e
Polygon feature Input
[image:4.595.45.290.578.752.2] [image:4.595.364.519.581.687.2]Fig. 17. Combination of both the Input and Output of Irrelevant Points Removal tool
TOOL-4: DELETE POLYGON LESS THAN 4 VERTICES TOOL
4.1 Working Principle:
This tool will search and delete elements having wrong geometry such as polygon having vertex count less than 4 or zero area.
4.2 Methodology Adopted:
Flowchart of Delete Polygon less than 4 Vertices is shown in Fig. 18. This tool checks the vertices count of the feature. If the vertices count is less than 4 then the tool deletes Polygon features and generates the output. If the vertices count is greater than 4 Polygon features remains the same without deletion and generates the output.
Fig. 18. Flowchart showing the Delete Polygon less than 4 Vertices tool
4.3 GUI & Run Manual of Delete Polygon less than 4 Vertices tool:
Delete Polygon less than 4 Vertices tool is developed by using programming language PYTHON. Screenshot of GUI of Delete Polygon less than 4 Vertices tool is as shown in Fig 19.
Fig. 19. Screenshot showing the Delete Polygon less than 4 Vertices tool
[image:5.595.334.528.62.157.2]Toolbox for the tool contains only the Input feature element, where it is given as the Polygon feature.
Table-I: Attribute table of the Polygon Feature before running the tool
[image:5.595.317.544.260.368.2]
The above attribute table shows the Polygon feature count as 368 before running thetool. It comes under the Land cover category. Attribute table is the table which shows about object id, shape, feature name and category etc. of the respective feature element.
Table-II: Attribute table of the same Polygon Feature after running the tool
The above attribute table shows that attribute count is reduced to 118 from 368. It is a gradual decrease in the polygon feature count.
[image:5.595.49.283.446.654.2]4.4 Result and Discussion:
Fig.20 shows more number of polygon features having less than 4 vertices. In Fig.21, it is observed that the gradual decrease of the polygon features by using this tool. It decreases the count of the features if the vertices count is less than 4 or having the zero area. Otherwise they will remain the same without any change if the vertices count is greater than 4.
Input
Polygon feature
Vertices count
Query
Greater than 4 Less than 4
Remains same
Deletes Polygon feature
[image:5.595.312.545.471.576.2]Fig. 20. Input of Delete Polygon less than 4 Vertices tool
Fig. 21. Output of Delete Polygon less than 4 Vertices tool
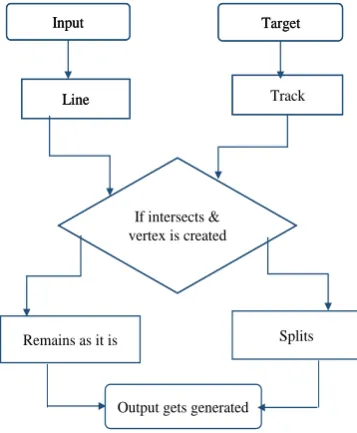
TOOL-5: CONNECT & SPLIT TOOL 5.1 Working Principle:
There are two utilities in this module, one is “Connect” and another is “Split”.
Connect tool connects all linear features having same attributes and make it a single linear element till it finds any gap between another features, this tool will ensure that there is no unwanted junction exists between similar linear features and helps checking continuation of single linear elements such as boundaries, streams etc.
Spilt tool splits the features at an intersection. Both tools takes the Input Feature class as a Line Feature only.
5.2 Methodology Adopted:
a.Connect Tool:
Flow chart of connect tool is shown in Fig. 22. Flowchart for the Connect tool takes the Input Feature Class and Target Feature Class as the „input‟. Both of them are Line Feature only. If both of them have the same attributes and are adjacent to each other then they connects and output gets generated. If both of them doesn‟t have the same attributes and are not adjacent to each other then they remains the same which generates the output.
Fig. 22. Flowchart of Connect tool
b. Split Tool:
Flow chart of Split tool is as shown in Fig. 23. Split tool takes the Input Feature class as the Line Feature, road and Target Feature class also as the Line Feature, Track. If both the features intersects and a vertex is created then it splits giving the output. If both the features don‟t intersects and a vertex is not created then it remains the same giving the output.
Fig. 23. Flowchart of Split tool
Input Target
Line Line
If having same attr & adjacent
Remains as it is Connects
Output gets generated
Input Target
Line Line
Input Target
Line Track
If intersects & vertex is created
Remains as it is Splits
Output gets generated
Input Target
[image:6.595.92.279.201.325.2] [image:6.595.341.520.469.686.2]5.3 GUI & Run Manual of Connect and Split tool:
Connect & Split tool is developed by using programming language PYTHON. Screenshot of GUI of Connect & Split tool is as shown in Fig 24.
Toolboxes for the Connect and Split tool creates Input and the Target Feature classes. Both of them are the Line Features only. But for the Connect tool both the Input and Target Feature classes are given as the road element in the Line Feature. Perhaps both should be same to connect the feature with the same attributes.
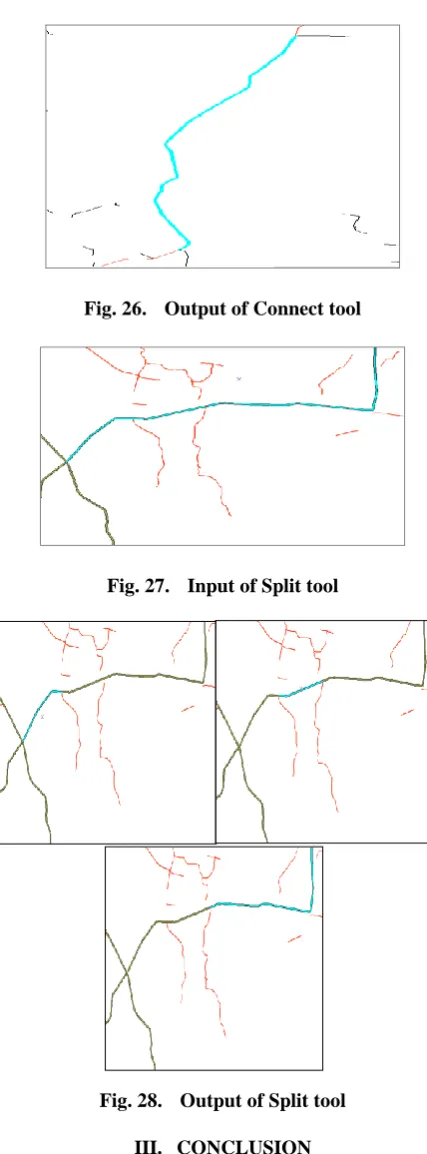
[image:7.595.315.529.38.616.2]Split tool takes the Input Feature class as the road element and Target Feature class as the car-track element where both of them are the Line Features only.
Fig. 24. Screenshot showing the Connect & Split tool
5.4 Results and Discussions:
[image:7.595.57.281.245.389.2]Fig.25 and Fig.27 shows the input files of Connect and Split tools. Fig.26 shows the output of the Connect tool. It connects a Line Feature if it is having the same attributes and is adjacent to each other otherwise it remains as it is. Fig.28 shows the output of split tool. Split tool splits two different features if they intersects and a vertex is created otherwise it remains the same.
Fig. 25. Input of Connect tool
Fig. 26. Output of Connect tool
Fig. 27. Input of Split tool
Fig. 28. Output of Split tool III. CONCLUSION
[image:7.595.46.267.548.771.2]REFERENCES
1. M.Siejka,M. Slusarski and M.Zygmunt, “Correction of topological errors in geospatial databases”, Int. J. Phys. Sci, vol 8, no 12, 2013, pp. 498-507.
2. S.S.Maras, H. H. Maras, B. Aktug, E.E.Maras and F. Yildiz, “Topological error correction of gis vector data”, Int. J. Phys. Sci, vol 5, no 5, 2010, pp. 476-583.
3. N.Solomakhina, T. Hubauer, S Becher, “On improving data quality and topology in vector spatial data”, GEOProcessing, 2016 [Dig. 8thInt. Conf. Advanced Geographic Information Systems, Applications, and Services.
4. I. Elkhrachy, “Flash Flood Hazard Mapping Using Satellite Images and GIS Tools: A case study of Najran City, Kingdom of Saudi Arabia (KSA)”, Egypt. J. Remote Sensing Space Sci., (2015).
5. L. Lenka Kocianova and R. Melichar, “OATools: An ArcMap add-in for the orientation analysis of geological structures”, Computers & Geosciences, vol.87, 2016, pp. 67–75.
AUTHORSPROFILE
P. Chinnammalu is a M. Tech Student in Spatial Information Technology from JNTU-Hyderabad, India. Interested in Applications of Remote Sensing.
Swapan Chowhan is working as a Surveyor in GIS & RS Department, Survey of India, Hyderabad, India. He did hisM.Sc in Geospatial Science and Technology. Interested in Applications of GIS and Programming.