Development of QoS optimized routing using
Artificial bee colony and TABU-GA with a mobile
base station in Wireless Sensor Network
Varsha , Manju Bala , Manoj Kumar, Neeraj Kumar
Abstract—Routing in Wireless Sensor Networks (WSNs) have been playing an important and progressive role in different scenarios like the environment and traffic monitoring. In this research paper, extensive contributions have been explored concerning the routing mechanisms involving WSN. Enhancing the critical attributes like network lifetime and reliability are prime areas of research in this field. To obtain the desired results, optimizations have been performed using Swarm Intelligence (SI) based routing mechanism like the Artificial-Bee Colony (ABC) optimization and TABU-GA routing technique. Although, since the past decade, the Ant-Colony Optimization (ACO) and Particle Swarm Optimization (PSO) have been introduced and applied in this field, but the ABC and TABU-GA approach is relatively novel and considered a prominent choice as compared to other methods. However, a lot of scope for further enhancement of the ABC optimization and TABU-GA problem. This paper highlights and explains the comparison between RZLEACH (Rendezvous LEACH), ABC and TABU-GA algorithm based routing mechanisms. The simulation results obtained show that the TABU-GA have significant result over the ABC and RZLEACH and found 6% improvement when compared with the RZLEACH approach in terms of Remaining Energy and 9% lesser in case of First node dead (FND) with comparison to RZLEACH.
Keywords— Wireless sensor network, Artificial Bee Colony, TABU-GA, LEACH, RZLEACH, First node dead, Packet Delivery Ratio.
I. INTRODUCTION
In WSN applications, various nodes spread over the monitoring region with low-cost sensors. These nodes are arranged effectively into a wireless network, where every individual sensor node stores the information and transmits the reports intermittently to the Base Station (BS).
Revised Manuscript Received on November 06, 2019.
Varsha, Computer Science, I.K.Gujral Punjab Technical University, Jalandhar (Punjab), India. Email: [email protected]
Manju Bala, Computer Science, Khalsa College of Engineering & Technology, Amritsar , (Punjab), India. Email: [email protected]
Manoj Kumar, Electronics and communication, DAV institute of Engineering, Management & Technology, Jalandhar (Punjab), India. Email: [email protected].
Neeraj Kumar, DIT, BBAU (A Central University), Lucknow, India. Email: [email protected]
Afterwards, it takes this set of optimized solutions as the initial population for the GA, and iterates until the adopted stop criteria have been met. For the implemented hybrid agent, the TS output is not written in the main memory, as the TS pure agent, but it is stored in a transition memory, which has an interface with the module that implements the GA. After the stop criteria for the TS have been met, the GA module uses the solutions in this memory as initial population and performs iterations until the stop criteria have been met. At last, the best solution produced by the GA is written to the main memory.
The novelty of the Paper
An optimization algorithm, i.e., the artificial bee colony and TABU-GA is considered for the proposed network structure based on the time taken to become stable and to achieve throughput for the design of an efficient and scalable network. Thus, this paper proposes a novel algorithm, i.e., ABC-RZLEACH and TABU-GA RZLEACH to resolve the optimization dilemma.
Organization of the paper
The other sections of the document are structured as follows: Section II outlines the related work. Section III highlights the Proposed model. Section IV elaborates the simulation environment. Section V comprises the results and discussion. At last, the conclusion and future scope is mentioned in Section VI.
II. RELATED WORK
In a WSN, the transmitter node must transmit its information utilizing a reasonable convention and pick an advanced course to achieve the sink. Another way is that the energy of nodes situated close to the sink will drop rapidly. The clustering is another answer for lessening energy utilization. In this technique, clusters transmit their information to the cluster head (CH) and the information gathered in the CH will be transmitted to the sink. LEACH algorithm introduced first time in Heinzelman et al. [3] and is a proficient grouping calculation where nodes inside a cluster transmit their information to the nearby CH. The CH gets information flag and diminishes the absolute number of bits by accumulating them and transmitting the powerful collected information to the sink. In the event of the CH is fixed for explicit nodes, it will rapidly devour their restricted energy and die, which closures the capacity to convey for residual cluster individuals. LEACH utilizes a randomized revolution structure through all nodes to disseminate energy utilization. At the point when clusters are shaped, the nodes transmit their information through energy proficient convention to the CH. LEACH utilizes a time division multiple access (TDMA) timetable to choose when every node can transmit. In LEACH, the CHs are arbitrarily chosen and an ordinary node chooses to which cluster it has a place. The low energy adaptive clustering hierarchy (LEACH) performs superior to customary conventions as far as energy utilization on the grounds that versatile clustering and CHs turn, which enables energy to be circulated among all nodes. By totalling the information got, LEACH can diminish the volume of information sent to the base station and expend less power sending the information. A mobile sink (MS) is a substitute method to diminish energy utilization. The MS moves inside/around the environment to
[11] evaluated the LEACH Mobile technique which has been improved by concentrating on flexibility full "remoteness" for selecting the cluster heads. Researchers have performed simulations and have compared the technique with existing Leach mobile technique. By using, Leach mobile technique, the maximum performance might be increased but the energy factor decreases. Liu et al. [12] have introduced a novel method where the total amount of power consumed was reduced for all the nodes using a novel proposed algorithm i.e. LEACH-D centred on LEACH. An improvement has been made primarily on the subsequent factors and the number of connections by considering the node connections in such a way that it increases the possibility of a node with higher connectivity to always be a head-node. In the second stage of clustering, the clustering head-node chooses its radius for the CH based on the distance from transmitting node to the base station and the number of connections to it. Non-Cluster Head nodes select a group to participate in line with the power consumption of the CH and the path length to the clustering head node; in
the conversation stage, clustering head-nodes use a multiple hopping steady-state to transfer information to the Base Station. For the dynamic scenario of the network, larger terrain has been covered but the problem of location is affected. Hussain et al. [13] have also supervised CHs and many variables have been utilised to select the node as a head of the group like area, flexibility, throughput, and battery. Various processes have been proposed to select cluster heads that focus on different features. Nearly, the entire group of intra-clustering packets should move across the CHs, and hence it should manage many packages. The perfect selection of cluster head and routing has been ignored which enhances the network lifetime. M narendran [14] applied a TABU search technique on Invasive weed optimization numerical problem which belongs to continuous and provides a simple mechanism for evolutionary mechanism. The limitations related to local optima is solved by TABU search mechanism.
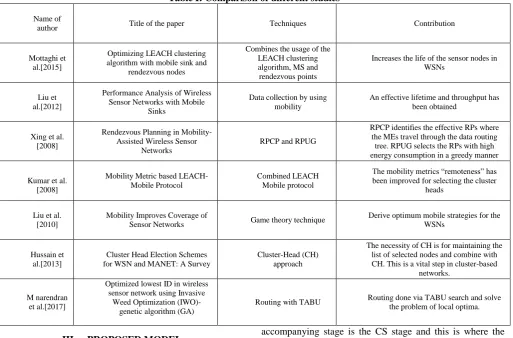
[image:3.595.43.557.300.638.2]Table 1 gives insights into the related work in simple terminologies.
Table I: Comparison of different studies Name of
author Title of the paper Techniques Contribution
Mottaghi et al.[2015]
Optimizing LEACH clustering algorithm with mobile sink and
rendezvous nodes
Combines the usage of the LEACH clustering algorithm, MS and rendezvous points
Increases the life of the sensor nodes in WSNs
Liu et al.[2012]
Performance Analysis of Wireless Sensor Networks with Mobile
Sinks
Data collection by using mobility
An effective lifetime and throughput has been obtained
Xing et al. [2008]
Rendezvous Planning in Mobility-Assisted Wireless Sensor
Networks
RPCP and RPUG
RPCP identifies the effective RPs where the MEs travel through the data routing tree. RPUG selects the RPs with high energy consumption in a greedy manner
Kumar et al. [2008]
Mobility Metric based LEACH-Mobile Protocol
Combined LEACH Mobile protocol
The mobility metrics “remoteness” has been improved for selecting the cluster
heads
Liu et al. [2010]
Mobility Improves Coverage of
Sensor Networks Game theory technique
Derive optimum mobile strategies for the WSNs
Hussain et al.[2013]
Cluster Head Election Schemes for WSN and MANET: A Survey
Cluster-Head (CH) approach
The necessity of CH is for maintaining the list of selected nodes and combine with CH. This is a vital step in cluster-based
networks.
M narendran et al.[2017]
Optimized lowest ID in wireless sensor network using Invasive
Weed Optimization (IWO)-genetic algorithm (GA)
Routing with TABU Routing done via TABU search and solve the problem of local optima.
III. PROPOSED MODEL
The RZLEACH model considers a structure made out of a predefined quantity of nodes placed discretionarily in a testing area. The entire group of nodes has starting energy that is proportional to E0 and mobile sink position is on y-axis initially. The position of the sink node can be changed after every consecutive round. The energy of the sink is assumed to be unlimited. In the proposed estimation, every round is initiated with a setup stage and then shifts to a steady state where it remains. The setup-stage involves 3 stages. The first mastermind is assignment appointment (AA), where the roles of different nodes are selected. The
A. Assignment Appointment (AA)
All nodes are assumed as normal nodes. Every node individually chooses whether they meet Rendezvous node condition or not. In the system model, the distance between the nodes is compared to the path of MS. When the nodes satisfy the conditions, the node is marked as RN. The conditions for the node to be classified as RN node, is given on equation.
1
1
2
2
m m
x i x
y
y
R
y
R
(1)
Where ym denotes the breadth of the sampling area h, yi denotes the location of the nodes in the y-axis and constant Rx should have a value less than one.
Rendezvous node Selection Process All source node (S) are normal nodes (NN)
Normal node (NN) broadcasts a message containing the condition, which met to the RN.
1
1
2
2
m m
x i x
y
y
R
y
R
Set node=RN
\\ Compare their distances At mobile sink trajectory
If (the distance of node < MS trajectory) Then RN label is attached to NN. Else
Set to NN. End if
All normal nodes are scanned for different rounds. The RN will become choose for forwarding the data.
End
B. Cluster head selection
When a node chooses to wind up a CH, at that point, its determination should be possible based on three factors; the current CHs percentage (i.e. Somewhere in the range of 5% to 10%), the frequency of a node being elected as CH and the power that is consumed by the sensor nodes [22,23]. On the off chance that the nodes energy level is more noteworthy or equivalent to the normal energy of all nodes, then the nodes naturally take an interest in the cluster head determination and if not then they will cause a postponement of 1/p rounds. The nodes create random number in the range of 0 and 1. When the value is lesser than the threshold value T (n), that particular node will be selected as a cluster head in this particular round and then CH labelling will append to it which is shown in equation 2 below:-
𝑇(𝑛) = {
𝑝
1 − 𝑝 ∗ (𝑟mod1/𝑝)𝑖𝑓𝑛 ∈ 𝐺 0
(2)
Where,
P is the amount of cluster nodes in percentage. R is the existing round G is sets of nodes that are not allotted as CH for the last 1/p round.
The nodes, which are not selected as a CH will be designated as an ordinary operational node in WSN
network. Once the RNs and CHs are selected, each of these nodes imparts progress information to the Normal nodes (NNs). These nodes should maintain their beneficiaries ON in the midst of this period of setup stage for hearing adverts from each of the RHs and CHs. These utilize CSMA traditions and send their adverts by utilizing comparative transmitting essentials. Each of the nodes decides which aggregate it has to place and which RN is closer. This is decided by considering the difference between the NNs and the other nodes. When they are switched off, the region of the nodes is identified using GPS [24, 25, 26]. The signal quality of the advert messages identifies which node will be nearer to the NN. The one, which is closer, sends a signal. In this phase, each CH creates a schedule using Time Division Multiple Access (TDMA) protocol. During this phase, the schedule is transmitted to every sensor node regardless of where they can send data. The nodes maintain the radio in „ON‟ mode only during their allotted slot of time, which decreases the power consumed by the sensor nodes as every node know the transmission time for data transmission [27,28].
Cluster head selection Phase Begin
Initialise the new 1/p round
The first Node computes the threshold value T(i) of the prevailing round
The first Node generates and selects a value randomly between 0 and 1.
If (rand(i) < T(i))
Then node i is chosen as a CH node in the present round and transmits its status.
Else
Node i is non CH node, waits for data come from CHs and choose the nearest one to join it.
Endif
Node i completes the clustering setup and attains steady state where it transfers the data
End
C. Data transmission
There are two cases for data transmission. First one with the Artificial bee colony optimization and another with the TABU-GA optimization algorithm.
CASE1:- Routing done via artificial bee colony
After getting information from every one of the nodes, CH begins grouping the information accumulated and passes the information either to MS or nearest RN.
ABC Procedures for Routing Optimization
The ABC algorithm, which is a meta-heuristic system was proposed by Karaboga [19] as employees, onlookers and scouts bees. These honey bees, which are using a sustenance source, are known as employee bees. The quantity of the employee honeybees depends on the amount of food source [20, 21]. Onlookers are honeybees, which are sitting tight in the beehive for the employee honeybees to convey the data on the nourishment sources directly being misused by them. Typically, the quantity of the onlookers is considered equivalent to the number of employed honeybees. Employed honeybees share data on the source of food by moving in the move territory inside the beehive. The move is subjected to the nectar substance of the food-source simply misused by the moving honeybee. The onlooker honeybees look at the move and pick a sustenance source as indicated by the likelihood relative to the nature of that source of food. Along these lines, sources with better nectar attract more onlooker honeybees in contrast to bad sources. Finally, scouts are the honey bees, which hunt down new sustenance sources in the area of the beehive. The employee honeybees whose nourishment sources have been relinquished turns into scouts. These scouts may be considered as playing out the activity of investigation, whereas employee and onlooker honeybees may be considered as playing out the activity of abuse. Each of the food sources is a conceivable answer to the issues and the quantity of the nectar present in the food sources denote the solution‟s quality that is denoted by the fitness value. This is highlighted in eq. (3):
1
1
0
1+abs(f ) if f
0
x x x x
if f f f t
x x
(3)
Where, f is the objective-function, which must be upgraded. ABC calculation takes after an iterative procedure. It begins by linking every employed honeybee with one food source created in random. After statement, the number of inhabitants in the arrangements is subject to rehashed cycles of the hunt procedures of the employee honeybees, the onlooker honeybees and scout honeybees. In every cycle, the employee honeybee decides a source of food that is close to the region of its current source and then computes its nectar sum (wellness). In the event that its nectar content is higher when compared to the older source, the employee honeybee shifts to this newer food source relinquishing the older one, else, it stays at its old nourishment source. In the wake of looking at the dance of the employee honeybees, an onlooker honeybee travels to the area of the food source with the likelihood, which is highlighted in eq. (4):
(4) ABC algorithm comprises of one portion of aggregate as employed honeybees and remaining as out-looker honeybees in a system and the places of related food sources are brought forth subjectively at the beginning. At the next
stage, new places of food sources are chosen by the employed honeybees by utilizing Eq. 5.
(
)
xy xy xy xy ky
u
a
a
a
(5)
Here uxy = applicant solution, axy = present solution aky = adjacent solution
ø = self-assertive number between - 1 to 1
If the quantity of the nectar of the newly learnt location is more when compared to the present source of food, then the employee bees select that particular source, otherwise it retains the previous one. In the next stage, employee bees give the data of all the sources of food with its related nectar information to the onlooker bees. The scout bees come out with other solutions within a limited procedure and newer source of food is produced at random by the scout bees. By assuming the source is axy, scout bees find out the new food source will be:
(0,1)(
)
xy i i i
a
lower
random
upper
lower
(6) Where, lower I represent the lower bound and upper I represent the upper bound of the changing newer position. These stages are repeated using a pre-set amount of cycles known as “Maximum Cycle-Number” (MCN) or until the condition for termination is not met .
CASE2:- Routing done via TABU-GA Technique
Tabu search has pioneered the systematic exploration of memory functions in search processes, while genetic algorithms have pioneered the implementation of methods
that exploit the idea of combining solutions. There is also another approach, related to both of these, that is frequently
overlooked. The procedure called scatter search, whose origins overlap with those of tabu search (and roughly coincide with the emergence of genetic algorithms) also proposes mechanisms for combining solutions, with useful features that offer a bridge between tabu search and genetic
algorithms.
IV. SIMULATION ENVIRONMENT
Extensive testing is performed using MATLAB simulator for enhancing the efficiency and network lifetime [22, 23]. In the simulator, 100 nodes, which are positioned in the area of 150×150 m2 have been taken. The position of nodes is randomly distributed and the sink‟s position is moved along the y-axis. The initial energy of every node operational in the network is 0.5 J. The snapshot of 100 sensor nodes which is being deployed in the area of (150×150) m2 is shown under the MATLAB simulator. The Simulation parameters which have been taken while the simulations atre described in the table with their respective values. The total number of nodes are 100 and area of simulation is 150 × 150 m2 for the simulation and their energy is 0.5 Joule. Rest of the values are prescribed in the table II.
TableII:- Simulation Parameters
Parameters Value
Area of the network
(x,y) 150×150 m2
Position of Base Station(x,y)
Moving along Y- axis
Number of nodes 100
The probability of
being a cluster head 0.1
Initial Energy 0.5J
Tx Energy 50 nJ/bit
Rx Energy 50nJ/bit
Free space
Energy(amplifier) 1.0nJ/bit/m2 Multipath Energy 0.0013nJ/bit/m2
Message Size 1800 bits
Simulation time 3000 seconds
Figure 2 represents 100 sensor nodes being deployed in the area of (150×150) m2. The MATLAB simulator is used for evaluating the results based on the number of dead nodes, the quantity of alive nodes and packets transmitted to the BS. The green circulars are showing sensor nodes and blue lines are showing communication among nodes in (a), red circulars are showing dead nodes in (b). The green diamond-shaped is showing mobile sink in (c).
V. RESULTS AND DISCUSSION
The performance of ABC-RZLEACH and TABU-GA RZLEACH is evaluated by using the network area of
(150×150) m2 on the metrics like quantity of dead nodes, the quantity of alive nodes and Remaining Energy.
Evaluation of RZLEACH, ABC-RZLEACH and TABU-GA RZLEACH by using network size 150×150 m2
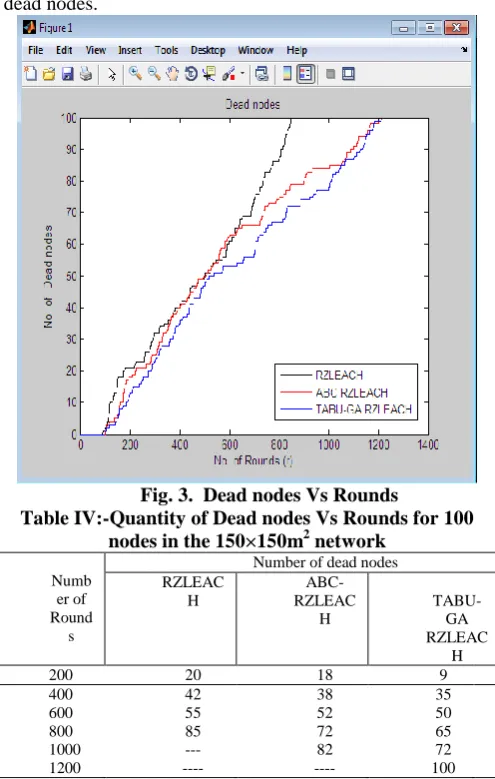
Dead Nodes:- Figure 3 demonstrates the point-by-point perspective of dead nodes conduct in RZLEACH and ABC-RZLEACH and TABU-GA ABC-RZLEACH technique. The lifetime of the network can be evaluated by using the number of dead nodes. It has been observed that more adjustments are secured by the ABC-RZLEACH and TABU-GA RZLEACH as compared to RZLEACH. It is concluded that, in TABU-GA RZLEACH protocol, the death of first node occurs 40% more as compared to the FND in RZLEACH. The last dead node occurs earlier in the case of RZLEACH and ABC-
RZLEACH instead of TABU-GA RZLEACH protocol and Table 4 represents the numeric values correspond to the dead nodes.
Fig. 3. Dead nodes Vs Rounds
Table IV:-Quantity of Dead nodes Vs Rounds for 100 nodes in the 150×150m2 network
Numb er of Round s
Number of dead nodes RZLEAC
H
ABC-RZLEAC
H
TABU-GA RZLEAC
H
200 20 18 9
400 42 38 35
600 55 52 50
800 85 72 65
1000 1200
--- ----
82 ----
72 100
Alive nodes:-
Figure 4 represents the number of nodes, which are still alive against time steps (rounds). From the network, it is imperative that the technique performs better than RZLEACH on the basis of lifetime capacity of the network. This is because of the effective selection of cluster head and TABU-GA algorithm for performing routing.
LND of RZLEACH is at round 820 and in case of ABC-RZLEACH and TABU-GA ABC-RZLEACH it is 1200. Table 5 represents the numeric
[image:6.595.303.551.251.641.2]Fig. 4. Alive nodes Vs Rounds
[image:7.595.65.276.49.303.2]Table VI:- Remaining Energy Vs Rounds for 100 nodes in the 150×150m2 network
Table V:-Amount of alive nodes Vs Rounds for 100 nodes in the 150×150m2 network
Number of Rounds
Number of Alive nodes RZLEACH
ABC-RZLEACH TABU-GA
RZLEACH
200 79 82 88
400 59 60 65
600 40 39 50
800 15 29 35
1000 1200
--- ----
18 ----
25 ---
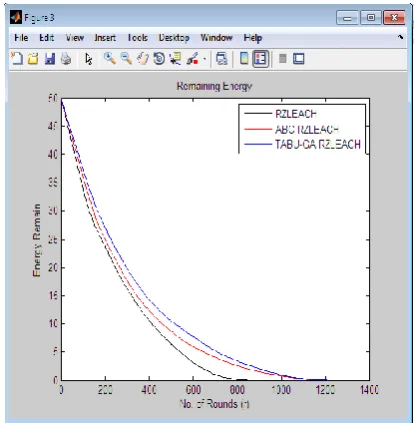
Remaining Energy:-
It is defined as the amount of energy left with sensor nodes. It is computed at the beginning of each round during execution of the algorithm. This parameter helps to determine the stability period, consumption of energy, and lifetime of WSNs. The residual energy is a major parameter to be considered for WSNs, that is calculated using
RemEng re = nN=1Err(Nd)
Where Err(Nd) is the energy of Ndth node for the rrth
[image:7.595.44.292.504.634.2]round. Table 6 represents the numeric values correspond to the Remaining Energy
Fig. 5. Remaining Energy Vs Rounds VI. CONCLUSION AND FUTURE SCOPE Current work forwards our last studies done in the same area of WSN [24,25]. While now this work going towards development of IoT[26-28]. But optimization was still a problem that has been solved in this paper by ABC and
TABU-GA optimization algorithm. The TABU-GA
optimization algorithm is applied in an effective manner considering the stability and lifetime of the network when comparing to ABC-RZLEACH and RZLEACH. The TABU-GA optimization algorithm and ABC-RZLEACH strategy drags out the system nodes lifetime, which additionally upgrades the system's capacity for a higher number of rounds and TABU-GA has exploration over the memory search and genetic algorithm implements the method which exploit the idea of combining the solution.The protocol behaves in a consistent manner when the area is 150×150m2. With these steps, the performance of the algorithm enhances dead nodes, the Last node dead LND of RZLEACH is at round 820 and in case of ABC-RZLEACH and TABU-GA ABC-RZLEACH it is 1200. At the round of 800 in dead nodes, the total number of node is 85 in the case of RZLEACH protocol and 72 in case of ABC- RZLEACH and and 65 in case of TABU-GA RZLEACH. This shows more work can be done and it will enhanced lifespan of the network. In the near future, we need to gather data which can be utilize to decide the path loss in application that relies upon RSSI(Received signal strength indicator) and path loss exponent for example, RSS-based confinement and energy analysis and work on clustering as well as routing which extend the work of the proposed algorithm by testing its reliability and network performance by applying other swarm-based techniques like cuckoo search, flower pollination, spider monkey optimization, Glow-worm, Meercat Clan algorithm, etc.
Number of Rounds
Remaining Energy RZLEACH
ABC-RZLEACH TABU-GA
RZLEACH
200 22 25 28
400 11 14 16
600 3 8 10
800 --- 5 7
1000 1200
--- ----
2 ----
REFERENCES
1. Bala, V. M., Kumar, M., & Sharma, V. A survey on swarm intelligence techniques.
2. Luo, J., & Hubaux, J. P. (2005, March). Joint mobility and routing for lifetime elongation in wireless sensor networks. In Proceedings IEEE 24th Annual Joint Conference of the IEEE Computer and Communications Societies. (Vol. 3, pp. 1735-1746). IEEE.
3. Heinzelman, W. R., Chandrakasan, A., & Balakrishnan, H. (2000, January). Energy-efficient communication protocol for wireless microsensor networks. In Proceedings of the 33rd annual Hawaii international conference on system sciences(pp. 10-pp). IEEE. 4. Liang, W., Luo, J., & Xu, X. (2010, December). Prolonging network
lifetime via a controlled mobile sink in wireless sensor networks. In 2010 IEEE Global Telecommunications Conference GLOBECOM 2010 (pp. 1-6). IEEE.
5. Liu, B., Brass, P., Dousse, O., Nain, P., & Towsley, D. (2005, May). Mobility improves coverage of sensor networks. In Proceedings of the 6th ACM international symposium on Mobile ad hoc networking and computing (pp. 300-308). ACM.
6. Gu, Y., Ji, Y., Li, J., & Zhao, B. (2012). ESWC: Efficient scheduling for the mobile sink in wireless sensor networks with delay constraint. IEEE Transactions on Parallel and Distributed Systems, 24(7), 1310-1320.
7. Konstantopoulos, C., Pantziou, G., Gavalas, D., Mpitziopoulos, A., & Mamalis, B. (2011). A rendezvous-based approach enabling energy-efficient sensory data collection with mobile sinks. IEEE Transactions on parallel and distributed systems, 23(5), 809-817.
8. Mottaghi, S., and Zahabi, M. R., 2015. Optimizing LEACH clustering algorithm with mobile sink and rendezvous nodes. AEU-International Journal of Electronics and Communications, 69(2), 507-514. 9. Liu, W., Lu, K., Wang, J., Xing, G., & Huang, L. (2012). Performance
analysis of wireless sensor networks with mobile sinks. IEEE Transactions on Vehicular Technology, 61(6), 2777-2788.
10. Xing, G., Wang, T., Xie, Z., & Jia, W. (2007, December). Rendezvous planning in mobility-assisted wireless sensor networks. In 28th IEEE International Real-Time Systems Symposium (RTSS 2007) (pp. 311-320). IEEE.
11. Kumar, G. S., Vinu, P. M., & Jacob, K. P. (2008, December). Mobility metric based leach-mobile protocol. In 2008 16th International conference on advanced computing and communications (pp. 248-253). IEEE.
12. Liu, B., Brass, P., Dousse, O., Nain, P., & Towsley, D. (2005, May). Mobility improves coverage of sensor networks. In Proceedings of the 6th ACM international symposium on Mobile ad hoc networking and computing (pp. 300-308). ACM.
13. Hussain, K., Abdullah, A. H., Awan, K. M., Ahsan, F., & Hussain, A. (2013). Cluster head election schemes for WSN and MANET: a survey. World Applied Sciences Journal, 23(5), 611-620.
14. Narendran, M., & Prakasam, P. (2017, February). Optimized lowest ID in wireless sensor network using Invasive Weed Optimization (IWO)-genetic algorithm (GA). In 2017 International Conference on Algorithms, Methodology, Models and Applications in Emerging Technologies (ICAMMAET) (pp. 1-6). IEEE.
15. Karaboga, D., Okdem, S., and Ozturk, C., 2012. Cluster based wireless sensor network routing using artificial bee colony algorithm. Wireless Networks, 18(7), 847-860.
16. Zorzi, M., and Rao, R. R.,2003. Geographic random forwarding (GeRaF) for ad hoc and sensor networks: energy and latency performance. IEEE transactions on Mobile Computing, 2(4), 349-365. 17. El-Basioni, B. M. M., El-Kader, S. M. A., Eissa, H. S., and Zahra, M.
M., 2011. An optimized energy-aware routing protocol for wireless sensor network. Egyptian Informatics Journal, 12(2), 61-72.
18. Misra, S., and Thomasinous, P. D., 2010. A simple, least-time, and energy-efficient routing protocol with one-level data aggregation for wireless sensor networks. Journal of systems and software, 83(5), 852-860.
19. Karaboga, D., and Ozturk, C., 2011. A novel clustering approach: Artificial Bee Colony (ABC) algorithm. Applied soft computing, 11(1), 652-657
20. Okdem, S., Karaboga, D., and Ozturk, C., 2011, June. An application of wireless sensor network routing based on artificial bee colony algorithm. In 2011 IEEE Congress of Evolutionary Computation (CEC) (pp. 326-330). IEEE.
21. Karaboga, D., and Akay, B., 2009. A comparative study of artificial bee colony algorithm. Applied mathematics and computation, 214(1), 108-132.
22. Nayyar, A., & Singh, R. (2015). A comprehensive review of simulation tools for wireless sensor networks (WSNs). Journal of Wireless Networking and Communications, 5(1), 19-47.
23. Ali, Q. I. (2012). Simulation framework of wireless sensor network (WSN) using matlab/simulink software. In MATLAB-A Fundamental Tool for Scientific Computing and Engineering Applications-Volume 2. IntechOpen.
24. Kumar, N., Kumar, A., & Chaudhry, D. (2011). A Novel Approach to use Nano-Sensor in WSN Applications. International Journal of Computer Applications, 975, 8887.
25. Pandey, A., Kumar, N., & Tripathi, R. C. A Framework to Prevent Mobile Sinks Accessing by Unauthorized Nodes in WSN, Special issue on MANET, IJCA (USA), pp.-13-17, 2010.
26. Kumar, N., & Khan, R. A. (2017). Emergency Information System Architecture for Disaster Management: Metro City Perspective. International Journal of Advanced Research in Computer Science, 8(5). 27. Kumar N., Agrawal A., Khan R.A. (2018) Smartphone with Solar Charging Mechanism to Issue Alert During Rainfall Disaster. In: Panda B., Sharma S., Roy N. (eds) Data Science and Analytics. REDSET 2017. Communications in Computer and Information Science, vol 799. Springer, Singapore.
28. Kumar, N., Agrawal, A., & Khan, R. A. (2019). Cost estimation of cellularly deployed IoT-enabled network for flood detection. Iran Journal of Computer Science, 1-12.
AUTHOR’S PROFILE
Varsha, received her B-Tech from MIMIT, Malout, India and Master of Technology in Computer Science and Engineering from Guru Nanak Dev Engineering college, Ludhiana in the year 2011 and pursuing her Ph.D. from Punjab Technical University Jalandhar. She has published many papers in IEEE Conferences & Scopus Indexed Journals and many more in the International/National Conferences. Her area of interest is Wireless Sensor Network, Data Communication and Computer Network.
Manju Sharma, received her B-Tech from UP Technical University, Lucknow, India and Master of Technology in Computer Science and Engineering from Punjab Technical University Jalandhar, in the year 2007 and she has done her Ph.D. from Punjab Technical University Jalandhar. Currently, she is director at Khalsa College of Engineering & Technology, Amritsar Punjab, India. She has published many papers in IEEE Conferences & Scopus Indexed Journals and many more in the International/National Conferences. Her area of interest is Wireless Sensor Network, Data Communication and Computer Network. She is guiding many research scholars.
Manoj Kumar, received his B.E (ECE) from Gulbarga University in the year 1990 & received his M-Tech (ECE) from Punjab Technical University, Jalandhar in the year 2001 & Ph.D. from Punjab Technical University Jalandhar in the year 2007. His area of specialization is Optical fibre Communication, Wireless Communication. He is currently a director at DAV Institute of Engineering & Technology, Jalandhar. He has visited many Countries like U.S.A, U.K, France and Italy. He is a life member of ISTE & Punjab Academy of Sciences.