International Journal of Innovative Technology and Exploring Engineering (IJITEE) ISSN: 2278-3075, Volume-8 Issue-5S March, 2019
Abstract: This paper presents the optimized design and control of a stand-the only hybrid power system with power management function using a modified search algorithm for cuckoo. The hybrid system comprising PV, Wind, Battery and Fuel Cell is connected to a common DC bus from which the load is supplied with a DC-AC converter. The two main sources namely wind and PV are embedded with MPPT controller to obtain optimum output. The battery which supplies the load during reduced PV output and fuel cell with electrolyzer is considered as an additional support of power to the DC bus. In addition, for power management in the hybrid system, the modified cuckoo search algorithm is proposed to improve the DC bus voltage and supervise the power sharing between loads and different sources. The results obtained are compared to the conventional controller to demonstrate the efficiency of the soft computing approach proposed. The whole system is constructed using the MATLAB Simulink environment and the results of the simulation are presented to validate the proposed method.
Index Terms: Hybrid Power system (HPS), Modified Cuckoo search Algorithm, Maximum Power Point Tracking (MPPT), Wind Turbine (WT), Fuel Cell, Electrolyzer.
I. INTRODUCTION
Energy is the prime requirement for the economic development of a country. Since the existence of humanity and till date energy is been extracted from fossil fuels using various technologies. These fuels are super rich but are limited resources which also degrades the environment. Of late many developing nations are still depending on these fossil fuels which make up a large portion of their energy market. Renewable or alternative energy resources are considered a good substitute for these reasons and offer many advantages. The primary advantage is that these sources are renewable and therefore sustainable and environmentally friendly. Solar and wind are the two major resources which is being widely harvested using matured technologies. Meanwhile the major setback of renewable sources is that they are unpredictable and inconsistent [1]-[5]. These drawbacks have motivated the concept of hybrid power system which consists of renewable sources along with conventional sources like diesel generators. Hybrid system utilizes the best features of individual energy source and provides quality power ranging from a few kW to hundreds of kW [6].
Revised Manuscript Received on March 08, 2019.
Harish R, Assistant Professor, Dept. of EEE, SNS College of Engineering, Coimbatore, Tamilnadu, India
Karthick R, Assistant Professor, Dept. of EEE, SNS College of Technology, Coimbatore, Tamilnadu, India
These systems deliver a high level of energy security and reliability. Hybrid systems along with storage capabilities are designed to serve the rural electrification and also acts as a backup source for main grid in case of blackout and other contingencies. Therefore prior to design of hybrid power system, an initial survey of load demand and site inspection has to be carried out. These hybrid power systems are classified into two main types of hybrid power systems, which are standalone and connected to the grid.
The primary objective of hybrid power system is to extract maximum energy from the available resources thereby providing quality and reliable power to consumers. Standalone solar and wind energy systems are considered to be the favorite sources because of its availability in abundance at free of cost. A typical hybrid power system consists of the above said standalone systems along with a diesel generator of fuel cell (latest substitute) with energy storage system, a controller unit and power conditioning unit. Different control algorithms are therefore available to extract maximum power from renewable energy sources [7]-[16]. There are numerous MPPT techniques available in literature having different algorithm and hardware components.
Recently fuel cell has replaced the diesel generator in hybrid power system owing to various reasons which includes high generation cost and pollutes environment through greenhouse gases. Fuel cell is a device that directly converts fuel and oxidant chemical energy into electricity. It does not produce any greenhouse gases and also produces output continuously. The operation is battery - like, but a fuel cell is a non - conventional energy source. Fuel cell is characterized by numerous advantages which includes efficiency, fast demand response, fuel flexibility and low cost [17]-[19]. Fuel cells are generally classified depending on the type of electrolyte and their operating temperatures. Among the various fuel cells available, Polymer Electrolyte Membrane Fuel Cell (PEM) type which uses hydrogen as fuel is most preferred because of its high efficiency and low operating temperature.
The advantages of such a hybrid system can be realized only when the sources are sized appropriately and an efficient energy management solution is put in place. A detailed literature survey reveals that there are numerous optimization techniques for energy management problems [19-21]. The management scheme should offer a stable voltage, minimized energy cost and should extract maximum energy available from the source.
Optimized Design and Control of a Stand-Alone
Hybrid Power System using Modified Cuckoo
Search Algorithm
A modified Cuckoo search algorithm for power management is developed in this paper in order to achieve the following objectives.:
Both PV and wind are operated optimally using suitable MPPT techniques.
The DC voltage across the bus is maintained constant irrespective to the variations in sources.
Energy from various sources are managed optimally between loads which ensures reliable quality power to customers.
The paper is organized into the sections below. Section I describes how the paper was introduced. Section II explains the main design of the hybrid power system, which includes solar, wind and fuel cell modelling. The proposed modified Cuckoo search algorithm is also discussed in the same section. Section III discusses the hybrid system simulation model in which the results and discussion are discussed in Section IV. Section V concludes the proposed work.
II. DESIGN AND MODELLING OF HYBRID POWER SYSTEM
The proposed hybrid power system block diagram shown in Figure 1 consists of a solar PV system, a wind turbine system, a fuel cell with an electrolyzer and a battery system. All sources are connected to a convenient electronic interface system to a common DC bus. The energy from solar PV system is harvested through a DC-DC converter which operates in boost mode. As shown in Figure 1, the wind energy system is connected to the DC bus through a back - back connected converter, which includes an uncontrolled AC - DC rectifier unit and a boost converter for DC - DC. The fuel cell is connected by a DC - DC boost converter and the electrolyzer acts as an input to the fuel cell, which also draws power from the DC bus. Finally, the battery system is connected through a bidirectional converter. The detailed modelling of the above sources is discussed in the preceding section.
Fig. 1 Block diagram of Hybrid Power Systems Solar PV system with MPPT Controller
Solar cell is a photovoltaic device that converts sunlight energy into electricity based on photovoltaic effect. The solar energy is interim in nature and depends on various parameters like irradiance and temperature which are natural parameters.
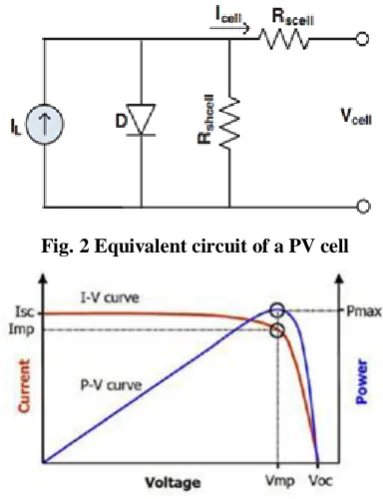
These factors necessitate an accurate model for solar cell that will include the effect of the above factors. Figure 2, from which an expression for the output current is derived [2], shows the equivalent circuit of an ideal solar cell.
(1) where, I = output current
IL = photo generated current ID = Diode current
ISH = Shunt current η = diode ideality factor VT= 0.0259 volt
[image:2.595.329.521.243.493.2]It is seen that the solar cell is modeled in antiparallel to a diode as a current source.
[image:2.595.50.289.522.700.2]Fig. 2 Equivalent circuit of a PV cell
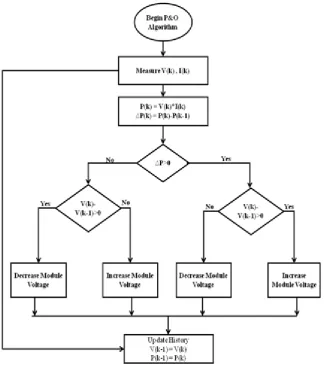
Fig. 3 PV and IV characteristics of PV Cell
International Journal of Innovative Technology and Exploring Engineering (IJITEE) ISSN: 2278-3075, Volume-8 Issue-5S March, 2019
Fig. 4 Perturb and Observe flow chart Wind Energy Conversion System
The conversion system of wind energy converts kinetic energy into mechanical energy and electrical energy. The system consists of a Permanent Synchronous Magnet Generator (PMSG) and a connected back - to - back converter [2]. The kinetic energy of the flowing air mass per unit time gives the power contained in the wind. That is.
Pair = ρ A V∞3 (2)
where, Pair is the power contained in wind (in watts), ρ is the air density (1.225 kg/m3) at 15°C and normal pressure), A is the swept area in (square meter), and V∞ is the wind velocity without rotor interference, i.e., ideally at infinite distance from the rotor (in meter per second).
Although Equation (2) provides the wind power, the power transferred to the rotor of the wind turbine is reduced by the power coefficient, Cp
Cp = (3)
Pwind turbine = Cp*Pair
= ρAV∞ 3 (4)
The Betz limit defines the maximum value of Cp, which states that a turbine can never extract more than 59.3% of the power from an air stream. The tip velocity ratio is set as,
λ = (5)
Where, is rotational rotor speed (in rpm), R is the swept area radius (in meter). The two dimensional parameters,
namely the tip velocity ratio λ and the power coefficient Cp, describe the performance of any size of the wind turbine rotor.
The wind turbine output power, i.e. the power supplied by the rotor, is given by:
ρ
(6) where, ρ = air density (kilograms per cubic meter), vw = wind speed in meters per second,
A = blades’ swept area,
Cp = turbine-rotor-power coefficient, which is a function of the tip-speed ratio (λ) and pitch angle (β).
ωm = rotational speed of turbine rotor in mechanical radians per second, and
R = radius of the turbine
The coefficient of performance of a wind turbine is influenced by the tip-speed to wind-speed ratio, which is given by
TSR = (7)
The wind turbine can produce maximum power when the turbine operates at maximum Cp (i.e., at ). The rotor speed must therefore be kept at the optimum value of the tip - speed ratio λopt which is usually achieved using an
The DC - DC boost converter's duty ratio is adjusted in this paper to achieve the optimum power output value.
The optimum target power from a wind turbine is given by
(8)
Where
Therefore, the target optimum torque is given by
(9)
In view of the fact that the voltage expression of the PMSG in the reference frame of the dq - axes is given under balanced conditions,
(10)
where, Vds and Vqs are the instantaneous stator voltages in the dq-axes reference frame, and ids and iqs are the instantaneous stator currents in the dq-axes reference frame. Here, Ld and Lq are the d-axis and q-axis inductances, and ωe is the electrical angular speed of the rotor, while λr is the maximum phase flux linkage due to the rotor.
Fuel Cell
A fuel cell is a device that directly converts the fuel and oxidant's chemical energy into electricity [2]. The fuel cell operation is determined by the following equation.
+
electrical energy + heat (11)
The dynamic modeling of fuel cell is given by,
(12) where, Ecell = The cell's thermodynamic potential.
Vact = activation overvoltage
Vohmic = ohmic overvoltage.
Vcon = concentration overvoltage
The Nernst equation based on above expression is given by,
(13)
Where, T is the temperature of the cell (K), PH2 is the partial pressure of hydrogen and PO2 is the partial pressure of oxygen at the anode and cathode, and E0,cell is the voltage of the open circuit:
(14) The Overvoltage of activation (loss due to anode and cathode activation) in a fuel cell provided by,
(15) Co2 is the concentration of dissolved oxygen at the liquid gas interface, where iFc is the operating current of the cell and ζ1, ζ2, ζ3, ζ4 is the parametric coefficient of the fuel cell. Ohmic loss of fuel cell is expressed as,
(16) Where, Rel is the electron flow membrane resistance and
RPr is the proton flow resistance.
The concentration voltage drop due to reaction process is given by,
(17)
Where B represents a parametric coefficient (v) and j represents the cell's actual current density (A/cm2) and jmax is the limiting current density.
Assuming the lumped parameter representation of fuel cell stack, the total output voltage is given by,
(18) Where, Ncell = Number of stacked fuel cell.
Vcell = fuel cell voltage.
Ecell = The fuel cell's thermodynamic potential.
Vact, vcon, vohmic are losses introduced into the fuel cell.
Electrolyzer
An electrolyzer is an electrochemical device which splits water into hydrogen and oxygen using electric current. According to Faraday's law, the amount of hydrogen produced in an electrolyzer cell is directly proportional to the total number of electrons emitted from the electrodes, which is nothing other than the equivalent electrical current in the circuit [2]:
(19)
= Hydrogen production rate, mol s-1,
= Faraday’s efficiency,
nc = the number of electrolyzer cells in series
ie = electrolyzer current [A]
F = Faraday constant [C kmol-1]
III. OPTIMIZED ENERGY MANAGEMENT
SYSTEM
International Journal of Innovative Technology and Exploring Engineering (IJITEE) ISSN: 2278-3075, Volume-8 Issue-5S March, 2019
Table. 1 Operating Conditions
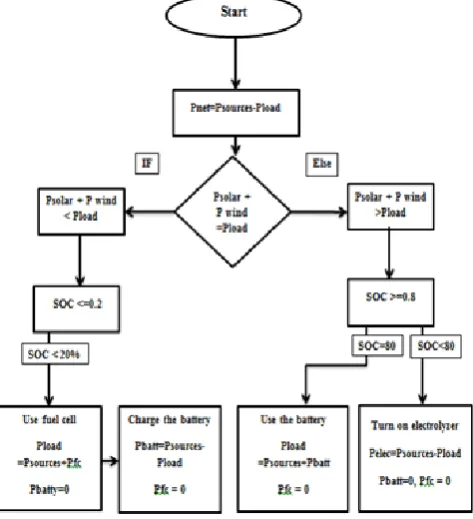
The flowchart for the proposed optimized energy management system is shown in figure 5. The process gives prime importance to the main sources like solar and wind. Both the major sources are always operated at their maximum power point using their MPPT.
Fig. 5 Flowchart for Optimized Energy Management System
IV. SIMULATION RESULTS
[image:5.595.304.549.153.282.2]MATLAB / Simulink software models and simulates the complete hybrid model with all sources and loads. The parameters used for various models are presented in Appendix-I. MATLAB has A 2 Kw solar panel. As shown in Figure 6, the PV array was interfaced with the boost converter.
Fig. 6 Simulink model of PV system with boost converter
[image:5.595.305.549.359.491.2]The figure 7 describes wind energy conversion model consisting of PMSG with uncontrolled rectifier of 1.5 Kw and the boost converter.
Fig. 7 Simulink model of WECS with back to back converter
Simulation Results of Hybrid System without MCSA
The simulation results for the proposed system is realized from the system without utilizing any control technique and their respective outputs are shown in below figures 8 (a) – 8 (c).
Fig. 8 (a) DC Link Voltage With-Out MCSA
MODE OPERATING CONDITIONS
Mode 1
The output power from solar and wind is equal to the load demand (Psolar + =PL) Power = 3500 Watts
Mode 2
The output power from solar and wind is less than the load demand (Psolar + <PL) Power = 2500 Watts
The battery will supply power to the load
Until the SOC of the battery becomes to 20%
Mode 3
The case of high-power source
( the excess energy is supplied into
the electrolyzer to generate hydrogen power = 3700 Watts
The control is carried out by comparing the SOC limit of battery.
Mode 4
The case of inability of the sources to
ensure the load demand (
The fuel cell produce energy for Load. Power = 3500 Watts
[image:5.595.50.287.500.760.2]Fig. 8 (b) DC Voltage of PMSG with Boost Converter
Fig. 8 (c) Output of PV Voltage and PV Power
Figure 8 (a) shows the voltage of the DC connection and it is shown that the voltage is not constant as the reference voltage indicates. The change PV voltage and power are shown in figure 8 (b). It is observed that without any controller the output varies with respect to irradiance and temperature. Figure 8 (c) shows the output from wind energy conversion system after being rectified and here also it is observed that the DC output is changing when the wind speed varies.
Simulation Results of Hybrid System with MCSA Mode – 1 Operation
The DC connection voltage is kept constant at 600Vdc in this mode of operation, as shown in Figure 9 (a). Figure 9 (b) shows the DC voltage of the WECS output, which is a constant output with MPPT technology. Figure 9 (c) shows the PV output DC voltage and the single phase 230V DC. The output power of 3500W is shown in Figure 9 (e).
Fig. 9 (a) DC Link Voltage for Mode-1 Operation
Fig. 9 (b) WECS Output DC Voltage
Fig. 9 (c) PV Output Voltage during mode 1 operation
Fig. 9 (d) Single Phase AC 230 V output voltage
Fig. 9 (e) Output of the Load Power-mode 1 operation Mode – 2 Operation
Due to the increase in load to 500 Vdc as shown in Figure 10 (a), the DC connection voltage is reduced in mode-2. Figure 10 (b) shows that the WECS constant DC voltage and PV is reduced to 100Vdc as shown in Figure 10 (c), the load output power is reduced to 1900W as shown in Figure 10 (e).
Fig. 10 (a) DC Link Voltage for Mode-2 Operation
International Journal of Innovative Technology and Exploring Engineering (IJITEE) ISSN: 2278-3075, Volume-8 Issue-5S March, 2019
Fig. 10 (c) PV Output Voltage-mode II operation
Fig. 10 (d) Single Phase AC 130 V output voltage
Fig. 10 (e) Output of the Load Power- mode 1 operation Mode – 3 Operation
The DC connection voltage in this mode is 620V dc as shown in the figure. Figure 11(b) - 11(d) shows the wind, PV and battery voltage in the DC mode - 3 operation in which the voltage of the DC connection is reduced and the remaining voltage is injected by the battery to compensate. Figure 11 (e) shows the percentage of battery discharge by charging state as shown. The output power is displayed in the 4500W figure 11 (g).
Fig. 11 (a) DC Link Voltage for Mode-3 Operation
Fig. 11 (b) WECS Output DC Voltage-mode 3 operation
Fig. 11 (c) PV Output Voltage – mode 3 operation
Fig. 11 (d) Battery Output DC Voltage-mode 3 operation
Fig. 11 (e) Battery State of Charge Discharging Percentage – mode 3 operation
Fig. 11 (f) Single Phase AC 300 V – mode 3 operation
Fig. 11 (g) Output of the Load Power – mode 3 operation Mode - 4 Operation
So, here the modes of operation show the power management of the system with modified cuckoo search algorithm is done and validated by the output waveforms of voltage and power.
Fig. 12 (a) DC Link Voltage for Mode-4 Operation
Fig. 12 (b) WECS Output DC Voltage – mode 4 operation
Fig. 12 (c) Battery State of Charge Discharging Percentage
Fig. 12 (d) Electrolyzer Charge Percentage
Fig. 12 (e) Battery charge voltage – mode 4 operation
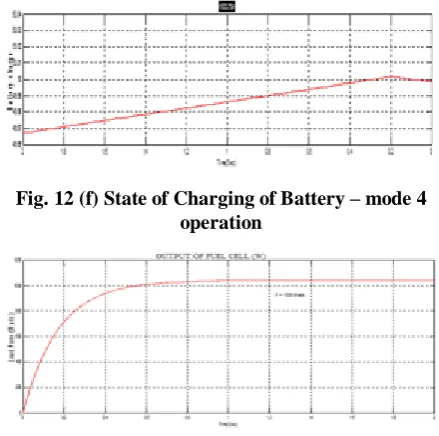
Fig. 12 (f) State of Charging of Battery – mode 4 operation
Fig. 12(g) Output Power of Fuel Cell- mode 4 operation
Fig. 12 (h) Total Output Load Power - mode 4 operation
V. CONCLUSION
This paper proposes an optimized energy management system using Cuckoo-Search algorithm for the hybrid power system comprising solar PV, wind, fuel cell and battery. The validity of the proposed system is tested under different operational and environmental conditions. The voltage across the DC bus is verified with and without a controller. The simulation results show that the DC bus voltage is kept at a constant value regardless of the different load conditions and the controller also ensures maximum power from both primary sources such as solar and wind. Finally, the optimized intelligent controller achieves a coordinated control among various power sources and load besides providing a continuous power supply with high reliability. The simulation results show that the intelligent controller works in both stable and dynamic conditions satisfactorily.
Appendix-I Parameters of the System
Permanent Magnet Synchronous Generator
Nominal power (Pn) 1.5 Kw
Phase inductance of the stator (Ls) 8.4 mH
Phase resistance of the stator (Rs) 0.425
Number of poles pairs (P) 10
Air density (ρ) 1.225 Kg m-3
[image:8.595.316.536.51.269.2] [image:8.595.60.281.89.741.2] [image:8.595.61.278.115.204.2] [image:8.595.60.279.224.478.2] [image:8.595.320.536.297.382.2] [image:8.595.62.279.432.728.2]International Journal of Innovative Technology and Exploring Engineering (IJITEE) ISSN: 2278-3075, Volume-8 Issue-5S March, 2019
Open circuit voltage (V) 32.9 V
Short circuit current (A) 8.21 A
Temperature (ºC) 25
Irradiance (W/m2) ≥900
Number of series cells (Ns) 54
Maximum Power (Pmax) 200 W
Fuel Cell
Exchange current (Io) 6.54 mA
Current internal (In) 230 mA
Activation voltage constant (A) 1.35V
Mass transfer constant (B) 1.29 V
FC internal Resistance (Rint) 0.045Ω No of fuel cell connected in
series (Ns)
10
No of fuel cell connected in parallel (Np)
1
Electrolyzer
Faraday’s constant (F) 96,484,600
cKmol Number of electrolyzer cells(ηc) 20 Battery
Rated voltage (V) 200
Rated current (A) 15
Rated capacity (Ah) 150
Appendix-II Modified Cuckoo Search Algorithm
A← Maxlevy Step size φ←Golden ratio
Initialise a population of n nest x_i (i=1,2,…n) For all x_i do
Calculate fitness f_i=f(x_i ) End for
Generation number G ←1
While Number of objectives Evaluations < MaxNumber Evaluations do G←G+1
Sort nest by order of fitness For all nests to be abandoned do
Current Position x_i Calculate Levy flight step size α←A⁄√G
Perform Levy flight from x_i to generate new egg x_K x_i←x_K
F_i←f(x_i ) End for
For all of the top nests do Current Position x_i
Pick another nest form the top nest at random x_j If x_i=x_j then
Calculate Levy flight step size α←A⁄G^2
Perform Levy flight from x_i to generate new egg x_K F_k=f(x_k)
Choose a random nest l from all nests If (F_K>F_j) do
x_l←x_K F_l←F_K End if
Else
dx=|x_i-x_j |/φ
Move distance dx from the worst nest to the best nest to find x_K
F_K=f(x_K) Choose a random nest l from all nests
If (F_K>F_l) then x_l←x_K F_l←F_k End if End if End for End while REFERENCES
1. Bouthaina Madaci , Rachid Chenni , Erol Kurt , Kamel Eddine Hemsas , “Design And Control of a Stand-alone Hybrid Power System,” International Journal of Hydrogen Energy, vol.41, No.29, pp.12485-12496, 2016.
2. R.Karthick, S.Manoharan. “Fuzzy based optimised energy management strategy of renewable energy sources for stand – alone applications”, Journal of Electrical Engineering, Vol.17, No.1, pp.418-426, 2017. 3. Valenciaga F, Evangelista CA., “Control design for an autonomous
wind-based hydrogen production system”, Int Journal of Hydrogen Energy, vol.35, no.11, pp.5799-5807, 2010
4. Malla SG, Bhende CN. “Voltage control of stand-alone wind and solar energy system”, Int J Electr Power Energy Systems, Vol.56, pp.361-393, 2014.
5. M. H. Nehrir, C. Wang, K. Strunz, H. Aki, R. Ramakumar, J. Bing, Z. Miao, and Z. Salameh.: A Review of Hybrid Renewable/Alternative Energy Systems for Electric Power Generation: Configurations, Control, and Applications. In: IEEE transactions on sustainable energy, vol. 2(2011), no. 4, October 2011, p.392-403.
6. T. Logeswaran,A. Senthilkumar, P. Karuppusamy, “Adaptive Neuro-Fuzzy Model for Grid-Connected Photovoltaic System,” International Journal of Fuzzy Systems, Vol.17, No.4, pp.585-594, 2015.
7. Villavla MG, Gazoli JR, Filho ER. “Comprehensive approach to modeling and simulation of photovoltaic arrays”. IEEE Tran Power Electron, vol.24, no.5, pp.1198-1208, 2009.
8. S. Ozdemir, N. Altin, I. Sefa, G. Bal “PV Supplied Single Stage MPPT Inverter for Induction Motor Actuated Ventilation Systems,” Elektronika ir elektrotechnika, vol. 20, no. 5, pp.1392-1215, 2014. 9. Arteaga Orozco MI, V_azquez JR, Salmer_on P, P_erez A., “A sliding
maximum power point tracker for a photovoltaic system”, 11th Spanish Portuguese Congress on Electrical Engineering, July 2009.
10. Y. Uzun, S. Demirbas, E. Kurt, “Implementation of a New Contactless Piezoelectric Wind Energy Harvester to a Wireless Weather Station”, Elektronika ir elektrotechnika, vol. 20, no. 10, pp.1392-1215, 2014. 11. Datta A, Bhattacharya G, Mukherjee D, Saha H, “An efficient
technique for controlling power flow in a single stage grid connected photovoltaic system”, International Journal of Science and Technology, vol.21, no.3, pp.885-897, 2014.
12. Bendib B, Krim F, Belmili H, Almi MF, Boulouma S. Advanced fuzzy MPPT controller for a stand-alone PV system, Energy Procedia, Vol.50, pp.383-392, 2014.
13. Zainuri MAAM, Radzi MAM, Soh AC, Rahim NA, “Development of adaptive perturb and observe-fuzzy control maximum power point tracking for photovoltaic boost dc-dc converter”, IET Renew Power Generation, Vol.8, No.2, pp.183-194, 2014.
14. Hiroshi N, Tatsuya N, Hiroshi M, Takenobu K. “Development of 100-W high-efficiency MPPT power conditioner and evaluation of TEG system with battery load. Journal of Electronic Materials, vol.40, no.5, pp.657-661, 2011.
16.Ishita Biswas, Vaishalee Dash, Prabodh Bajpai, “Sizing Optimization of PV-FC-Battery System with Hybrid PSO-EO Algorithm”, Annual IEEE India Conference, 2012.
17.Yun Wanga, Ken S.Chen Jeffrey Mishler, Sung Chan Cho, Xavier Cordobes Adroher, “A Review of Polymer Electrolyte Membrane Fuel Cells Technology, Applications and needs on Fundamental Research. In: Applied Energy, vol. 88, no.4, pp.981–1007, 2011.
18.Khazaee I, Ghazikhani M, Mohammadiunc M. “Experimental and thermodynamic investigation of a triangular channel geometry PEM fuel cell at different operating conditions”, Scientia Iranica, vol.19, no.3, pp.585-593, 2012.
19.Rong-Jong Wai, Shih-Jie Jhung, Jun-Jie Liaw and Yung- Ruei Chan.: Intelligent Optimal Energy Management System for Hybrid Power Sources Including Fuel Cell and Battery. In: IEEE transactions on power electronics, vol.28(2013), no. 7, July 2013, p.3231-3244. 20.Erkan Dursun and Osman Kilic, “Comparative evaluation of different
power management strategies of a stand-alone PV/ Wind / PEMFC hybrid power system”, Electrical Power and Energy Systems, Vol. 34, No.1, pp. 81-89, 2012.