Avoidance of Starvation of BE and BK Access
Categories in 802.11e
C. Ramakristanaiah, P. Chenna Reddy, R. Praveen Sam
ABSTRACT: In saturated conditions of IEEE 802.11e network, for every backoff instance, backoff counter reaches zero fast for voice and video Access Categories (ACs) and starts their transmission. Best Effort (BE), Background (BK) backoff procedures are interrupted frequently. Channel must be free to resume its backoff procedure but it is engaged by voice and Video ACs. The ACs BE and BK are denied the services of 802.11e for a long duration. This leads to starvation of BE and BK. Since these traffics are involved in the applications like browsing, texting and background services they should not be starved. This paper propose a method which makes BE and BK are been preferably served. The method evaluates the arrival rate and service rate for video, and BE Acs. If The number of packets arriving at video AC is greater t han the number packets being served by video AC, then both arrival rate service rates are balanced by improving the service rate i.e should meet the atrrival flow of video AC. Service rate is depended on transmission opportunity (TXOP) limit which is the duration of transmission of AC. The extensive analysis and simulations are conducted using ns2.35 with EDCA patched. The simulation results show that almost 74% of BE and BK packets are transmitted so that the starvation is avoided.
Key words: 802.11e, EDCA, Access category, Starvation, arrival rate, service rate, TXOP, QoS.
1. INTRODUCTION
In wireless communications the role of Medium Access Control (MAC) layer is crucial and the services provided by MAC layer have huge impact on the communication. Among all the services by MAC, channel accessing is core and effective service. Every station or any traffic has to access the channel to send its content, if not it can’t send any single bit into the network. If the station is not getting channel for longer time periods it means it is starved by other stations. Starvation is a state in which services are denied over a longer time periods [1][2]. This is very serious problem in area of communication. Starvation should not be tolerable since it degrades the performance of network [3][4]. There are several MAC protocols where each one is aimed to deal with specific problems. Occurrence of starvation depends on way of the channel is accessed. The base IEEE 802.11 MAC protocol [5] treats all traffic with same priority. Time sensitive applications like video conferencing, streaming and voice calls over IP are not preferably served by 802.11 as per their demand.
Revised Manuscript Received on May 06, 2019
C. Ramakristanaiah, Research Scholar, Dept of CSE, JNTUK Kakinada, AP, INDIA.
P. Chenna Reddy, Professor of CSE, JNTUA University, Anantapur, AP, INDIA.
R. Praveen Sam, Professor of CSE, G.Pulla Reddy Engineering College, Kurnool, AP, INDIA
It doesn’t provide Quality of Service (QoS) for such time sensitive applications. Since the performance for these applications is degraded, the IEEE task group 802.11e [6] proposed a new MAC protocol in order to satisfy the demand of QoS for real time applications. 802.11e differentiates the traffic into four ACs and continues its data transmission for transmission opportunity (TXOP) period after winning the channel in contention. For instance, All Acs has the data and all have started their backoff procudure by choosing CW values. Due to lower valued parameter set, AC VO gets the channel in contention and transmits its data for TXOP time period. When an AC starts transmission, other AC 's backoff procedures will be interrupted. In this conetst, the backoff procedures of BE and BK are interrupted frequently. This is leads to starvation of BE and BK. The parameters for ACs and their values are shown in table 1.
Table1. EDCA Parameter set and their values.
AC CWmin CWmax TXOP
VO 7 15 0.00308s
VI 15 31 0.00601s
BE 31 1023 1 MSDU
BK 31 1023 1MSDU
Avoidance of Starvation of BE and BK Access Categories in 802.11e
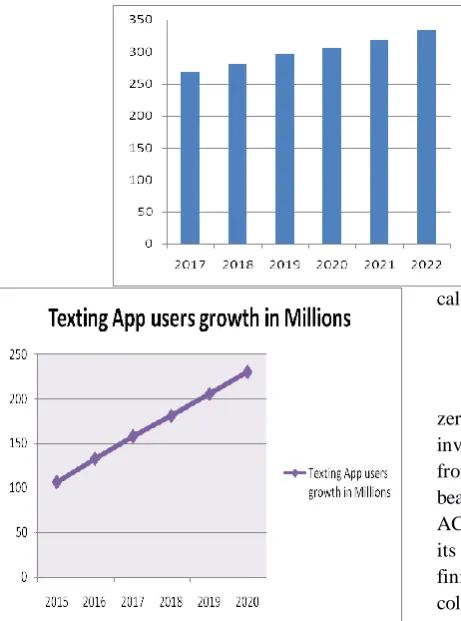
Figure 1: Number of email users per day year wise (source: Statistica website).
[image:2.595.86.317.181.492.2]To meet these requirements the flows BE and BK never be starved. If they are starved by other flows the crucial applications like browsers, search engines and emails will suffer.
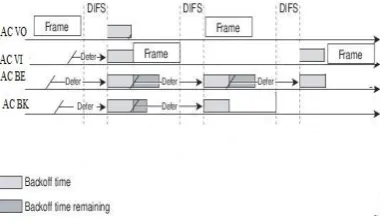
Figure 2: Number messaging app users and text data
Source: eMarketer, November 2016, Mobile messaging app users
Figure 2 shows those messaging app users in India year wise. So all applications which are using BE and BK traffic has requirements to be served otherwise leads to degradation performance of the network.
Every IEEE 802.11e station has four queues. Each queue uses Arbitration Inter Frame Space (AIFS), CWmin[AC], CWmax[AC] where as DCF in 802.11 uses DIFS, CWmin, CWmax for any station. The AIFSD[AC] is
calculated using the flowing formula,
AIFSD[AC] =SIFS+AIFS[AC]*Slot time.
Fig 3: Working Flow of 802.11e
Additionally, each AC also announces its TXOP limit which is described in table 1. During TXOP, the winning AC can transmit multiple frames, each frame separated by Short Inter Frame Space (SIFS) and Acknowledgement (ACK) frame. If all ACs has the data to transmit, higher priority ACs starts their backoff procedure early, finishes early and gets the channel. If it gets the channel, the low priority AC’s backoff procedures will be interrupted. In the saturated conditions, the backoff procedures of BE and BK are interrupted. Once channel gets congested with high priority traffic, the empty time slots between frames might become low than the value of AIFSD[AC] of BE and BK. At this moment BE, BK are not able to continue their backoff procedure, and as a result the frames of lower priority AC are dropped after they reached retry limit. This is referred to as starvation.
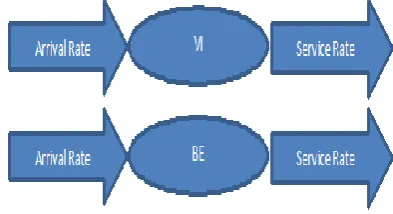
Figure 4: Starvation of BE and BK
The figure 4 shows that the ACs VO and VI has transmitted packets while ACs BE and BK are still in the
state of backoff procedure pause and resume. For every instance, The backoff counter of ACs VO and VI reached zero fast and started their transmission and backoff counter for ACs BE and BK are interrupted as shown in figure 4.
[image:3.595.75.268.620.732.2]Avoidance of Starvation of BE and BK Access Categories in 802.11e
Then there will be only three queues for contention. All three queues contend for channel with base parameter set. When any AC contends for channel, arrival rate and service rates of the queue are evaluated. If the service rate is low or zero it means it is in starvation. The arrival rate and service rates are to be balanced by enhancing the TXOP limit dynamically. The simulations are conducted using ns2.35 with installed EDCA patch. This paper is organized as follows. Section 2 discusses the related works, Section 3 contains queue modelling, Section 4 presents the proposed methodology and and section 5 discusses the simulations and results followed by conclusion and future work.
2. RELATED WORKS
In paper [15], the authors evaluated the performance of IEEE 802.11e EDCA based single-hop ad hoc network under saturated loads considering all differentiation parameters. They investigated the performance under both non-saturated and saturated conditions. The results show that adjusting the TXOP as per the requirement can improve performance in terms of delay, which is an important QoS parameter. AIFS and CWmax are more appropriate for moderate service differentiation, with less starvation of low priority traffic flows.
Moreover, by carefully choosing the value of and, a smooth service gradient from the low to the high priority may be achieved. However the TXOP limit should not be very large since this would cause security threats. Long TXOP periods are also vulnerable to the attacks like denial of service. The results also show that under saturated loads, the TXOP limit has an important role in avoidance of starvation for lower priority traffics. In [16], the authors found that under full loaded traffic conditions, the non-negligible BE and BK should be served with minimum precedence. The EDCA mechanism can’t provide QoS guarantee for BE and BK. They suggested to adapt EDCA values in runtime to obtain better results for BE and BK. In paper [17] the authors applied the block acknowledgement policies with various types of traffic. If the number of stations is low the throughput is low for voice. Whereas, if the number of stations is high, the low throughput is noticed for BE and BK in addition to the video queue. By using Block Acknowledgement (ACK) procedure, the capacity is improved for voice and video in the presence of 15 stations.
Since the the default parameters random in nature of CW, low priority ACs lost their chance to access [18]. The classification which is done in 802.11e and priorities which are given to ACs are perfectly inappropriate even they are universal said by the author because it causes the starvation of low priority flows. This paper proposed a new traffic differentiation scheme which has given priority in unsaturated conditions. Their method has given equal priority but it affects the performance of sensitive applications. To conquer the starvation problem, paper [19]
devised a method which is category of EDCA protocol known as multiple pre-emption EDCA (MP-EDCA) as a candidate to aid a couple of emergency traffics beneath excessive hundreds. This method has given priority to real time and emergency traffics such as medical, life and property. They have also considered a traffic non real time which has been given pre-emption of the services of low precedence ones without affecting higher priority one by assuring QoS guarantee. The paper [20] proposed a queue management (IQAM) algorithm for pretty sharing network resources amongst all contending stations. In the meantime, by means of placing distinctive queue length and drop rate for each AC at each station as per the transmission rate, so that each station ensures equal channel usage time.
The authors in [21] propose two approaches for guaranteeing QoS for all flows. The two approaches are based approach and frame-based approach. The limit-based approach is applied to control data traffic. In fact this approach is consistent in providing better QoS. However, this approach can cause starvation of newly coming data traffic. Frame-based approach attempted to control the EDCA parameter set dynamically. It changes AIFS, CWmin, and CWmax with respect to the behaviour of the frame while transmission. So that when the number of active data stations increases, throughput for voice and video flows is protected by increasing the initial contention window size. The throughput for BE and BK are increased by controlling inter-frame space. The authors in [22] proved that the throughput for voice and video is high when heterogeneous traffic is present in the network. IEEE 802.11e does not serve well for the traffic BE and BK. The channel access parameters impact a lot on the performance of BE and BK. The Authors in [23] proposed an algorithm to avoid the starvation of BE an BK traffics. This paper proposed scheduling algorithm and admission control control algorithm to make BE and BK starvation free. But This paper doesnot guarantee the minimum delay for any flow. This mechansim may incur more delay for the sensitive flows. The Authors in [24] proposed traffic differentiation scheme to avoid the starvation. This traffic differentiation scheme divide the traffic based on density of the traffic. This method addresses the collisions of the traffic. Both saturation and non saturation conditions are simulated.
3. System Model:
Generally Queuing model is used for mathematical analysis of waiting lines, or queues. The behaviour of the queue is depended on the server. These queuing models are used to predict the various queue parameters such as length of the queue, waiting time of the queue element etc., There are various queue models which has different formulas for same parameters. For
which has only one queue and one server has
Arrivals rate λ is a Poisson distribution
Service rate µ is a exponential distribution and this queue model is called as M/M/1 queue.
The mean service time for this model is 1/μ. In this model the server serves the queue elements
probably called as customers one at a time, FCFS discipline.
The size of the queue may be finite or infinite.
Based on the above assumptions the parameters are derived to find the behaviour of the queue with respect to the server performance.
As per the little's law[25], The Performance measures of a M|M|1 Queue model can be written as:
i.Probability of n elements in the system = (1-ƥ)xƥn where ƥ = λ /µ
ii.Average number elements in the system = λ/µ- λ iii.Average number of customers in the queue = λ2/µ
(µ- λ)
iv.Average time an element spends in the system= 1/µ- λ
v. Average time an element spends in the queue = λ/µ (µ- λ) i.e this is also referred to as average waiting time of the queue.
Likewise various queue models are there with distinct performance measures. In this work we have considered a queue model with one server and four queues as it suitable to model the 802.11e protocol as shown in figure 5. In this queue model some of the possible assumptions have been considered. The performance parameter waiting time for the queue is derived for every assumption. There is an obvious conclusion that the waiting time is increases continuously or no change in it then it implies that queue is starved by the server.
Assumption 1: If all the queues has must be served by the server once for every iteration. i.e Q1 be served first then, Q2 followed by Q3 finally Q4.
The waiting time of Q1 W(Q1) is zero because it will starts first. The W(Q2) is equal to service time Q1, S(Q1).
Similarly, W(Q3)= S(Q1)+S(Q2)
W(Q4) = S(Q1)+S(Q2)+S(Q3)
W(Q4) =
W(Q3)+S(Q3))
It can be written as W(Qi)=W(Qi-1)+S(Qi-1). In this assumption no queue can be starved since they are being served after some constant amount of time.
Assumption 2: All queues must be served based on priority which is assigned for all queues at a time. One method is used to give the priority. On successful execution of this method all queues are assigned the priorities. Example, if the method assigned first priority to Q3, second to Q2, Third to Q4 and last to Q1, then the waiting time for queues is as follows.
This is almost similar to first assumption. But slight changes are there.
W(FP Q) = ML where ML is time taken for priority assignment.
W(SP Q) = W(FP Q)+ S(FP Q) W (TP Q) = W(SP Q) + S(SP Q) W(LP Q) = W( TP Q) + S(TP Q).
In this assumption also there are no chances for starvation of any queue.
[image:5.595.107.261.281.484.2]Note: FP Q stands for First Priority Queue, SP Q is for Second Priority Queue and TP Q is for Third Priority Queue. W(x) is stands for Waiting time of x. S(x) is for Service time of x.
Fig 5: Queue Model with four queues and one server
Assumption 3: Highest priority queue will be served after assigning the priorities. After completion of the service, again priorities will be refreshed. Example: In first attempt the Q1 won the first priority, it will be served for its service time. Again priorities will be refreshed. But these priorities are assigned based on some criteria but not randomly.
The performance parameters are derived as follows.
W (FP Q) = ML where ML is the time taken for priority assignment.
Avoidance of Starvation of BE and BK Access Categories in 802.11e
In this moment the waiting time any queue is depended on the method which assigns the priority. So the waiting time of any queue is predicted as the probability of the winning highest priority.
W (Q) 1/α P(Q) where P(Q) is the probability of winning highest priority.
The P(Q) is evaluated based on the method which assigns the priority. In order to evaluate these priorities we can use probability density function for the method. If P(Q) is more then there will be less waiting time for Q, if it is low then waiting time of Q will be increased or unchanged for longer periods. This leads to starvation of the low probability queues.
Note : Q is stands for Queue.
The Queue model and probability of wining the channel of IEEE 802.11 e Protocol
The 802.11e protocol uses four queues and it uses the assumption 3 of the queue model with one server and four queues. Every AC has its own parameter set with three parameters. They AIFS, CW, TXOP. In order to access the channel the parameters AIFS and CW are having key role. Every AC has to sense the channel idle for AIFS time which is depended on physical medium. If it senses the channel idle for AIFS time, then it starts the backoff procedure. For backoff procedure, it selects a random value between CWmin and CWmax as backoff counter. The backoff counter decremented by one every time when sensing idle. The AC for which backoff counter reaches to zero, then AC starts its transmission. It means that it won the channel. This mechanism is formulated as follows.
W(AC) = AIFS + X + Y.
X= ∑xi, , xi is the time slot and i drawn from CWmin to CW max counts towards zero.
Y = TXOP of previously winning queue + AIFS+ X1
X1 = ∑xi where xi is the time slot and i resumes from previously paused value to zero.
So that P(Q) is defined as
P(Q) = ti(1 − ti) n
i−1 ∏ (1 − tj ) nj where j=0 to N-1---eq(1)
also written as ti /(1 − ti)*P(Q idle)
P(Q idle ) = ∏(1 − ti) ni Where i=0 to N-1 also called as probability of queue being idle
where N is Number of ACs , ni Number of stations using ACi, ti Number of time slots in AIFSi.
Eq(1) shows the probability of winning a channel by any AC.
4. Proposed Method to Avoid the Starvation.
[image:6.595.326.523.202.309.2]Four parameters are evaluated at VI queue and BE Queue. They are arrival rate Pa, service rate Ps, and average arrival rate ar and average service rate sr. The figure 6 describes the arrival rates and service rates of Video AC and BE AC. The queue length is also estimated based on the arrival rate and service rate.
Figure 6. Arrival rate and Service rates.
4.1 TXOP At video queue:
1) arrival rate Pa= Number of packets arrived/sec
Pa is Number of packets arrived and it is referred to as packet arrival rate. Ps is Number of packets being served known as service rate.
2) Service rate= number of packets transmitted/TXOP (TXOP for video is 0.6016 micro
seconds)
3) Queue length= Number of packets arrived+ number of packets being served.
If arrival rate is larger than service rate, the size of the queue will increase. If arrival rate is less than service time then the size of the queue will decrease. If any queue length increases gradually means most of the packets are liable to drop. If service rate is near to zero or unchanged for longer periods it is known as starvation.
4) Average arrival rate ar is evaluated by finding the instances for every 20 secs of simulation time. Likewise the
Average Service rate sr is also evaluated Algorithm for setting TXOP for Video Queue. Algorithm 1: Setting TXOP for Video Queue. Input: ar and sr, TXOPVI (Basic TXOP of Video) Data structures: x, y, TXVI.
1. If (ar<sr) 2. {
3. x=sr-ar ( x is excess percentage of service rate); 4. TXVI= TXOPVI-(TXOPVI*x/100);
5. } 6. else 7. {
8. y=ar-sr; ( y is the deficient percentage of service rate)
9. TXVI= TXOPVI+(TXOPVI*y/100); 10. }
From the simulations [26] specifically for Video AC ar is little less than sr.
From the simulation results
ar <sr ( percentages ar is 82% where sr is 100%)
to balance ar and sr, sr can be reduced since it doesnt affect the peroformance. TXOP is affecting the sr. So TXOP is to be reduced to 0.04933 micro seconds.
From the above algorithm TXOP of Video, TXVI= 0.4933 micro secs---eq(2)
4.2 TXOP at BE Queue:
From Number of packets being served in past simulation results we can calculate service rate.
1) Service time= number of packets transmitted/TXOP (TXOP for BE is one MSDU (0.08 micro seconds))
Algorithm for setting TXOP for BE Queue Algorithm 2: Setting TXOP for BE Queue.
Input: ar and sr, TXOPBE (Basic TXOP of Video) Data structures: x, y, TXBE.
Output: TXBE (Revised TXOP for BE).
1. If (ar<sr) 2. {
3. x = sr-ar ( x is excess percentage of service rate); 4. TXBE= TXOPBE-(TXOPBE*x/100);
5. } 6. else 7. {
8. y=ar-sr; ( y is the defficeint percentage of servce rate) 9. TXBE=TXOPBE+ (TXOPBE*y/100);
10. }
BE queue has higher arrival rate than service rate. This leads to starvation of BE queue by the other two. Specifically for BE queue, ar is 252% where sr is 100%. Since ar>sr, service time is to be increased. To balance ar and sr, sr is to be increased. TXOP is affecting the sr. So TXOP is to be increased to 0.210micro seconds.
TXOP for BE=0.210 --- eq(3)
From eq (2) and (3)
TXOP for Video and BE is: TXVI+TXBE --- (4)
(0.4933+0.210= 0.7033).
The arrival rate and service rates for BE traffics are balanced based on the above method. The Arrival rate of BK is assumed as CBR and service rate is depended on TXOP of BK i.e one MSDU.
Algorithm for Channel Access and Transmission
Algorithm 3: Contention for channel and transmission. Queues in Contention: VO, VI and BK.
1) VO, VI and BK are ready to transmit the data. 2) VO, VI and BK has their own basic parameter set
and release their beacon frame with the same parameters.( In the case of VI dont have data but BE has, then also VI treats BE packet is alos belongs to VI and release its beacon frame. This is extremely for non saturation conditions).
3) If the channel is idle, all queues starts their backoff procedure using their CW values.
4) If any queue's backoff counter becomes zero, then it starts its transmission by releasing RTS packet. 5) If VO AC win the channel, its transmission will be
continued for TXOP of VI (table 1) time. After completion of transmission goto step 2. 6) else
7) If VI AC starts its transmission by winning the channel,
then
VI queue transmits its data for TXVI time (eq (2)) and
BE queue transmits it data for TXBE time (eq (3)). This means if Video queue wins the channel it transmission will be continued upto TXVI+TXBE time (eq (4)).
After completion of transmission goto step 2. 8) else
9) If BK queue wins the channel the it transmits 1 MSDU.
After transmission of one MSDU goto step 2.
Avoidance of Starvation of BE and BK Access Categories in 802.11e
Due to the absence of the BE in the contention the probability of winning channel for BK is increased.
4.3 Handling Virtual Collision.
The collisions occured when any two stations starts their transimssion. In saturated networks, the probability is there for collision to be occured due to their data transimssion. Unfortunately if any two packets are colluded during the transmission, IEEE 802.11e protocol handles it as follows. If any two packets are colluded, it will check which packets are colluded and belong to which AC. The higher priority AC packet will be transmitted and other one starts their backoff process.
In this scenario also the packets of BE, BK are not getting the chance and remained in the starvation. To avoid this minimum number of packets over time can be transmitted. We proposed a method to handle such collisions. The proposed method is:
If Collision is happened
1. Since two packets are colluded, figure out which packets caused the collision and their priorities.
2. If any BE and BK packets are involved in collision, then find out last sent packet and sent time of the colluded AC.
3. Find duration = current time-last sent time 4. If (duration>=threshold)
5. {
6. Sent BE or BK packets 7. Drop other packet 8. }
9. else
10. Check priorities of the packets colluded 11. Send higher priority packet into channel.
default: No packet is transmitted. }
In the above algorithm the threshold value is static value. It is tolerable delay for any AC. If any AC is not transmitted beyond threshold then that is under starvation. To avoid starvation we have taken care of last sent time and threshold. The maximum tolerable delay for Voice traffic is 150ms, for video is 400ms [27]. After research on tolerable delay, many researches stated that the upto 150ms delay the voice can be transmitted and upto 400ms delay the video traffic can be transmitted. In fact there is a requirement of tolerable value for BE and BK but there is no standard value. It can be upto several seconds. To make BE and BK starvation free the threshold value is set to 800ms.
5. Simulation:
[image:8.595.319.527.394.555.2]We have conducted the simulations using network simulator tool NS 2.35. 50 nodes are created and placed in random positions. The 50 nodes are created only for simulations purpose. To make network saturated in the given area 50 nodes are enough. Nodes may be varied but the objecive is to make the network saturated. All nodes are roaming using random way point mobility model. Among 50 nodes 10 nodes act as source nodes and 10 are destinations. Each source node generates all four traffics. The data rates and traffic types are shown in Table 2.
Table 2: Traffic and data
Access Category Traffic Data Rates
VO CBR 256 Kbps
VI VBR 512-1024 Kbps
BE FTP 64 Kbps
BK CBR 64 Kbps
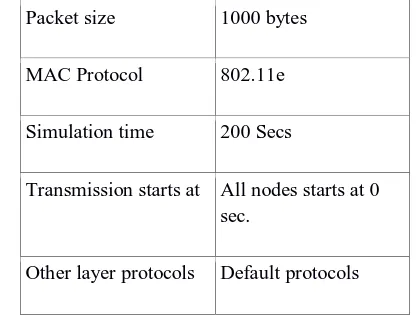
Few more simulation parameters are presented in table 3. Table 3: Simulation parameters
Packet size 1000 bytes
MAC Protocol 802.11e
Simulation time 200 Secs
Transmission starts at All nodes starts at 0 sec.
Other layer protocols Default protocols
The parameters are 1) Throughput 2) Transmission delay 3) Jitter
4) Number of sent packets
The above parameters are defined as
1) Throughput: It is defined as number of bits transmitted over time.
2. Transmission Delay: The time taken to transmit the data over the network.
3. Jitter: The difference of the delays of two consecutive packets.
4. Number of sent packets: The number of packets dequed at any AC and sent into the network.
5.1 Result Analysis:
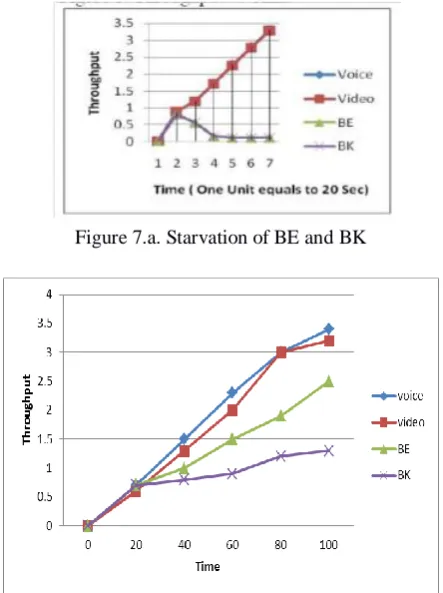
[image:9.595.307.547.92.246.2]The figure 7.a shows that the traffics BE and BK are starved by other two. All queues are contended for channel but most of the times the channel won by VO and VI queues. In starting stages of simulation, some of the packets of BE and BK are transmitted but after a while they didn’t sent its data into the channel.
Figure 7.a. Starvation of BE and BK
Figure 7.b. Throughput of proposed system
The same environment is simulated for proposed method. This method provided chance to BE as same as video queue. If video queue win the TXOP then video and BE queues can transmit their data by sharing TXOP limit. This TXOP limit is tuned dynamically based on the arrival rate and service
[image:9.595.306.548.354.503.2]rate. Figure 7.b shows the avoidance of starvation. The BK queue also got the chance to transmit its data duo to absence of BE in the contention.
Figure 8.a. Delay Vs Time for saturated loads of IEEE 802.11e
Figure 8.a shows that gradual increase in delay for the traffic BE and BK. They have taken very long time to send a packet over the network. This delay is caused due to lower priority when compared to other flows.
Figure 8.b. Delay Vs Time for Saturated loads of proposed system
[image:9.595.58.280.391.688.2]Whereas the figure 8.b shows the avoidance of starvation by noticing lower delays for traffic BE and BK.
[image:9.595.313.544.541.833.2]Avoidance of Starvation of BE and BK Access Categories in 802.11e
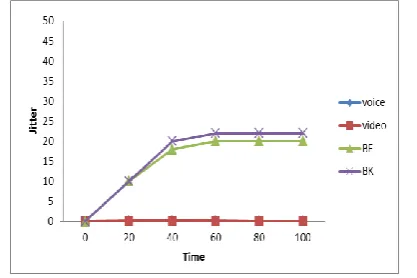
[image:10.595.299.554.49.123.2]In figure 9.a, the performance in terms of jitter is shown. The basic protocol causes more jitter in between the BE and BK packets. It resulted in the starvation of traffic BE and BK. The figure 9.b shows the jitter of proposed protocol. This shows that jitter is smoothly maintained between the packets of BE and BK traffic.
Figure 9.b. Jitter Vs Time for saturated loads of proposed system.
The one more important parameter in this context is number of sent packets. The table 4 shows that number of packets to be transmitted over simulation time and number of packets transmitted in actual. From this table for every time instance, some of the packets are transmitted. This shows that no traffic is starved by voice and video. When compared to [23] and [24] the better throuhgput is noticed under saturation loads by improving the TXOP limit. The delay in proposed method is small when compared to [23] only. The jitter is also very low in the proposed method when compared to [23] and [24]. The proposed method is out perfomed well when compared to other algorithms and prevents the starvation of low priority Acs like BE and BK.
Table 4: Number of sent packets over simulation time Best Effort Services
Simulation time
Number of packets are to be transmitted
Number of packets transmitted
20 13200 8479
40 26400 9574
60 39600 13459
80 52800 24765
100 66000 42056
Background Services
20 13200 5479
40 26400 5746
60 39600 6532
80 52800 7456
100 66000 8675
6. CONCLUSION
BE and BK traffics are involved in crucial and important fields like texting, mailing, browsing etc., Due to prioritized parameters of channel access, BE and BK are facing starvation by voice and video traffic. Since BE and BK have been served with minimum precedence we proposed a method to avoid the starvation. The proposed method evaluates arrival rate and service rate. If arrival rate is less than service rate, TXOP of that AC is reduced to balance arrival rate and service rate. If service rate is less than the arrival rate either packets will be dropped or starved by others. So service rate is increased to meet the arrival rate. By balancing both parameters for every contention instance TXOP is adjusted dynamically. TXOP is evaluated individually for both VI and BE and summed. TXOP can be shared by video and BE AC. In this BE will never participate in contention. If TXOP is won by video it will be shared by BE also. Due to the absence of BE in contention BK can get the chance to transmit the data. The simulations are conducted using ns2.35 with EDCA patch. The results shows that the throughput is increased for BE and BK. The delay and jitters are smoothly maintained for BE and BK. One more crucial parameter is number of sent packets. Required number of sent packets is noticed from every AC. The results stated that the starvation is avoided. By sharing the TXOP with BE, the video performance is affected, but it is negligible. In future work, if any drastic change is noticed in the performance of video then QoS for video should be protected. Furthurly in view of sensitivity of voice and video, QoS should be protected by introducing various methods with starvation avoidance of BE and BK.
REFERENCES:
1. Engelstad, Paal E., and Olav N. Osterbo. "Delay and throughput analysis of IEEE 802.11 e EDCA with starvation prediction." Local Computer Networks, 2005. 30th Anniversary. The IEEE Conference on. IEEE, 2005.
2. Dr.P. Chenna Reddy et al “ A Survey of QOS with IEEE 802.11e “ in International Journal on Computer Science and Engineering in 2011. 3. Zhu, Hua & Chlamtac, Imrich. (2005). Performance analysis for IEEE
802.11E EDCF service differentiation. Wireless Communications, IEEE Transactions on. 4. 1779 - 1788. 10.1109/TWC.2005.847113. 4. Ramakristanaiah, C., P. Chenna Reddy, and R. Praveen Sam.
"Analysis of Starvation Problem in Wireless LANs." In International Journal of Control theory and applications in 2016.
5. ANSI/IEEE.802.11:Wireless LAN Medium Access Control (MAC) and Physical Layer (PHY) Specifications IEEE, 1999.
[image:10.595.66.275.143.282.2]7. Chen, Xiaomin, and Shuang-Hua Yang. "Achieving proportional fairness with a control theoretic approach in error-prone 802.11 e wlans." arXiv preprint arXiv:1507.08922(2015).
8. Katarzyna et al “What’s New for QoS in IEEE 802.11?” proceedings of IEEE Network November/December 2013with 0890-8044/13. 9. Source: Google statistics
10. Coronado, Estefanía, José Villalón, and Antonio Garrido. "Dynamic AIFSN tuning for improving the QoS over IEEE 802.11 WLANs." Wireless Communications and Mobile Computing Conference (IWCMC), 2015 International. IEEE, 2015.
11. Coronado, Estefanía, José Villalón, and Antonio Garrido. "Ensuring QoS for IEEE 802.11 Real-Time Communications Using an AIFSN Prediction Scheme." Security, Privacy and Reliability in Computer Communications and Networks (2016): 365.
12. Ke, Chih-Heng, et al. "Frame-based mapping mechanism for energy-efficient MPEG-4 video transmission over IEEE 802.11 e networks with better quality of delivery." Journal of Network and Computer Applications 58 (2015): 280-286.
13. Engelstad, et al (2005). Delay and throughput analysis of IEEE
802.11e EDCA with starvation prediction. 647- 655.
10.1109/LCN.2005.47.
14. Al-Nuaimi, Aws Ali Shakir. Efficient Back-off Mechanism for Multimedia Support in IEEE 802.11 E. Diss. Universiti Putra Malaysia, 2012.
15. Rashwand, Saeed, and Jelena Misic. "IEEE 802.11 e EDCA under bursty traffic—How much TXOP can improve performance." IEEE Transactions on Vehicular Technology 60.3 (2011): 1099-1115. 16. Sehrawat, Saurabh, Revoti Prasad Bora, and Dheeraj Harihar.
"Performance Analysis of QoS supported by Enhanced Distributed Channel Access(EDCA) mechanism in IEEE 802. 11 e." IAENG International Journal of Computer Science 33.1 (2007): 30-35. 17. Cabral, Orlando, Alberto Segarra, and Fernando J. Velez.
"Implementation of IEEE 802.11 e Block Acknowledgement Policies." Proceedings of the World Congress on Engineering. Vol. 1. 2008.
18. Zhang, Bei-bei, et al. "A traffic priority based EDCA scheme in wireless networks." Wireless Communication and Sensor Network: Proceedings of the International Conference on Wireless Communication and Sensor Network (WCSN 2015). 2016.
19. Memon, Shuaib K., Nurul I. Sarkar, and Adnan Al-Anbuky. "Multiple preemptive EDCA for emergency medium access control in distributed WLANs." Wireless Networks 23.5 (2017): 1523-1534. 20. Lei, Jianjun, Yingwei Wu, and Xu Zhang. "An improved active queue
management algorithm for time fairness in multirate 802.11 WLAN." Computer Science On-line Conference. Springer, Cham, 2017.
21. Xiao, Yang, Frank Haizhon Li, and Sunghyun Choi. "Two-level protection and guarantee for multimedia traffic in IEEE 802.11 e distributed WLANs." Wireless Networks 15.2 (2009): 141-161. 22. Pan, Shih-Wei, and Jung-Shyr Wu. "Throughput analysis of IEEE
802.11 e EDCA under heterogeneous traffic." Computer Communications 32.5 (2009): 935-942.
23. Riza, Ahmed, et al. "Improving QoS in WLAN using dynamic weighted fair scheduling." Malaysian Journal of Computer Science 23.2 (2017): 85-101.
24. Sanabria-Russo, Luis, and Boris Bellalta. "Traffic differentiation in
dense collision-free WLANs using CSMA/ECA." Ad Hoc
Networks 75 (2018): 33-51.
25. Little's Law John D.C. Little and Stephen C. Graves Massachusetts Institute of Technology
26. Ramakristanaiah, C., P. Chenna Reddy, and R. Praveen Sam. "Evaluation of starvation problem under saturated loads in IEEE 802.11 e." Emerging Technological Trends (ICETT), International Conference on. IEEE, 2016.
27. IEEE Standard” Information technology - Telecommunications and information exchange between systems - Local and metropolitan area networks - Specific requirements - Part 11: Wireless LAN Medium Access Control (MAC) and Physical La yer (PHY) specifications - Amendment 5: Enhancements for higher throughput", IEEE Standard 802.11n, Oct 2009.