Abstract: In this paper, the design fabrication and development of a low-cost turbidimeter with a smartphone camera and image processing are demonstrated. The turbidimeter serves as a simple and low cost alternative to professional standard turbidimeters as well as other proposed turbidimeters presented in other studies. This turbidimeter is made from affordable and widely available materials and electronic components. The proposed turbidimeter was tested and able to determine the turbidity of Formazine samples between 0 and 100 NTU with the coefficient of determination R2= 0.982. The overall cost of this turbidimeter is only USD4.35, which is well below the cost of other proposed turbidimeters.
Index Terms: turbidity, water quality, smartphone, greyscale, image processing.
I.INTRODUCTION
It is well known that the price of professional commercial turbidimeter can reach up to thousands of dollars. [1]The prohibitive cost of scientific instruments significantly hinders the effectiveness of environmental monitoring and protection especially in developing countries and rural areas. [2,3] As alternatives to expensive instruments, affordable smartphone-assisted sensing platforms are now made possible with recent development in computing technology, particularly in optical hardware.[4,5] Furthermore, smartphones are made to be increasingly more affordable for the emerging markets through various incentives offered by the mobile operators. [6] Therefore, it is not surprising that the development of affordable smartphone-assisted sensors and sensing systems are gaining much interest in recent years as extensively reviewed in past literatures. [3,5,7-12]
An excellent example of such a system can be found in Hussain et al.
Revised Manuscript Received on May 22, 2019.
Siti Nor Asyiqin Ramli, Department of Environmental Sciences, Faculty
of Environmental Studies, Universiti Putra Malaysia, 43400 Serdang, Selangor, Malaysia.
Khairunnisa Kadaruddin, Department of Environmental Sciences,
Faculty of Environmental Studies, Universiti Putra Malaysia, 43400 Serdang, Selangor, Malaysia
Mohamad Faiz Zainuddin, Department of Environmental Sciences,
Faculty of Environmental Studies, Universiti Putra Malaysia, 43400 Serdang, Selangor, Malaysia
Zulkifly Abbas, Department of Physics, Faculty of Science, Universiti
Putra Malaysia, 43400 Serdang, Selangor, Malaysia
which proposed a simple, portable and affordable smartphone-assisted turbidimeter with infrared (IR) LED to illuminate water sample, IR sensor for scattered light detection and nylon block to house the electronics and water sample. Three mathematical relationships (models) between light intensity measured from the proximity sensor and water turbidity in terms of nephelometric turbidity unit (NTU) were developed from the study for the measurement of turbidity value up to 440 NTU. High accuracy was achieved for the proposed turbidimeter in terms of correlation coefficient R2> 0.99 for all three models. The proposed system is also able to accurately determine the turbidity of coloured or dyed water and natural water samples. [13]
Both digital camera and image processing were considered for detection of water turbidity in the past. For instance, Karnawat and Patil employed a high-resolution digital camera to directly capture images of water samples and image processing to convert the coloured images to grey images. These grey images; “0” indicates total “blackness”, and “1” indicates total “whiteness”. However, Karnawat and Patil do not present a mathematical model to describe the relationship between the binary image quality and the actual water turbidity. [14] A similar method was employed by Hamidi et al.
to determine the turbidity of prepared water samples with the standard Formazine buffer.[15] As opposed to Karnawat and Patil[14], Hamidi et al. presented a mathematical model to describe the relationship between grey image quality and the actual water turbidity. However, the accuracy of the model (R2 = 0.9695) obtained in their study is slightly lower than the impressive accuracy of R2> 0.99 achieved in Hussain et al., Kelley et al.,[16] Lambrou et al., [17] Sampredo and Salgueiro, [18]
and Metzger et al.,[1]
This study aims to design a low-cost turbidimeter by utilising a smartphone camera as the light detector and image processor to analyse water samples. The quality of captured digital grey images is dependent on the intensity of scattered light incident on the smartphone camera. In theory, highly turbid water scatters more light than low turbid water.
The Development of Low Cost Turbidimeter using
Smartphone Camera and Image Processing
Hence, it would appear brighter on digital camera, the charge-coupled device (CCD) or complementary metal-oxide semiconductor (CMOS) sensor converts light into 24-bit (8 bit Red + 8 bit Green + 8 bit Blue) colour information which is detailed in Firdaus et al.[19]This study follows similar method presented in Hamidi et al. but with different camera and cabin setup. The accuracy of this proposed is also covered in this contribution.
II.MATERIALS AND METHODS
Design and fabrication of the turbidimeter cabin
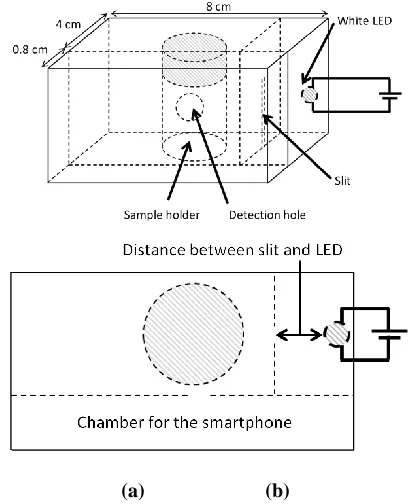
Figure 1 and 2 show the schematic diagrams of the turbidimeter cabin housing a white LED manufactured by Everlight,[20] a standard 23-mm diameter cylindrical AQ4500 glass cuvette and a chamber to hold an Android smartphone during image capturing.
[image:2.612.70.275.265.517.2](a) (b)
[image:2.612.316.560.544.601.2]Fig. 1 A schematic diagram of the turbidity cabin (not drawn to scale); (a) perspective view; (b) top view
Fig. 2 The top view of the turbidimeter cabin
White LED is considered to cover the whole range of visible
light, while small particles tend to effectively scatter shorter wavelengths in the visible spectrum.[21, 22, 23] Besides, a white source of light is one of the major requirements for U.S. EPA 1801 reporting. [24] However, the white LED used in this study is the standard yttrium aluminum garnet (YAG)-phosphor coated on blue Indium-gallium-nitride (InGaN) chip, which is known as red emission-deficient.[25, 26] Despite this shortcoming, white LED can be found in the EPA-approved Orion AQ4500 turbidimeter. Besides, LED is considered inexpensive, has a long lifetime and easy to be configured, [27] making it an attractive option for the development of a low-cost turbidimeter. The white LED is powered by two 1.5 V AA batteries which deliver 3V voltage and 4 mA of current to the LED.
The whole cabin was constructed from corrugated paper for ease of customisation and to keep the cost low. The length of the cabin is set at 8 cm to accommodate the length of the smartphone used in this study, namely Samsung Galaxy J7 that runs the Android 6.0.1 operating system (OS). The sensitivity of the camera is set to AUTO as recommended in Ramli.[28]The relevant information on the smartphone rear camera is given in Table 1. The width of the cabin is set to 4.8 cm to accommodate the cabin then coated with black paint to ensure that the cabin would be opaque to external light. A 10-mm radius pinhole is installed to allow only ~90° scattered light incident on the camera and minimise stray light from reaching the camera [29,13]and minimise the effect of particle size. [30, 22]In addition to the pinhole, a 1-mm slit is installed to considerably narrow the light emitted from the LED towards the sample only and to block the light from reaching the smartphone camera directly. Even though this slit is not as effective as a collimator lens in directing narrow beam of light, this consideration was made to minimise the cost. The spacing between the slit and the LED was set at 2 cm based on the findings reported in Ramli. [28]The lid of the setup can be lifted to allow cuvette to be placed inside the cabin and cover the whole setup during measurement. The battery holder is placed outside the cabin and attached to the wall of the cabin.
Table. 1 Specifications of Samsung Galaxy J7 Prime rear camera
Sensitivity (ISO) Auto and Manual (100, 200, 400, 800)
Aperture size f/1.9 (28mm)
Resolution 13MP
Turbid water sample preparation
[image:2.612.48.302.552.697.2]A 10.0 mL micro-pipet was used to transfer the desired amount of the working suspension to a 100 mL volumetric flask. Then, the working suspension was mixed with distilled water, and the solution was mixed thoroughly. The same steps were repeated to prepare 33 different concentrations of Formazine. The required amount of the working suspension needed was determined using the below formula:[23]
𝐕𝐨𝐥𝐮𝐦𝐞 𝐨𝐟 𝐝𝐢𝐥𝐮𝐭𝐢𝐨𝐧
𝐭𝐨 𝐛𝐞 𝐩𝐫𝐞𝐩𝐚𝐫𝐞𝐝 × 𝐃𝐞𝐬𝐢𝐫𝐞𝐝 𝐍𝐓𝐔 𝐯𝐚𝐥𝐮𝐞
𝐍𝐓𝐔 𝐨𝐟 𝐭𝐡𝐞 𝐰𝐨𝐫𝐤𝐢𝐧𝐠 𝐬𝐮𝐬𝐩𝐞𝐧𝐬𝐢𝐨𝐧
=
𝐑𝐞𝐪𝐮𝐢𝐫𝐞𝐝 𝐯𝐨𝐥𝐮𝐦𝐞 𝐨𝐟 𝐰𝐨𝐫𝐤𝐢𝐧𝐠 𝐬𝐮𝐬𝐩𝐞𝐧𝐬𝐢𝐨𝐧
(𝐦𝐋)
(1 )
III. DATA COLLECTION AND ANALYSIS
Both the true turbidity and digital images of the Formazine samples were obtained immediately after preparation, as Formazine samples are stable only for a short period of time. [23]
The true turbidity of the samples was measured with Hach 2100P turbidimeter in terms of NTU. All digital images were saved in the standard JPEG format at the lowest resolution available on the smartphone (4.7 MP) to speed up image processing, and they were set at 1:1 (2160 x 2160) aspect ratio. After the RGB digital images were captured, they were then converted to grey images by using this equation[31]:
𝑮𝑹𝑬𝒀 = 𝟎. 𝟐𝟗𝟗 ∗ 𝑹 + 𝟎. 𝟓𝟖𝟕 ∗ 𝑮 + 𝟎. 𝟏𝟏𝟒 ∗ 𝑩 (2)
The quality of the grey images were examined in terms of greyscale intensity ranging from “0,” which indicates “blackness”, to “255,” which indicates “whiteness”. [19,27] Therefore, theoretically, low turbid samples would yield “dark” images with pixel range in the low intensity regions since the black walls of the cabin serve as the background of the sample. In order to calibrate the image quality with true turbidity values, the mean greyscale intensity (MGI) is obtained from the images according to the below equation: [15]
𝒎𝒆𝒂𝒏 𝒈𝒓𝒆𝒚𝒔𝒄𝒂𝒍𝒆 𝒊𝒏𝒕𝒆𝒏𝒔𝒊𝒕𝒚 (𝑴𝑮𝑰)
=𝟏
𝑵
∙𝟏
𝑴 𝒓𝒈𝒃𝟐𝒈𝒓𝒂𝒚(𝒊𝒎𝒂𝒈𝒆)
𝑴
𝒎=𝟏 𝑵
𝒏=𝟏
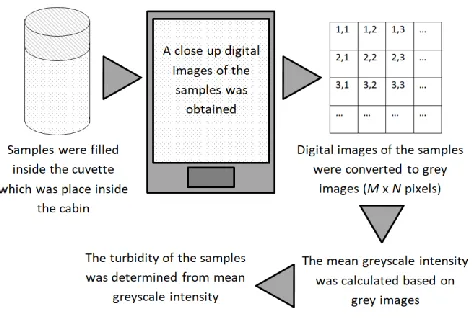
[image:3.612.320.556.63.222.2](3)
Fig. 3 The process involved in the turbidity measurement of the system
TheM and N are the number of rows and columns, respectively. Calibration between MGI and true turbidity values of the Formazine samples is necessary to determine the accuracy of this system to measure the turbidity of the samples in term of correlation coefficient, R2, which was also considered in Hussain et al. and Hamidi et al. Figure 3 summarises the process of obtaining sample turbidity based on digital images of the samples.
The cost of the system
The cost of the whole system is MYR18.40 (or equivalent to USD4.35), which include two 1.5V AA batteries (MYR7.00/USD1.75), a battery holder (MYR1.20/USD0.30), one white LED (MYR1.20/USD0.30) and a standard black aerosol spray paint (MYR8.00/USD2.00) which was used sparingly to coat the cabin wall with black paint. The corrugated paper was obtained at no cost from used cardboard box. The cost of the system excludes the cost of the Orion AQ4500 cuvette and the smartphone as it was obtained for personal use. For comparison, the cost of this system is much lower than the cost of the system proposed by Lambrou et al. (MYR30.00/USD35.00), Hussain et al. (USD86.00), Kelley et al. (USD35.00) and Metzger et al. (EUR50/USB58.22). Understandably, this is due to the fact that this system was constructed from used cardboard material and featured very few electronic components.
IV. RESULTS
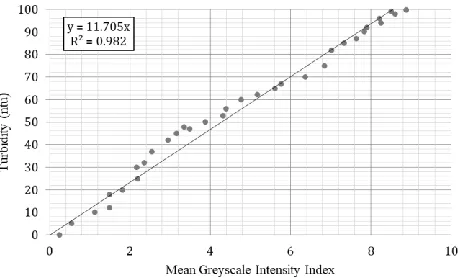
𝑻𝒖𝒓𝒃𝒊𝒅𝒊𝒕𝒚 𝑵𝑻𝑼 = 𝟏𝟏. 𝟕𝟎𝟓 ∗ 𝑴𝑮𝑰 (4)
withR2= 0.982. Notice that the range of turbidity considered here is only between 0 and 100 NTU, which is acceptable for assessing the turbidity of drinking water (1-5 NTU safe limit) [29]
and natural water (25 NTU safe limit). [32] V.DISCUSSION
As shown in Figure 4, the accuracy of the linear calibration model is revealed to be R2 = 0.982, which is significantly higher than that of Hamidi et al. (R2 = 0.9605), but slightly lower than what is achieved in Hussain et al., Lambrou et al.,
[image:4.612.64.293.280.419.2]Kelley et al., Sampredo and Salgueiro, and Metzger et al. (R2> 0.99)as mentioned earlier. However, it must be noted that these authors rely on highly sensitive photodiodes as opposed to smartphone digital camera for scattered light detection These photodiodes are generally inexpensive. However, when taking into consideration of other electronic components and
[image:4.612.40.306.480.656.2]Fig. 4 The relationship between measured turbidity and mean greyscale intensity
Table. 2 Comparison between selected turbidimeters
Cost
(USD) Accuracy (R
2
) Range
(NTU)
This study 4.35 0.982 0 - 100
Hamidi et al. 4.00 0.961 0 - 100
Hussain et
al. 86.00
0.991 0.997 0.997
0 - 1 1 – 10 40 - 400
Kelley et al. 35.00
0.998 ~1 ~1 0.999
0 – 0.4 1 – 30 30 – 300 300 - 1100 Metzger et
al. 58.22
[33]
0.997 0 - 1000
hardware to operate with photodiodes such as the usage of amplifier, digital display, microcontrollers as well as plastic or metal cabin housing the electronics, the cost of fabricating such turbidimeter is higher than the cost of turbidimeters proposed in this study. Considering the cost of turbidimeters
other proposed turbidimeters with higher cost of production. Table 2 summarises the cost, accuracy and range of selected turbidimeters reported in other studies.
VI. CONCLUSION
This study successfully demonstrates the fabrication and development of a low-cost turbidimeter with smartphone camera and image processing. This turbidimeter is able to determine the turbidity of prepared Formazine samples with the accuracy that is fairly comparable to more expensive turbidimeters proposed in other studies. Despite its limited range, this study shows that it is possible to develop a fairly accurate turbidimeter by relying on a smartphone camera as opposed to photodiode for scattered light detection, and image processing for data analysis and calibration purpose. Based on the aspects of the cost of making the turbidimeter and the accuracy (R2), this study is considered a good base medium for a further research on inexpensive scientific instruments including turbidimeter with acceptable accuracy. For future works, other types of digital camera such as endoscope or hidden camera will be considered to assess the suitability of these cameras as light sensing instruments for turbidity measurement.
VII.ACKNOWLEDGMENT
Authors would like to thank Miss Siti Norlela Talib for her supports and guidance during the completion of this study. REFERENCES
1. M. Metzger, A. Konrad, F. Blendinger, A. Modler, A. J. Meixner, V. Bucher and M. Brecht, “Low cost GRIN-Lens-Based nephelometric turbidity sensing in the range of 0.1 – 1000 NTU” Sensors2018, 18, 1115. 2. L. Zou, Z. Gu and M. Sun, “Review of the application of quantum dots in the heavy-metal detection” Toxicology & Environmental Chemistry, vol. 97, 2015, pp. 477-490.
3. K. E. McCracken and J-Y. Yoon, “Recent approaches for optical smartphone sensing in resource – limited settings: a brief review”, Analytical Methods, vol. 8, 2016, pp. 6591–6601.
4. F. Sagasti, “Knowledge and innovation for development: the Sisyphus challenge of the 21st century, Edward Elgar Publishing, UK, 2004, p. 35. 5. A.Roda, E. Michelini, M. Zangheri, M. Di Fusco, D. Calabria and P.
Simoni, “Smartphone-based biosensors: a critical review and perspectives”, Trends in Analytical Chemistry 79, 2016, pp. 317-325. 6. M. Karlsson, G. Penteriani, H. Croxson, A. Stanek, R. Miller, D. Pema
and F. Chitiyo, “Accelerating affordable smartphone ownership in emerging markets”, GSMA, 2017.
7. N. D. Lane, E. Miluzzo, H. Lu, D. Peebles, T. Choudhury and A. T. Campbell, “A survey of mobile phone sensing”, IEEE Communications Magazine,Sept 2010, pp. 140–150,
8. X. Liu, T-Y. Lin and P. B. Lillehoj, “Smartphones for cell and biomolecular detection”, Annals of Biomedical Engineering, vol. 42, No. 11, 2014, pp. 2205–2217.
10. S. K. Vashist, P. B. Luppa, L. Y. Yeo, A. Ozcan, and J. H. T. Luong, “Emerging technologies for next-generation point-of-care testing”, Trends in Biotechnology, vol. 33, no. 11, Nov 2015, pp. 692-704.
11. D. Zhang and Q. Liu, “Biosensors and bioelectronics on smartphone for portable biochemical detection”, Biosensors and Bioelectronics 75, 2016, pp. 273-284.
12. Z. Geng, X. Zhang, Z. Fan, X. Lv, Y. Su, and H. Chen, “Recent progress in optical biosensors based on smartphone platforms”, Sensors2017,17, 2449.
13. Hussain, K. Ahamad and P. Nath, “Water turbidity sensing using a smartphone”, RSC Adv., 6, 2016, pp. 22374-22382.
14. V. Karnawat and S. L. Patil, “Turbidity detection using image processing”, International Conference on Computing, Communication and Automation (ICCCA), 2016, pp. 1086-1089.
15. F. J. Hamidi, M. F. Zainuddin, Z. Abbas and A. F. Ahmad, “Low cost and simple procedure to determine water turbidity with image processing”, in Proc. of the International Conference on Imaging, Signal Processing and Communication (ICISPC), 2017, pp. 30-34.
16. C. D. Kelley, A. Krolick, L. Brunner, A. Burklund, D. Kahn, W. P. Ball and M. Weber-Shirk, “An affordable open-source turbidimeter”, Sensors
2014, 14, pp. 7142-7155.
17. T. P. Lambrou, C. C. Anastasiou and C. G. Panayiotou, “A nephelometric turbidity system for monitoring residential drinking water quality”, International Conference on Sensor Applications, Experimentation and Logistic, 2009, pp. 43-55.
18. Ó. Sampedro and J. R. Salgueiro, “Turbidimeter and RGB sensor for remote measurements in an aquatic medium”, Measurement68, 2015, pp. 128-134.
19. M. L. Firdaus, W. Alwi, F. Trinoveldi, I. Rahayu, L. Rahmidar and K. Warsito, “Determination of chromium and iron using digital image-based colorimetry”, Proceedia Environmental Sciences, vol. 20, 2014, pp. 298-304.
20. A.Ma, Everlight 5mm Round White Light Technical Data Sheet, Everlight Electronics Co., Ltd., 2007.
21. J. Cox, A. J. DeWeerd and J. Linden, “An experiment to measure Mie and Rayleigh total scattering cross sections”, Am. J. Phys. vol. 70, no. 6, June 2002.
22. D. C. Giancoli, “Physics: Principles with Applications”, Pearson Education, England, 2016, p. 704.
23. M. Sadar, “Turbidity Standards”, Hach Technical Information Series, Booklet No.12, USA.
24. W. Anderson, “Turbidity 6.7”, ver. 2.0, USGS TWRI Book 9-A6, 2004. 25. H. J.Yu and W. Chung and S. H. Kim, “White Light Emission from blue
InGAN LED with hybrid phosphor (published Conference Proceedings style)”, in 10th IEEE International Conference on Nanotechnology Joint
Symposium with Nano Korea, 2010, pp. 958-961.
26. Min, D. Park, J. Jang, K. Lee and O. Nam, “Phosphor-free white-light emitters using in-situ GaN nanostructures grown by metal organic chemical vapor deposition”, Scientific Reports, 5, 2015.
27. A.F. Omar and M. Z. MatJafri, “Turbidimeter design and analysis: a review on optical sensors for the measurement of water turbidity”, Sensors 2009, 9, pp. 9311-8335.
28. S. N. A. Ramli, “Development of low cost and portable turbidity measurement system using camera phone (Thesis style) ”, B. Sc. thesis, Dept. Env. Sci. Tech., Universiti Putra Malaysia, Malaysia, 2017. 29. EPA, “Water: monitoring & assessment – turbidity”, United States
Environmental Protection.
30. M. Sadar, “Turbidity Science”,Hach Technical Information Series, Booklet No.11, USA, 1998.
31. MATLAB, “rgb2gray (Online article)”, MathWorks Inc., USA.
32. S. Lloyd, “Turbidity as a water quality standard for Salmonid habitats in Alaska”, North American Journal of Fisheries Management, 1987, pp. 34-45.
33. M. Brecht, Institute of Physical and Theoretical Chemistry, Germany, email communication, June 2018.