International Journal of Innovative Technology and Exploring Engineering (IJITEE) ISSN: 2278-3075, Volume-8 Issue-8, June, 2019
2512
Published By:
Blue Eyes Intelligence Engineering & Sciences Publication
Retrieval Number: H6899068819/19©BEIESP
Abstract: Saw Dust Ash (SDA) despite being an industrial waste, has played a vital role in concrete mix research. It has served as an alternative or complementary material to some of the traditional materials of concrete. In this study, it served as a fifth ingredient of concrete blend as it replaced 5% of the fine aggregate (sand). The other four ingredients were cement, sand, granite, and water. Scheffe’s simplex theory was used for five mix ratios in a {5,2} experimental design which resulted in additional ten mix ratios. For purposes of verification and testing, additional fifteen mix ratios were generated. The thirty concrete mix ratios were subjected to laboratory experiments to determine the 28 days compressive strengths. The results of the first fifteen compressive strengths were used for the calibration of the model constant coefficients, while those from the second fifteen were used for the model verification using Scheffe’s simplex lattice design. A mathematical regression model was derived from the experimental results, with which the compressive strengths were predicted. The derived model was subjected to a two-tailed t-test with 5% significance, which ascertained the model to be adequate with an R2 value of 0.8336. The study revealed that SDA can replace 5% of fine aggregate and promote sustainability, without compromising the 28 days compressive strength.
Index Terms: Compressive strength of Concrete, Saw Dust Ash, Scheffe’s simplex lattice.
I. INTRODUCTION
The use of industrial waste materials in concrete research has come to stay. Some of such materials range from fly ash, saw dust ash (SDA), rice husk ash, quarry dust, and palm kernel shell ash. They have been used in one form or another, to replace fractions of either cement or fine aggregates, while others have been used to stabilise sub-base materials for pavement construction.
Saw dust is an industrial waste or bye-product of saw mills produced after the wood has been sawn to shape in the saw mill, and comes out in powder form. It has been used in concrete construction for over 30 years [1]. When saw dust is subjected to fire, it burns to ashes. That ash is called Saw Dust Ash (SDA).
Revised Manuscript Received on June 14, 2019
Oba, K. M., Department of Civil Engineering, Rivers State University, Port Harcourt, Nigeria.
Ugwu, O. O., Department of Civil Engineering, Alex Ekwueme Federal University, Abakaliki, Nigeria.
Okafor, F. O., Department of Civil Engineering, University of Nigeria, Nsukka, Nigeria.
In this study, SDA was used to partially replace 5% of the fine aggregate. A mathematical model was derived using Scheffe’s simplex theory, with which the compressive strengths were predicted. There were five components in the mix (water-cement ratio, cement, sand, SDA, and granite).
II. LITERATURE REVIEW
According to [2], concrete plays the biggest material role in the construction industry. Several authors have studied and determined various means of actualizing sustainability in the construction industry with respect to concrete. [3] demonstrated in his experimental research that SDA can drastically improve the properties of lateritic soils when used as a stabiliser. His experiment shows that the optimum moisture content, maximum dry density, unconfined compressive strength, and shear strength of the lateritic soil were improved when stabilised with SDA. A similar study carried out by [4] also shows that using saw dust to stabilise lateritic soils could improve the CBR and other properties of the soil, as well as reduce the construction cost. [5] have described the production of cement as a major source of environmental degradation as about 400kg of CO2 is being emitted for every 600kg of cement produced. They therefore replaced 10% of cement with SDA which did not negatively affect the chloride permeability and thaw resistance of the concrete, but decreased the drying shrinkage, and increased the water absorption. This also established the pozzolanic ability of SDA. Similarly, [6] found in their research that replacing 5 to 15% cement content with saw dust increased the compressive, flexural, and split tensile strengths of the concrete for 28days curing period and beyond. It also decreased the weight and cost. However, fewer researchers such as, [7] have carried out research work on replacement of fine aggregates with SDA. Their research findings revealed that 10% replacement of fine aggregate with SDA will result in an acceptable tensile, flexural, and compressive strengths as well as reduce the amount of wastes in the environment. SDA has different particles that are mostly angular in shape. According to [7] SDA has a specific gravity of 2.5, fineness modulus of 1.78, water absorption of 0.56%, and bulk dry density of 1300kg/m3 as against sand with specific gravity of 2.65, fineness modulus of 2.21, water absorption of 0.45%, and bulk dry density of 1512 kg/m3. When 10% of SDA is added to the sand, these properties became 2.67, 2.2, 0.5%, and 1436kg/m3 for specific
gravity, fineness modulus, water absorption, and bulk dry density respectively.
Development of Scheffe’s Model to Predict the
Compressive Strength of Concrete using SDA as
Partial Replacement for Fine Aggregate
Published By:
This is a significant indication that the mixture of sand and 10% SDA replacement gave similar physical properties with the 0% SDA replacement, making the mixture adequate for a fine aggregate. However, [8] SDA had a specific gravity of 2.19, bulk dry density of 1040kg/m3, and moisture content of 0.3%. This gives a bigger difference in the specific gravity of SDA as compared to that of sand. Furthermore, [9] shows that 50% of the SDA grain size is passing the AASHTO sieve no. 200 (75µm) while 31% is retained by sieve no. 325 (45 µm). This according to [9] justifies the fineness of SDA.
SDA, like many other concrete construction materials, contains several chemical compounds. According to [7] SDA has the following chemical composition by mass: 65.3% SiO2, 4% Al2O3, 2.23% Fe2O3, 9.6% CaO, 5.8% MgO, 0.01% MnO, 0.07% Na2O, 0.11% K2O, 0.43% P2O5, and 0.45% SO2. Summing up SiO2, Al2O3, and Fe2O3 gives 71.53%. Similar works carried out by [10] reveals 67.95% SiO2, 4.29% Al2O3, 2.15% Fe2O3, 9.47% CaO, 5.84% MgO, 0.01% MnO, 0.06% Na2O, 0.11% K2O, and 0.56% SO3. Summing up SiO2, Al2O3, and Fe2O3 gives 74.39. These, in accordance with [11] indicate that SDA is a good pozzolanic material. The chemical compositions as found by [7], [10], [12] all show that SDA has a high percentage of SiO2 and small percentages of Al2O3 and Fe2O3, which are similar to those of sand with high percentage of about 95% SiO2. Hence SDA can be used with sand as fine aggregate.
A. Scheffe’s Simplex Theory
Several authors such as [13]–[19] have carried out Portland cement concrete mixture research while [20] has carried out Asphalt concrete research with the development of mathematical models. Most of such works were based on Scheffe’s Simplex theory.
Scheffe’s model is based on the simplex lattice and simplex theory or approach [21]. The simplex approach considers a number of components, q, and a degree of polynomial, m. The sum of all the ith components is not greater than 1. Hence,
(1)
(2)
with 0 ≤ x ≤ 1. The factor space becomes Sq-1. According to [21] the {q,m} simplex lattice design is a symmetrical arrangement of points within the experimental region in a suitable polynomial equation representing the response surface in the simplex region.
The number of points has (m+1) equally spaced
values of xi = 0, , , …. . For a 3-component mixture with degree of polynomial 2, the corresponding
number of points will be which gives 6 (eq. 3 or eq. 4 below) with number of spaced values, 2+1 = 3, that is xi = 0,
, and 1 as design points of (1,0,0), (0,1,0), (0,0,1), (1/2,1/2,0), (1/2,01/2), and (0,1/2,1/2). Similarly, for a {5,2}
simplex, there will be 15 points with xi = 0, , and 1 as spaced values. The 15 design points are (1,0,0,0,0), (0,1,0,0,0), (0,0,1,0,0), (0,0,0,1,0), (0,0,0,0,1),
(1/2,1/2,0,0,0), (1/2,0,1/2,0,0), (1/2,0,0,1/2,0), (1/2,0,0,0,1/2), (0,1/2,1/2,0,0), (0,0,1/2,1/2,0), (0,0,0,1/2,1/2), (0,1/2,0,1/2,0), (0,0,1/2,0,1/2), (0,1/2,0,0,1/2).
(3) or
(4)
For a polynomial of degree m with q component variables where eq. (2) holds, the general form is:
(5) Where 1 ≤ i ≤ q, 1 ≤ i ≤ j ≤ q, 1 ≤ i ≤ j ≤ k ≤ q, and b0 is the constant coefficient.
x is the pseudo component for constituents i, j, and k. When {q,m} = {5,2}, eq. (5) becomes:
(6) and eq. (2) becomes
(7)
Multiplying eq. (7) by b0 gives
(8)
Multiplying eq. (7) successively by x1, x2, x3, x4, and x5 and making x1, x2, x3, x4, and x5 the subjects of the respective formulas:
(9)
International Journal of Innovative Technology and Exploring Engineering (IJITEE) ISSN: 2278-3075, Volume-8 Issue-8, June, 2019
2514
Published By:
Blue Eyes Intelligence Engineering & Sciences Publication
Retrieval Number: H6899068819/19©BEIESP
(10) Let
(11)
Substituting eq. (11) into eq. (10) gives
(12)
(13) Where the response, Y is a dependent variable (compressive strength of concrete). Eq. (12) is the general equation for a {5,2} polynomial, and it has 15 terms, which conforms to Scheffe’s theory in eq. (3).
Let Yi denote response to pure components, and Yij denote response to mixture components in i and j. If xi =1 and xj = 0, sice j ≠ i, then
(14)
Which means
(15)
Hence, from eq. (14)
(16)
According to [21],
(17)
Substituting eq. (14)
(18)
III. MATERIALS AND METHODS
Water, cement, sand, SDA, and granite were the materials used to produce the concrete.
The first five concrete mix ratios derived from different mix design methods given as
BRE 12 = [0.54 1 1.9475 0.1025 2.95]; BRE 22 = [0.58 1 2.1185 0.1115 3.21]; USBR 22 = [0.58 1 2.2515 0.1185 3.29]; BIS 12 = [0.43 1 1.2065 0.0635 2.88]; ACI 12 = [0.55 1 1.8335 0.0965 3.09] These can be put in matrix form as follows:
S = (19)
Their corresponding pseudo components are given as:
X = (20)
With centre points
X12 = [0.5 0.5 0 0 0]; X13 = [0.5 0 0.5 0 0]; X14 = [0.5 0 0 0.5 0]; X15 = [0.5 0 0 0 0.5]; X23 = [0 0.5 0.5 0 0]; X24 = [0 0.5 0 0.5 0]; X25 = [0 0.5 0 0 0.5]; X34 = [0 0 0.5 0.5 0]; X35 = [0 0 0.5 0 0.5]; X45 = [0 0 0 0.5 0.5] According to [21],
Sij = XSi (21)
Substituting,
= * (22)
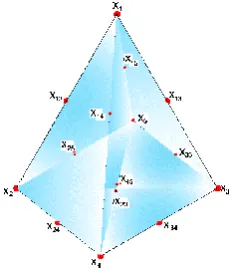
Figure 1 – Simplex plot for actual components Figure 2 – Simplex plot for pseudo components
Table I - Model Mix Ratios
w-c ratio Ce me nt Sand SDA Granite w-c ratio Ce me nt Sand SDA Granite
S1 S2 S3 S4 S5 X1 X2 X3 X4 X5
BRE12 0.54 1 1.9475 0.1025 2.95 Y1 1 0 0 0 0
BRE22 0.58 1 2.1185 0.1115 3.21 Y2 0 1 0 0 0
USBR22 0.58 1 2.2515 0.1185 3.29 Y3 0 0 1 0 0
BIS12 0.43 1 1.2065 0.0635 2.88 Y4 0 0 0 1 0
ACI12 0.55 1 1.8335 0.0965 3.09 Y5 0 0 0 0 1
N1 0.56 1 2.033 0.107 3.08 Y12 0.5 0.5 0 0 0
N2 0.56 1 2.0995 0.1105 3.12 Y13 0.5 0 0.5 0 0
N3 0.485 1 1.577 0.083 2.915 Y14 0.5 0 0 0.5 0
N4 0.545 1 1.8905 0.0995 3.02 Y15 0.5 0 0 0 0.5
N5 0.58 1 2.185 0.115 3.25 Y23 0 0.5 0.5 0 0
N6 0.505 1 1.6625 0.0875 3.045 Y24 0 0.5 0 0.5 0
N7 0.565 1 1.976 0.104 3.15 Y25 0 0.5 0 0 0.5
N8 0.505 1 1.729 0.091 3.085 Y34 0 0 0.5 0.5 0
N9 0.565 1 2.0425 0.1075 3.19 Y35 0 0 0.5 0 0.5
N10 0.49 1 1.52 0.08 2.985 Y45 0 0 0 0.5 0.5
Sample Points
Actual Compone nts Pse udo Compone nts
Re sponse Yex p
Table II – Control Points
w-c ratio Ce me nt Sand SDA Granite w-c ratio Ce me nt Sand SDA Granite
S1 S2 S3 S4 S5 X1 X2 X3 X4 X5
C1 0.558 1 2.0463 0.1077 3.114 YC1 0.4 0 0.4 0 0.2
C2 0.52 1 1.7537 0.0923 3.078 YC2 0 0.6 0 0.4 0
C3 0.548 1 2.0083 0.1057 3.018 YC3 0.8 0 0.2 0 0
C4 0.49 1 1.5713 0.0827 3.012 YC4 0 0.4 0 0.6 0
C5 0.544 1 1.9019 0.1001 3.006 YC5 0.6 0 0 0 0.4
C6 0.55 1 2.0425 0.1075 3.208 YC6 0 0 0.8 0.2 0
C7 0.55 1 1.9589 0.1031 3.03 YC7 0.6 0.2 0 0 0.2
C8 0.514 1 1.6967 0.0893 3.054 YC8 0 0.4 0 0.4 0.2
C9 0.548 1 1.8563 0.0977 3.062 YC9 0.2 0 0 0 0.8
C10 0.46 1 1.4155 0.0745 2.962 YC10 0 0 0.2 0.8 0
C11 0.566 1 2.1071 0.1109 3.182 YC11 0.2 0 0.6 0 0.2
C12 0.544 1 1.9323 0.1017 3.152 YC12 0 0.2 0.4 0.2 0.2
C13 0.58 1 2.1451 0.1129 3.226 YC13 0 0.8 0.2 0 0
C14 0.532 1 1.7651 0.0929 3.072 YC14 0 0.2 0 0.2 0.6
C15 0.536 1 1.8715 0.0985 3.084 YC15 0.2 0.2 0.2 0.2 0.2
Sample Points
Re sponse Yex p
Actual Compone nts Pse udo Compone nts
A. Uniaxial Compressive Strengths of Concrete
Two replicate concrete cubes were made for each of the thirty mix ratios in 150mmX150mmX150mm moulds and allowed to harden. The concrete cubes were removed from the mould after 24 hours and were soaked in water to cure for 28dyas. On the 28th day, the cubes were removed from the water and subjected to crushing with the aid of a uniaxial compressive strength machine. The compressive strengths were determined with eq. (23) and recorded in table (III).
[image:4.595.368.484.56.192.2]International Journal of Innovative Technology and Exploring Engineering (IJITEE) ISSN: 2278-3075, Volume-8 Issue-8, June, 2019
2516
Published By:
Blue Eyes Intelligence Engineering & Sciences Publication
Retrieval Number: H6899068819/19©BEIESP
(23)
[image:5.595.89.508.143.655.2]Where P = the applied compressive load at failure (KN) A = the cross-sectional area of the specimen (mm2)
Table III – Uniaxial Compressive Strengths of Concrete
Sample Load (KN) Area (mm2) Compressive Strength (N/mm
2
)
A B A B Average
BRE12 640 640 22500 28.444 28.444 28.444
BRE22 520 550 22500 23.111 24.444 23.778
USBR22 589.3 592.05 22500 26.191 26.313 26.252
BIS12 815 805 22500 36.222 35.778 36.000
ACI12 710.2 719 22500 31.564 31.956 31.760
N1 660 641 22500 29.333 28.489 28.911
N2 494 506 22500 21.956 22.489 22.222
N3 590 600 22500 26.222 26.667 26.444
N4 600 669 22500 26.667 29.733 28.200
N5 661 624 22500 29.378 27.733 28.556
N6 652 663 22500 28.978 29.467 29.222
N7 558 654 22500 24.800 29.067 26.933
N8 698 668 22500 31.022 29.689 30.356
N9 515 554 22500 22.889 24.622 23.756
N10 635 629 22500 28.222 27.956 28.089
C1 525 548 22500 23.333 24.356 23.844
C2 645 649 22500 28.667 28.844 28.756
C3 556 555 22500 24.711 24.667 24.689
C4 700 721 22500 31.111 32.044 31.578
C5 650 639 22500 28.889 28.400 28.644
C6 623 621 22500 27.689 27.600 27.644
C7 630 645 22500 28.000 28.667 28.333
C8 675 665 22500 30.000 29.556 29.778
C9 642 612 22500 28.533 27.200 27.867
C10 715 716 22500 31.778 31.822 31.800
C11 522 515 22500 23.200 22.889 23.044
C12 625 633 22500 27.778 28.133 27.956
C13 588 569 22500 26.133 25.289 25.711
C14 669 651 22500 29.733 28.933 29.333
C15 587 591 22500 26.089 26.267 26.178
IV. RESULTS AND DISCUSSIONS
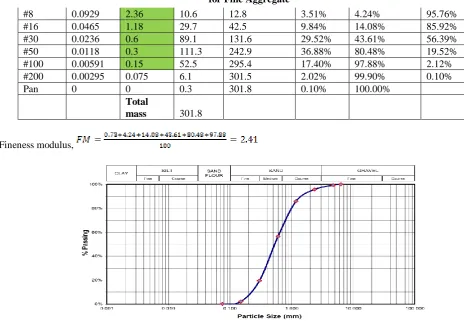
Table IV - Sieve Analysis Data for Fine Aggregate with 5% SDA replacement
Standard Sieve Opening Sizes Mass Retained (g)
Cumulative Mass Retained (g)
% Retained
Cumulative
% Retained % Passing Sieve
Number
Sieve size (in)
Sieve size (mm)
1/4" 0.25 6.3 0 0 0.00% 0.00% 100.00%
#8 0.0929 2.36 10.6 12.8 3.51% 4.24% 95.76%
#16 0.0465 1.18 29.7 42.5 9.84% 14.08% 85.92%
#30 0.0236 0.6 89.1 131.6 29.52% 43.61% 56.39%
#50 0.0118 0.3 111.3 242.9 36.88% 80.48% 19.52%
#100 0.00591 0.15 52.5 295.4 17.40% 97.88% 2.12%
#200 0.00295 0.075 6.1 301.5 2.02% 99.90% 0.10%
Pan 0 0 0.3 301.8 0.10% 100.00%
Total
mass 301.8
[image:6.595.48.513.44.372.2]Fineness modulus,
Figure 3 - Particle Size Distribution for Fine Aggregate with 5% SDA replacement
A. Scheffe’s Model for 28 days Compressive Strength
The coefficients of polynomial from table (3), eq. (16), and eq. (18) are: β1 = 28.444, β2 = 23.778, β3 = 26.252, β4 = 36, β5 = 31.76,
Similarly, β13 = -20.504, β14 = -23.112, β15 = -7.608, β23 = 14.164, β24 = -2.668, β25 = -3.344, β34 = -3.08, β35 = -21, β45 = -23.164.
Substituting the above coefficients into eq. (12) gives
(24)
International Journal of Innovative Technology and Exploring Engineering (IJITEE) ISSN: 2278-3075, Volume-8 Issue-8, June, 2019
2518
Published By:
Blue Eyes Intelligence Engineering & Sciences Publication
Retrieval Number: H6899068819/19©BEIESP 15
17 19 21 23 25 27 29 31 33 35
YC1 YC2 YC3 YC4 YC5 YC6 YC7 YC8 YC9 YC10 YC11 YC12 YC13 YC14 YC15
28
days com
pr
essive
streng
ths
(N
/m
m
2)
Response
[image:7.595.77.522.54.255.2]Experimental Values Predicted Values
Figure 4 - Comparison between Experimental and Predicted 28days Compressive Strengths
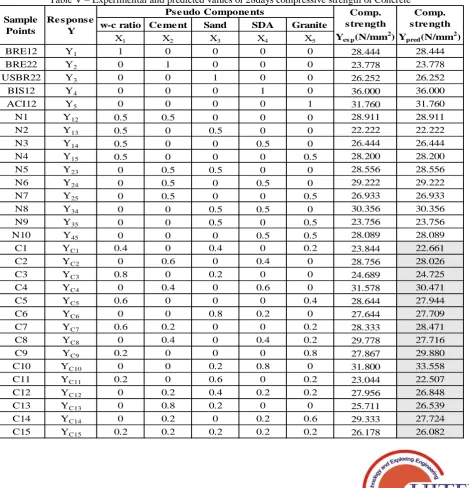
Table V – Experimental and predicted values of 28days compressive strength of Concrete
w-c ratio Ce me nt Sand SDA Granite
X1 X2 X3 X4 X5
BRE12 Y1 1 0 0 0 0 28.444 28.444
BRE22 Y2 0 1 0 0 0 23.778 23.778
USBR22 Y3 0 0 1 0 0 26.252 26.252
BIS12 Y4 0 0 0 1 0 36.000 36.000
ACI12 Y5 0 0 0 0 1 31.760 31.760
N1 Y12 0.5 0.5 0 0 0 28.911 28.911
N2 Y13 0.5 0 0.5 0 0 22.222 22.222
N3 Y14 0.5 0 0 0.5 0 26.444 26.444
N4 Y15 0.5 0 0 0 0.5 28.200 28.200
N5 Y23 0 0.5 0.5 0 0 28.556 28.556
N6 Y24 0 0.5 0 0.5 0 29.222 29.222
N7 Y25 0 0.5 0 0 0.5 26.933 26.933
N8 Y34 0 0 0.5 0.5 0 30.356 30.356
N9 Y35 0 0 0.5 0 0.5 23.756 23.756
N10 Y45 0 0 0 0.5 0.5 28.089 28.089
C1 YC1 0.4 0 0.4 0 0.2 23.844 22.661
C2 YC2 0 0.6 0 0.4 0 28.756 28.026
C3 YC3 0.8 0 0.2 0 0 24.689 24.725
C4 YC4 0 0.4 0 0.6 0 31.578 30.471
C5 YC5 0.6 0 0 0 0.4 28.644 27.944
C6 YC6 0 0 0.8 0.2 0 27.644 27.709
C7 YC7 0.6 0.2 0 0 0.2 28.333 28.471
C8 YC8 0 0.4 0 0.4 0.2 29.778 27.716
C9 YC9 0.2 0 0 0 0.8 27.867 29.880
C10 YC10 0 0 0.2 0.8 0 31.800 33.558
C11 YC11 0.2 0 0.6 0 0.2 23.044 22.507
C12 YC12 0 0.2 0.4 0.2 0.2 27.956 26.848
C13 YC13 0 0.8 0.2 0 0 25.711 26.539
C14 YC14 0 0.2 0 0.2 0.6 29.333 27.724
C15 YC15 0.2 0.2 0.2 0.2 0.2 26.178 26.082
Sample Points
Re s pons e Y
Ps e udo Compone nts Comp.
s tre ngth Yex p(N/mm 2
)
Comp. s tre ngth Ypred(N/mm 2
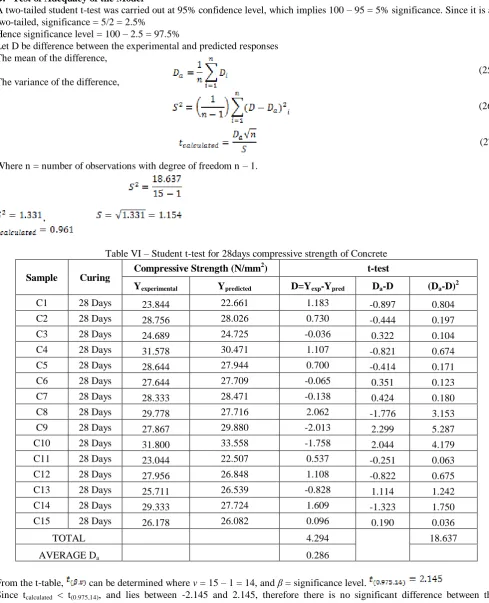
[image:7.595.67.537.297.785.2]B. Test of Adequacy of the Model
A two-tailed student t-test was carried out at 95% confidence level, which implies 100 – 95 = 5% significance. Since it is a two-tailed, significance = 5/2 = 2.5%
Hence significance level = 100 – 2.5 = 97.5%
Let D be difference between the experimental and predicted responses The mean of the difference,
(25) The variance of the difference,
(26)
(27)
Where n = number of observations with degree of freedom n – 1.
[image:8.595.51.541.60.664.2],
Table VI – Student t-test for 28days compressive strength of Concrete
Sample Curing Compressive Strength (N/mm
2
) t-test
Yexperimental Ypredicted D=Yexp-Ypred Da-D (Da-D)2
C1 28 Days 23.844 22.661 1.183 -0.897 0.804
C2 28 Days 28.756 28.026 0.730 -0.444 0.197
C3 28 Days 24.689 24.725 -0.036 0.322 0.104
C4 28 Days 31.578 30.471 1.107 -0.821 0.674
C5 28 Days 28.644 27.944 0.700 -0.414 0.171
C6 28 Days 27.644 27.709 -0.065 0.351 0.123
C7 28 Days 28.333 28.471 -0.138 0.424 0.180
C8 28 Days 29.778 27.716 2.062 -1.776 3.153
C9 28 Days 27.867 29.880 -2.013 2.299 5.287
C10 28 Days 31.800 33.558 -1.758 2.044 4.179
C11 28 Days 23.044 22.507 0.537 -0.251 0.063
C12 28 Days 27.956 26.848 1.108 -0.822 0.675
C13 28 Days 25.711 26.539 -0.828 1.114 1.242
C14 28 Days 29.333 27.724 1.609 -1.323 1.750
C15 28 Days 26.178 26.082 0.096 0.190 0.036
TOTAL 4.294 18.637
AVERAGE Da 0.286
From the t-table, can be determined where v = 15 – 1 = 14, and β = significance level.
International Journal of Innovative Technology and Exploring Engineering (IJITEE) ISSN: 2278-3075, Volume-8 Issue-8, June, 2019
2520
Published By:
Blue Eyes Intelligence Engineering & Sciences Publication
Retrieval Number: H6899068819/19©BEIESP
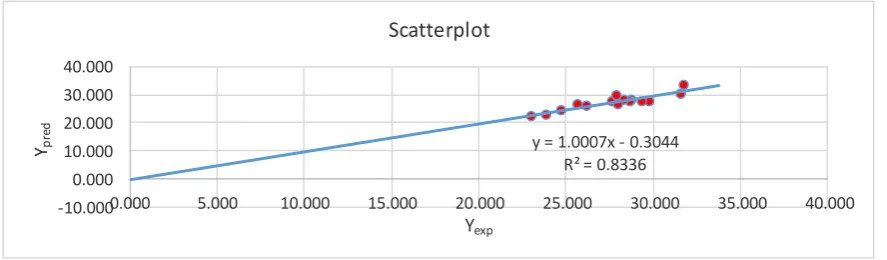
y = 1.0007x - 0.3044 R² = 0.8336
-10.000 0.000 10.000 20.000 30.000 40.000
0.000 5.000 10.000 15.000 20.000 25.000 30.000 35.000 40.000
Ypre
d
[image:9.595.78.522.54.184.2]Yexp Scatterplot
Figure 5 – Scatterplot of Predicted vs. Experimental 28days Compressive Strengths
V. CONCLUSION AND RECOMMENDATIONS
Replacement of fine aggregate with 5% SDA has resulted in acceptable 28 days compressive strengths (between 22 and 36N/mm2) with concrete mix ratios resulting from different design methods. A regression model has been generated from the resulting laboratory experiments using Scheffe’s simplex theory. A two-tailed t-test was carried out, which confirmed the adequacy of the derived model with an R2 value of 0.8336. The results also confirmed that SDA is a suitable material to replace a small fraction of fine aggregate in a bid to promote sustainability.
REFERENCES
1. C. Marthong, “Sawdust Ash ( SDA ) as Partial Replacement of Cement,” Int. J. Eng. Res. Appl., vol. 2, no. 4, pp. 1980–1985, 2012.
2. M. S. Mamlouk and J. P. Zaniewski, “Materials for Civil and Construction Engineers,” 2nd ed., New Jersey: Pearson Prentice Hall, 2006.
3. T. H. Ogunribido, “Geotechnical Properties of Saw Dust Ash Stabilised South-Western Nigerian Lateritic Soils,” Environ. Res. Eng. Manag., vol. 2, no. 60, pp. 29–30, 2012.
4. G. R. Otoko and B. K. Honest, “Stabilization of Nigerian Deltaic Laterites with Saw Dust Ash,” Int. J. Sci. Res. Manag., vol. 2, no. 8, pp. 1287–1292, 2014.
5. S. Chowdhury, M. Mishra, and O. Suganya, “The incorporation of wood waste ash as a partial cement replacement material for making structural grade concrete : An overview,” Ain Shams Eng. J., vol. 6, pp. 429–437, 2015.
6. A. Sofi, A. Saxena, P. Agrawal, A. R. Sharma, and K. Sharma, “Strength Predictions of Saw Dust and Steel Fibres in Concrete,” Int. J. Innov. Res. Sci. Eng. Technol., vol. 4, no. 2, pp. 12473–12477, 2015.
7. M. Mageswari and B. Vidivelli, “THE USE OF SAWDUST ASH AS FINE AGGREGATE REPLACEMENT IN CONCRETE,” J. Environ. Res. Dev., vol. 3, no. 3, pp. 720–726, 2009.
8. A. A. Raheem, B. S. Olasunkanmi, and C. S. Folorunso, “Saw Dust Ash as Partial Replacement for Cement in Concrete,” Organ. Technol. Manag. - An Int. J., vol. 4, no. 2, pp. 474–480, 2012.
9. T. R. Naik, “Tests of Wood Ash as a Potential Source for Construction Materials,” UWM Center for By-product Utilisation, Report No. CBU-1999-09, Department of Civil Engineering and Mechanics, University of Wisconsin-Milwauke, Milwauke, 1999.
10.S. T. Tyagher, J. T. Utsev, and T. Adagba, “SUITABILITY OF SAW DUST ASH-LIME MIXTURE FOR PRODUCTION OF SANDCRETE HOLLOW BLOCKS,” Niger. J. Technol., vol. 30, no. 1, pp. 1–6, 2011. 11.ASTM.C618, Standard Specification for Coal Fly Ash and Raw or Calcined Natural Pozzolan for Use as a Mineral Admixture in Concrete. West Conshohocken: American Society for Testing and Materials, 2000. 12.A. A. Raheem and O. K. Sulaiman, “Saw Dust Ash as Partial Replacement for Cement in the Production of Sandcrete Hollow Blocks,” Int. J. Eng. Res. Appl., vol. 3, no. 4, pp. 713–721, 2013.
13.C. U. Anya, “Models for Predicting the Structural Characteristics of Sand-Quarry Dust Blocks,” Ph.D Thesis, University of Nigeria, Nsukka, 2015.
14.Y. M. Gamil and I. H. Bakar, “The Development of Mathematical
Prediction Model to Predict Resilient Modulus for Natural Soil Stabilised by POFA-OPC Additive for the Use in Unpaved Road Design,” in Soft Soil Engineering International Conference, 2015, pp. 1–11.
15.E. M. Mbadike and N. N. Osadebe, “Application of Scheffe’s model in optimization of compressive strength of lateritic concrete,” J. Civ. Eng. Constr. Technol., vol. 4, no. 9, pp. 265–274, 2013.
16.E. M. Mbadike and N. N. Osadere, “Five Component Concrete Mix Optimization of Aluminum Waste Using Scheffe’s Theory,” Int. J. Comput. Eng. Res., vol. 4, no. 4, pp. 23–31, 2014.
17.C. E. Okere, D. O. Onwuka, S. U. Onwuka, and J. I. Arimanwa, “Simplex-Based Concrete Mix Design,” IOSR J. Mech. Civ. Eng., vol. 5, no. 2, pp. 46–55, 2013.
18.P. N. Onuamah,
“Prediction-of-the-Compressive-Strength-of-Concrete-with-Palm-Kernel -Aggregate-Using-the-Artificial-Neutral-Networks-Approach.docx,” Int. J. Sci. Eng. Res., vol. 6, no. 6, pp. 962–969, 2015.
19.N. N. Osadebe, C. C. Mbajiorgu, and T. U. Nwakonobi, “AN OPTIMIZATION MODEL DEVELOPMENT FOR LATERIZED- CONCRETE MIX PROPORTIONING IN BUILDING,” Niger. J. Technol., vol. 26, no. 1, pp. 37–46, 2007.
20.K. M. Oba, “A Mathematical Model to Predict the Tensile Strength of Asphalt Concrete Using Quarry Dust Filler,” Int. J. Sci. Eng. Res., vol. 10, no. 2, pp. 1491–1498, 2019.
21.H. Scheffe, “Experiments with Mixtures,” J. R. Stat. Ser. B, vol. 25, no. 2, pp. 235–263, 1958.
AUTHORS PROFILE
Engr. Oba, Kenneth Miebaka is a Lecturer in the Rivers State University, Port Harcourt, Nigeria. He holds a Bachelor’s Degree in Civil Engineering, from the Rivers State University, a Master’s Degree in Construction Project Management from the University of Central Lancashire, UK, and is currently pursuing a PhD in Civil Engineering from the University of Nigeria. His research interest is in Construction Materials, Construction Engineering, Construction Management and Engineering Contracting, and Project Management. He has a vast industrial experience in civil engineering design, construction and project management. He is a chartered engineer and a member of several professional bodies. He has published several scholarly articles in local and international journals.
His teaching and research interests cover; construction & project management, sustainable construction & development, risk management, infrastructure security, advanced ICT & Computing in civil engineering and construction, construction industry logistics and supply chain management. He is a chartered engineer and a member of several professional bodies. He was a Guest Lecturer at the Dept of Civil Engineering, University of Hong Kong (HKU) from 2007-2008. He was an Honorary Assistant Professor/Research Assistant Professor at the Dept of Civil Engineering, the University of Hong Kong from 2002-2006. He initiated research on “Infrastructure Projects Sustainability”, at the Centre for Infrastructure and Construction Industry Development (CICID), Department of Civil Engineering, HKU, and investigated various dimensions of infrastructure sustainability. Before joining the HKU, he worked as a Post-Doctoral Research Associate in the Department of Civil and Building Engineering, Loughborough University UK. The Faculty of Engineering Research Committee, Loughborough University UK awarded him the Outstanding Researcher Award in 2001, for his outstanding contribution to Research & Development. He was a Visiting Research Scholar in the Department of Civil, Environmental and Infrastructure Engineering (CEIE) in the Information Technology and Engineering (ITE) School at George Mason University Fairfax, Virginia, USA in 2002, during which he investigated Automated Agent Learning in the context of steel structures design. He held the Royal Society UK Fellowship Award as a Visiting Scientist from China to Loughborough University UK, in 2003, and the Republic of South Africa National Research Foundation (NRF) International Science Liaison (ISL) Visiting Fellowship [NRF-ISL] Award to Cape Peninsula University of Technology, South Africa, in 2005. He is a Peer Reviewer for several international journals, and has published over 100 scientific papers, books, and reports in his research areas. He has successfully supervised several postgraduate students in Nigeria, Asia and Europe, and has been an International External Examiner for universities in the Republic of South Africa.