DEVELOPMENT AND EVALUATION OF VANCOMYCIN DOSAGE GUIDELINES
1
DESIGNED TO ACHIEVE NEW TARGET CONCENTRATIONS
2
3
Thomson AH1,2*, Staatz CE 1,2#, Tobin CM3,Gall M4, Lovering AM3
4
5
1. Strathclyde Institute of Pharmacy and Biomedical Sciences, University of
6
Strathclyde, Glasgow
7
2. Pharmacy Department, Western Infirmary, NHS Greater Glasgow and Clyde,
8
Glasgow
9
3. Bristol Centre for Antimicrobial Research and Evaluation, Department of
10
Microbiology, Southmead Hospital, Bristol
11
4. Pharmacy Department, Southern General Hospital, NHS Greater Glasgow and
12
Clyde, Glasgow
13
14
#Present address:
15
School of Pharmacy, University of Queensland, Brisbane, Qld 4072, Australia.
16
17
*Address for correspondence:
18
Dr Alison H Thomson, Strathclyde Institute of Pharmacy and Biomedical Sciences,
19
University of Strathclyde, Glasgow G40NR
20
Tel: 0141 548 2506
21
Fax: 0141 552 2562
22
Email: [email protected]
23
Keywords: population pharmacokinetics, therapeutic drug monitoring, antimicrobial
24
agents
25
26
Running title: Vancomycin dosage guidelines
27
Synopsis
29
Aims: To develop a population pharmacokinetic model of vancomycin in adult
30
patients; to use this model to develop dosage guidelines targeting vancomycin trough
31
concentrations of 10 – 15 mg/L and to evaluate the performance of these new
32
guidelines.
33
Methods: All data analyses were performed using NONMEM®. A population
34
pharmacokinetic model was first developed from vancomycin dosage and
35
concentration data collected during routine TDM in 398 patients, then new
36
vancomycin dosage guidelines were devised by using the model to predict
37
vancomycin trough concentrations in a simulated dataset. Individual estimates of CL
38
and V1 were then obtained in an independent group of 100 patients using the
39
population model and the POSTHOC option. These individual estimates were used
40
to predict vancomycin trough concentrations and steady state AUC24/MIC ratios using
41
the current and new dosage guidelines.
42
Results: The population analysis found that the vancomycin data were best
43
described using a bi-exponential elimination model with a typical CL of 3.0 L/h that
44
changed by 15.4% for every 10 mL/min difference from a CLCR of 66 mL/min. Vss
45
was 1.4 L/kg. The proposed dosage guidelines were predicted to achieve 55% of
46
vancomycin troughs within 10 – 15 mg/L and 71% within 10 – 20 mg/L, which is
47
significantly higher than current guidelines (19% and 22% respectively). The
48
proportion of AUC24/MIC ratios above 400 was also higher; 87% compared to 58%.
49
Discussion: New vancomycin dosage guidelines have been developed that achieve
50
trough concentrations of 10 – 15 mg/L earlier and more consistently than current
51
guidelines.
52
244 words
53
INTRODUCTION
56
With the rapid increase in the incidence of methicillin-resistant
57
Staphylococcus aureus (MRSA) infection and concerns about the clinical
58
consequences of underdosing, achieving target concentrations of vancomycin
59
efficiently has become increasingly important. Traditionally, “peak” and “trough”
60
concentrations were measured and the focus was on preventing toxicity by avoiding
61
what were perceived to be excessive troughs (>10 mg/L).1 More recently, evidence
62
that trough concentrations of 5 – 10 mg/L might be insufficient to achieve adequate
63
tissue penetration and kill rates for more resistant species has prompted laboratories
64
to recommend a variety of higher target values, up to and exceeding 15 mg/L.2
65
These changes reflect current British National Formulary (BNF) recommendations of
66
10 – 15 mg/L and 15 – 20 mg/L for more resistant strains.3 Similar targets have also
67
been suggested for pneumonia4 and meningitis,5 while continuous infusions of
68
vancomycin which target average steady state concentrations of 15 – 25 mg/L, have
69
been advocated for critically ill patients.6
70
Further support for using higher target concentrations of vancomycin is based
71
on observations that nephrotoxicity is rare with the current formulation,7 although
72
there is some evidence of an increased risk of nephrotoxicity with co-administration
73
of other nephrotoxic agents, prolonged therapy and concentrations above 10 mg/L.8,9
74
More recently, nephrotoxicity has been associated with vancomycin doses above 4
75
grams per day,10 trough concentrations above 15 mg/L11,12 and average steady
76
state concentrations above 28 mg/L.13
77
Despite the current support for using more aggressive vancomycin therapy, a
78
recent review revealed that none of the laboratories surveyed in Scotland had made
79
changes to their hospital dosing recommendations.2 Furthermore, most established
80
guidelines and nomograms quote only a standard dosage regimen3 or aim for target
81
concentrations that are generally lower than currently recommended.14-17 This is
82
reflected within Glasgow, where vancomycin is currently prescribed using dosage
83
although current laboratory practice favours BNF recommendations.3 These
85
observations prompted the need for new dosage guidelines that could achieve these
86
higher targets.
87
The aims of this study were to develop a population pharmacokinetic model to
88
describe the handling of vancomycin in adult patients from data collected during their
89
routine clinical care, to use the model to develop dosage guidelines aimed at
90
achieving higher trough concentrations and to evaluate the performance of these
91
new guidelines using data collected from an independent group of patients.
92
93
METHODS
94
Study approval
95
All data collected for this study were obtained during patients’ routine clinical
96
care and the population analysis was defined as audit by the West Ethics Committee
97
of the North Division of NHS Greater Glasgow (approval number 99/111, letter dated
98
16 June 1999). The data collection conducted at Southmead Hospital, Bristol was
99
also designated as audit.
100
101
Patients and data collection
102
Data for population pharmacokinetic model development were collected
103
retrospectively from routine therapeutic drug monitoring (TDM) files of patients who
104
were treated with intravenous (iv) vancomycin therapy between May 1991 and July
105
2004 at the Western Infirmary, Glasgow and Gartnavel General Hospital, Glasgow
106
and prospectively from patients treated with vancomycin in Southmead Hospital,
107
Bristol (1999 to 2002). Data from 102 of the 398 patients who were included in this
108
population model dataset had been included in a previous population modelling
109
study.18 A second data set, which was used to evaluate the dosage guidelines, was
110
compiled retrospectively from TDM files of 100 patients who were treated with iv
111
vancomycin between November 2004 and June 2007 at the Western Infirmary,
112
one vancomycin concentration measurement recorded, were eligible for inclusion.
114
Patients in renal failurewho were receiving renal replacement therapy and patients in
115
whom dosage and/or sampling times were missing or not clear were excluded from
116
the analysis.
117
Information on vancomycin dosage amounts, exact dates and times, infusion
118
length and patient demographic factors was extracted from routine TDM files that had
119
been completed during each patient’s treatment. Demographic data collected
120
included patient age, total body weight (TBW), height and gender. Lean body weight
121
(LBW),19 LBW based on a semi-parametric calculation,20 ideal body weight (IBW),21
122
and body surface area (BSA),22 were calculated from patient weight, height and
123
gender. Serial measurements of serum creatinine (SeCr) were recorded from TDM
124
files and clinical chemistry electronic records. SeCr measurements below the lower
125
limit of the reference range (60 mol/L) were set to 60 mol/L as described
126
previously.23 Creatinine clearance (CLCR) was calculated using the Cockcroft-Gault
127
equation,24 the Jelliffe equation,25 the Salazar Corcoran equation,26 and the MDRD
128
equation.27 Additionally, a CLCR estimate was obtained using LBW,19 and IBW,21
129
instead of TBW in the Cockcroft-Gault equation.24
130
Differences in demographic and clinical features between the population
131
model development and evaluation patient groups were examined by calculating the
132
95% confidence interval (CI) for the difference in proportion or by a Mann Whitney U
133
test or Student’s t-test (as appropriate) with significance level set at p<0.05.
134
135
Vancomycin assay
136
Vancomycin drug concentrations were analysed by fluorescence polarization
137
immunoassay at the Microbiology Departments of the Western Infirmary (TDx, Abbott
138
Diagnostics, Chicago, USA) or Southmead Hospital (FLx, Abbott Diagnostics,
139
Chicago, USA). The inter-assay coefficients of variation for the TDx were 4.3% at
140
mg/L, 1.9% at 35 mg/L and 2.0% at 75.0 mg/L. The lower limit of quantification was
142
2 mg/L for both analysers.
143
144
Population pharmacokinetic analysis
145
Population modelling was performed using NONMEM® (version 6, Globomax
146
Inc.)28 with a G77 FORTRAN compiler. Analysis and post processing were
147
performed with the aid of the PsN toolkit,29 and Xpose (Version 4),30 programmed in
148
the statistics package R.31
149
Single and bi-exponential elimination models were compared and both
150
untransformed and log-transformed vancomycin concentrations were analysed.
151
Inter-individual variability in pharmacokinetic parameters was assumed to be
log-152
linear. Residual error on concentration was described by a combined error model.
153
Covariance between inter-individual variabilities in drug CL and V was examined. All
154
modelling was performed using First Order Conditional Estimation with interaction.
155
Clinical factors investigated for an influence on the pharmacokinetics of
156
vancomycin were: gender; age; TBW; LBW; IBW; BSA; height; day of therapy; SeCr
157
and all CLCR estimates. Potentially useful covariates were identified by GAM analysis
158
and scatter plots and were then introduced sequentially into the population model.
159
Models were compared visually with a range of plots and statistically using a
160
likelihood ratio test on the differences in the objective function value (OFV) with
161
significance set at p<0.005. Changes in inter-individual variability and residual
162
random error were also examined.
163
Uncertainty in the final population model parameter estimates was assessed
164
using a bootstrap method.32 In brief, this involves repeated random sampling, with
165
replacement, of the original data set to produce another data set of the same size but
166
with a different combination of subjects. As the number of bootstrap samples
167
approaches infinity, the sample standard deviations of the parameters approach the
168
with the assistance of the PsN toolkit.29 Mean parameter estimates obtained from
170
250 bootstrap runs were compared to population mean values.
171
172
Development of Dosage Guidelines
173
A data set was created containing 110 simulated “patients” with a range of
174
weights (40, 50, 60, 70, 80, 90, 100 or 120 kg) and CLCR estimates (15, 20, 25, 30,
175
40, 50, 60, 70, 80, 90, 100, 110 or 125 mL/min) that spanned the typical patient
176
population. Draft dosage guidelines containing a range of loading and maintenance
177
doses were then tested for their ability to achieve vancomycin trough concentrations
178
of 10 – 15 mg/L during the first 4 days of therapy. Dosage amounts were fixed to
179
multiples of 250 mg and dosage intervals were limited to 12, 24 or 48 hours for
180
practicality. Each individual in the simulated dataset was assigned a vancomycin
181
dosage history then trough concentrations were predicted by running NONMEM®
182
with the population parameter values fixed at the final model estimates. These
183
predicted troughs were compared with the target range of 10 – 15 mg/L. The draft
184
guidelines were then amended for simulated patients whose weight and/or CLCR
185
combinations resulted in vancomycin trough predictions outside the desired range.
186
This process was repeated until final dosing guidelines were created that consistently
187
achieved the target concentrations in the simulated patients.
188
189
Evaluation of New Dosage Guidelines
190
A data file containing all clinical, dosage and concentration data recorded for
191
patients in the evaluation data set was created. Individual estimates of vancomycin
192
pharmacokinetic parameters were then obtained for each patient by MAP Bayesian
193
analysis of their data using the final population model and the POSTHOC option in
194
NONMEM®. These empirical Bayes’ estimates were used to predict the trough
195
concentrations that would have been expected during the first 4 days of therapy if
196
each patient had been treated according to the current and the new dosage
197
days of therapy were compared by determining the 95% confidence intervals of their
199
differences with correction for multiple comparisons. Area under the concentration –
200
time curve for a 24 hour period at steady state (AUC24) was calculated from daily
201
dose amount/CL and average steady state concentration (Css) from dose rate/CL.
202
203
RESULTS
204
Patients and data collection
205
Data were collected from 398 patients for population model building (including
206
99 patients from Bristol) and a further 100 patients for evaluation of the new dosage
207
guidelines. Demographic, clinical, dosage and concentration data from both groups
208
are summarised in Table 1. The population model data set comprised 1557
209
vancomycin concentration measurements and the evaluation data set 171
210
measurements. The median measured vancomycin concentration was 12.1 mg/L in
211
both data sets. The majority of samples, 64% and 62% respectively, were drawn at
212
least 10 hours after the start of the infusion. There were no significant differences
213
between the population model building and evaluation datasets in terms of patients’
214
initial SeCr values, initial vancomycin dose, vancomycin concentration values or the
215
length of time after the start of infusion that vancomycin concentrations were
216
measured. However, patients in the evaluation group were more likely to be female,
217
to be older, to weigh less and to have lower CLCR estimates (Table 1).
218
219
Population modelling
220
The vancomycin data were best described by a bi-exponential elimination
221
model and results were similar with non-transformed and log-transformed
222
vancomycin concentration data. The final covariate model included CLCR estimated
223
using the Cockcroft-Gault equation based on TBW as the only factor affecting CL;
224
TBW influenced both the volume of the central (V1) and peripheral compartments
225
(V2). Inclusion of CLCR reduced inter-individual variability on CL from 53% to 27%
and the model OFV by 679 points and the addition of TBW reduced inter-individual
227
variability on V1 from 26% to 15% and the model OFV by a further 34 points.
228
Pharmacokinetic parameter estimates from the final population model are
229
presented in Table 2. The parameter values from the final model obtained from
230
application of bootstrap analysis were similar to the final model developed using the
231
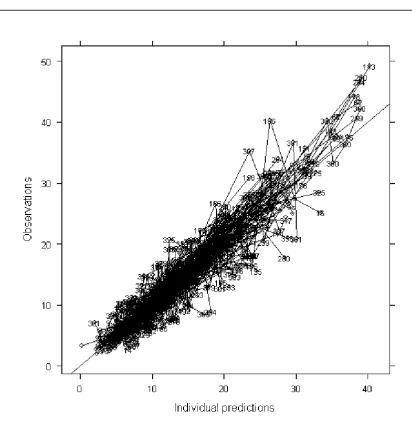
398 patients, with no parameter difference greater than 10%. A plot of
model-232
predicted versus observed concentrations for the final model based on population
233
parameter estimates and individual parameter estimates is shown in Figures 1a and
234
1b respectively. Examination of plots of conditional weighted residuals (CWRES)
235
versus time after dose confirmed the appropriateness of the bi-exponential
236
elimination model.
237
238
Development and evaluation of dosage guidelines
239
Table 3 shows the guidelines currently in use within North Glasgow (target
240
trough 5 – 10 mg/L) and Tables 4 and 5 the revised guidelines (target trough 10 – 15
241
mg/L). Although the doses are generally similar, the new guidelines included a
242
loading dose and tended to recommend higher doses or shorter dosage intervals (i.e.
243
the same daily dose but split and given 12 hourly rather than 24 hourly).
244
POSTHOC analysis of the evaluation data set encountered problems with
245
non-physiological values when all parameters were estimated therefore only CL and
246
V1 were estimated; V2 and intercompartmental clearance (Q) were fixed at
247
population values. Using these individual CL and V1 estimates, the predicted trough
248
concentrations in the validation data set over the first 4 days of therapy were
249
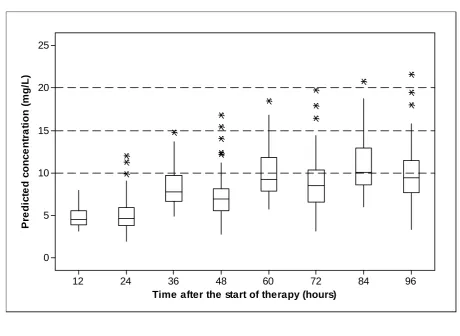
consistently higher at each time point with the new guidelines (Figure 2a) compared
250
to the old guidelines (Figure 2b). Mean (SD) predicted trough concentrations during
251
this period were also significantly higher with the new guidelines 12.2 (3.4) mg/L, (n =
252
688) compared to 7.9 (3.3) mg/L with the old guidelines (n = 514). Differences in the
253
number of samples reflect more 12 hourly dosing with the new guidelines.
254
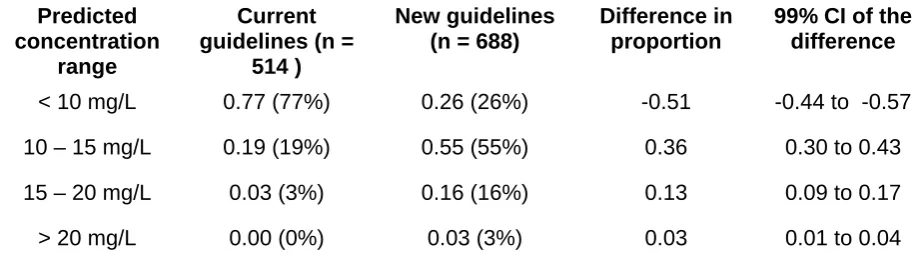
10 – 15 mg/L, 15 – 20 mg/L and >20 mg/L were also higher. Overall, within the first 4
256
days of therapy, 55% of vancomycin trough concentrations were predicted to be
257
within 10 – 15 mg/L with the new dosage guidelines compared with only 19% with the
258
current dosage guidelines. The percentages within the range 10 – 20 mg/L were
259
even higher (71% compared to 22%). Predicted average Css concentration and
260
AUC24 in the validation data set were also higher with the new guidelines. Mean (SD)
261
estimates of AUC24 were 520 (124) mg.h/L and 436 (104) mg.h/L and mean (SD) Css
262
estimates were 21.7 (5.2) mg/L and 18.2 (4.3) mg/L respectively. Assuming an MIC
263
of 1 mg/L, 87% of patients were predicted to have an AUC24/MIC ratio above 400 and
264
only 4% would be below 350 if the new guidelines were followed, compared to 58%
265
and 24%, respectively, with the current guidelines.
266
267
DISCUSSION
268
This study used data collected during routine TDM to determine population
269
estimates of vancomycin pharmacokinetic parameters, develop new dosage
270
guidelines and evaluate these new guidelines prospectively.
271
Some of the data that were included in the present population analysis had
272
been analysed previously in an investigation of vancomycin pharmacokinetics in 102
273
cardiothoracic surgery patients with unstable renal function.18 This previous study
274
found that data from such patients could be described adequately if serial
275
measurements of creatinine concentration, which indicated renal function changes,
276
were available. Although a mono-exponential elimination model proved adequate in
277
the earlier study, the current analysis found that the data were better described using
278
a two-compartment model. The typical estimate of CL was 3 L/h in both analyses but
279
the influence of CLCR was slightly different; the previous study identified a 20.5%
280
change in vancomycin CL with every 10 mL/min change in CLCR from 66 mL/min
281
compared to only 15.4% in the current analysis. The Cockcroft Gault equation24
282
based on TBW provided the best fit of the data overall. Other pharmacokinetic
283
studies have found similar relationships between vancomycin CL and CLCR. Based
on a CLCR of 66 mL/min, CL estimates identified in these earlier studies were typically
285
around 3.0 L/h and ranged from 2.9 to 4.3 L/h.15, 33-37
286
The volume of distribution of vancomycin is generally reported as 0.5 – 0.98
287
L/kgwith an average around 0.7 L/kg14,15,33,34,37, which is similar to the estimate of V1
288
(0.7 L/kg) identified in the present study. Although volume of distribution at steady
289
state (Vss) was higher at 1.4 L/kg, both Llopis-Salvia et al36 and Fernández de Gatta
290
Garcia et al38 reported even higher estimates (1.7 L/kg TBW) in their population
291
analyses of vancomycin pharmacokinetics. It is possible that differences in the
292
duration of therapy, the pharmacokinetic model used to analyse the data and the
293
clinical characteristics of the patients included in each study may have contributed to
294
these observations.
295
For both CL and V, a range of weight measurements were tested in the
296
population analysis, and although 19% of patients were clinically obese (Body Mass
297
Index >30 kg/m2) no clear improvement in the fit of the population model was
298
identified if TBW was replaced by LBW or IBW. These findings are consistent with
299
other studies. Although conflicting results have been reported on the influence of
300
obesity on vancomycin CL and V, TBW is usually recommended for dosage
301
adjustment39-42 and has practical advantages when applied in a routine clinical
302
environment. However, particular care is required when prescribing for patients who
303
are obese or underweight and close monitoring of vancomycin concentrations is
304
advised to ensure that dosage regimens are appropriate.
305
The current BNF dosage recommendation for iv pulsed infusion vancomycin
306
has recently been changed to 1000 – 1500 mg twice daily reduced to 500 mg twice
307
daily or 1000 mg daily in patients over 65 years of age3. Although these doses are
308
higher than previously recommended, it is not clear what trough concentrations will
309
be obtained with these dosage regimens and there is no guidance on how to adjust
310
for renal impairment. Other published dosage guidelines aim for troughs of 5 – 10
311
mg/L,15,17 5 – 20 mg/L16 or an average steady state concentration of 15 mg/L.14
312
2000 mg are usually required for patients with normal renal function, particularly if
314
they are critically ill.38,42,43 The present study demonstrated that the new guidelines
315
should achieve vancomycin trough concentrations of 10 – 15 mg/L earlier and more
316
consistently than current dosage guidelines. Other indicators of vancomycin efficacy
317
have also been investigated. Moise-Broder et al44 reported that clinical outcome was
318
significantly better if the AUC24/MIC ratio was greater than 400 in patients with S.
319
aureus lower respiratory tract infections and this target ratio has recently been
320
recommended in an American consensus review.42 In the present study, 87% of
321
patients were predicted to achieve satisfactory AUC24/MIC ratio ratios if the new
322
guidelines were followed. Low AUC24/MIC ratios typically occurred when the
323
individual estimate of CL was higher than predicted from CLCR. Much higher doses
324
or an alternative antibiotic would be required if the MIC was 2 mg/L since only 2% of
325
patients would be likely to achieve an AUC24/MIC ratio above 400. These difficulties
326
prompted the authors of the American consensus review to question the value of
327
vancomycin in the treatment of MRSA infections if the strain has an MIC above 1
328
mg/L.42
329
The present study has confirmed the importance of giving a loading dose
330
when starting vancomycin therapy, especially in patients with renal impairment, in
331
whom accumulation to steady state will take longer. Although the need for a loading
332
dose has been recognised for many years,15,45 and has recently been highlighted
333
again,42 loading doses are absent from the BNF guidelines3 and are not often used in
334
routine clinical practice.
335
Figure 2a demonstrates that the new dosage guidelines lead to a greater risk
336
of vancomycin trough concentrations accumulating above 15 mg/L, especially after
337
day 3 of therapy. This emphasises the need for monitoring vancomycin
338
concentrations within the first 3 days to avoid excessive accumulation and potential
339
for toxicity.9 However, troughs of 15 – 20 mg/L may also simply reflect the flatter
340
profile that the new guidelines aim to achieve. An extension of this principle would
341
increasingly being used in routine clinical practice since it is easier to monitor and
343
adjust doses. The pulsed infusion doses recommended in the new guidelines
344
presented here should achieve average steady state concentrations of around 22
345
mg/L and are therefore compatible with the continuous infusion target concentrations
346
of 15 – 25 mg/L that are commonly advocated6 and well below the 28 mg/L cut-off
347
identified by Ingram et al13 as being associated with an increased risk of toxicity.
348
Consequently, a trough of 15 – 20 mg/L does not necessarily indicate a problem; it
349
may simply reflect a flatter profile in a patient with poor renal function. Dosage
350
intervals of 8 hours offer an alternative administration method in cases where the
351
required daily dose is particularly high or could easily be divided into 3, for example,
352
1000 mg 8 hourly rather than 1500 mg twice daily or 500 mg 8 hourly rather than 750
353
mg twice daily. Six hourly administration of half the 12 hourly dose would also be
354
feasible but may be difficult to manage on a busy ward. Both options would achieve
355
higher trough concentrations and lower peaks but the same overall exposure
356
(AUC24).
357
In conclusion, this study has developed new, iv pulsed infusion dosage
358
guidelines for vancomycin following a population analysis of routine vancomycin
359
concentration data. The new guidelines are based on practical doses that are easy
360
to prepare and administer, and reflect current vancomycin target concentrations. A
361
preliminary evaluation of the guidelines using data collected from a separate group of
362
patients indicated that 55% of trough concentrations should be within 10 – 15 mg/L
363
and 71% within 10 – 20 mg/L over the first 4 days of therapy and that satisfactory
364
AUC24/MIC ratios should be achieved in 87% of patients, assuming an MIC of 1
365
mg/L. However, wide variability in the handling of vancomycin between and within
366
patients indicates that monitoring of concentrations is required to ensure that dosage
367
regimens are appropriate for individual patients.
368
ACKNOWLEDGEMENTS
372
The authors would like to thank Leanne Hunter for help with data collection and
373
analysis.
374
375
FUNDING
376
Christine Staatz was supported by a University of Queensland Travel Award for
377
collaborative research and a National Health and Medical Research Council Neil
378
Hamilton Fairley Post-doctoral Fellowship and Project Grant. Martyn Gall was an
379
MSc student funded by NHS Education for Scotland. Caroline Tobin was supported
380
by a project grant by the British Society for Antimicrobial Chemotherapy
381
382
TRANSPARENCY DECLARATIONS
383
None to declare.
384
385
REFERENCES
386
1. Tobin CM, Darville JM, Thomson AH et al. Vancomycin therapeutic drug
387
monitoring (TDM): Is there a consensus view? The results of a UK National
388
External Quality Assessment Scheme for Antibiotic Assays (UK NEQAS)
389
questionnaire. J Antimicrob Chemother 2002; 50: 713-8.
390
2. Helgason KO, Thomson AH, Ferguson C. A review of vancomycin therapeutic
391
drug monitoring recommendations in Scotland. J Antimicrob Chemother 2008; 61:
392
1398-9.
393
3. Joint Formulary Committee. British National Formulary, 56th ed. London: British
394
Medical Association and Royal Pharmaceutical Society of Great Britain;
395
September 2008.
396
4. American Thoracic Society, Infectious Diseases Society of America. Guidelines
397
for the management of adults with hospital-acquired, ventilator-associated, and
398
healthcare-associated pneumonia. Am J Respir Crit Care Med 2005; 171:
388-399
5. Tunkel AR, Hartman BJ, Kaplan SL et al. Practice guidelines for the management
401
of bacterial meningitis. Clin Infect Dis 2004; 39: 1267–84.
402
6. Wysocki M, Delatour F, Faurisson F et al. Continuous versus intermittent infusion
403
of vancomycin in severe staphylococcal infections: prospective multicenter
404
randomised study. Antimicrob Agents Chemother 2001; 45: 2460–7.
405
7. Gemmell CG, Edwards DI, Fraise AP et al. Guidelines for the prophylaxis and
406
treatment of methicillin-resistant Staphylococcus aureus (MRSA) infections in the
407
UK. J Antimicrob Chemother 2006; 57: 589–608.
408
8. Elting LS, Rubenstein EB, Kurtin D, et al. Mississippi Mud in the 1990s Risks and
409
outcomes of vancomycin-associated toxicity in general oncology practice. Cancer
410
1998; 83: 2597-607.
411
9. Rybak MJ, Albrecht LM, Bolke SC, et al. Nephrotoxicity of vancomycin, alone and
412
with and aminoglycoside. J Antimicrob Chemother 1990; 25: 679-97.
413
10. Lodise TP, Lomaestro B, Graves J, et al. Larger vancomycin doses (at least 4
414
grams per day) are associated with an increased incidence of nephrotoxicity.
415
Antimicrob Agents Chemother 2008; 52: 1330-6.
416
11. Hidayat LK, Hsu DI, Quist R, et al. High-dose vancomycin therapy for
methicillin-417
resistant Staphylococcus aureus infection. Efficacy and toxicity. Arch Int Med
418
2006; 166: 2138-44.
419
12. Jeffres MN, Isakow W, Doherty JA, et al. A retrospective analysis of possible
420
renal toxicity associated with vancomycin in patients with health care-associated
421
methicillin-resistant Staphylococcus aureus pneumonia. Clin Ther 2007; 29:
422
1107-15.
423
13. Ingram PR, Lye DC, Tambyah PA et al, Risk factors for nephrotoxicity associated
424
with continuous vancomycin infusion in outpatient parenteral antibiotic therapy. J
425
Antomicrob Chemother. 2008; 62: 168-71.
426
14. Moellering RC, Krogstad DJ, Greeenblatt DJ. Vancomycin therapy in patients
427
with impaired renal function: a nomogram for dosage. Ann Intern Med 1981; 94:
428
15. Matzke GR, McGory RW, Halstenson CE, et al. Pharmacokinetics of vancomycin
430
in patients with varying degrees of renal function. Antimicrob Agents Chemother
431
1984; 25: 433-7.
432
16. Karam CM, MvKinnon PS, Neuhauser MN, et al. Outcome assessment of
433
mimimising vancomycin monitoring and dosing adjustments. Pharmacotherapy
434
1999; 19: 257-66.
435
17. Lake KD, Peterson CD. Evaluation of a method for initiating vancomycin therapy:
436
experience in 205 patients. Pharmacotherapy 1988; 8: 284-6.
437
18. Staatz CE, Byrne C, Thomson AH. Population pharmacokinetic modelling of
438
gentamicin and vancomycin in patients with unstable renal function following
439
cardiothoracic surgery. Br J Clin Pharmacol 2006; 61: 164-76.
440
19. James W. Research on Obesity. London: Her Majesty’s Stationery Office, 1976.
441
20. Janmahasatian S, Duffull SB, Ash S, et al. Quantification of lean bodyweight. Clin
442
Pharmacokinet 2005; 44: 1051-65.
443
21. Devine BJ. Gentamicin therapy. Drug Intell Clin Pharm 1974: 8: 650-5.
444
22. Du Bois D, Du Bois EF. Clinical calorimetry. A formula to estimate the
445
approximate surface area if height and weight be known. Arch Intern Med 1916;
446
17: 863-71.
447
23. Rosario MC, Thomson AH, Jodrell DI, et al. Population pharmacokinetics of
448
gentamicin in patients with cancer. Br J Clin Pharmacol 1998; 46: 229-36.
449
24. Cockcroft DW, Gault H. Prediction of creatinine clearance from serum creatinine.
450
Nephron 1976; 16: 31-41.
451
25. Jelliffe R. Creatinine clearance: bedside estimate. Ann Intern Med 1973; 79:
604-452
5.
453
26. Salazar D, Corcoran G. Predicting creatinine clearance and renal drug clearance
454
in obese patients from estimated fat free body mass. Am J Med 1988; 84:
1053-455
27. Levey AS, Bosch JP, Lewis JB, et al. A more accurate method to estimate
457
glomerular filtration rate from serum creatinine: a new prediction equation. Ann Int
458
Med 1999; 130: 461-70.
459
28. NONMEM® Users Guides, (1989-2006). Beal SL, Sheiner LB, Boeckmann, AJ
460
(Eds.) Icon Development Solutions, Ellicott City, Maryland, USA.
461
29. Lindblom L, Pihlgren P, Jonsson EN. PsN-Toolkit- a collection of computer
462
intensive statistical methods for non-linear mixed effect modeling using
463
NONMEM. Comput Methods Programs Biomed 2005; 79: 241-57.
464
30. Jonsson N, Karlsson MO. Xpose- an S-PLUS Based population
465
pharmacokinetic/pharmacodynamic model building aid for NONMEM. Comp Meth
466
Prog Biomed 1999; 58: 51-64.
467
31. R Development Core Team. R: A Language and Environment for Statistical
468
Computing. .R Foundation for Statistical Computing, Vienna, Austria, 2008 url:
469
http://www.R-project.org (28 January 2009, date last accessed).
470
32. Elfron B, Tibshirani R. An Introduction to the Bootstrap, Chapman and Hall, New
471
York, 1993.
472
33. Yasuhara M, Ig T, Zenda H, et al. Population pharmacokinetics of vancomycin in
473
Japanese adult patients. Ther Drug Monit 1998; 20: 139-48.
474
34. Buelga DS, del Mar Fernadez de Gatta M, Herrera EV et al. Population
475
pharmacokinetic analysis of vancomycin in patients with haematological
476
malignancies. Antimicrob Agents Chemother 2005; 49: 4934-41.
477
35. Llopis-Salvia P, Jiménez-Torres NV. Population pharmacokinetic parameters of
478
vancomycin in critically ill patients. J Clin Pharm Ther 2006; 31: 447-54.
479
36. Ducharme MP, Slaughter RL, Edwards DJ. Vancomycin pharmacokinetics in a
480
patient population: effect of age, gender, and body weight. Ther Drug Monit 1994;
481
16: 513-8.
482
37. Rodvold KA, Blum RA, Fischer JH, et al. Vancomycin pharmacokinetics in
483
patients with varying degrees of renal function. Antimicrob Agents Chemother
484
38. del Mar Fernández de Gatta Garcia M, Revilla N, Calvo MV, et al. A
486
pharmacokinetic/pharmacodynamic analysis of vancomycin in ICU patients. Int
487
Care Med 2007; 33: 279-85.
488
39. Vance-Bryan K, Guay DRP, Gilliland SS, et al. Effect of obesity on vancomycin
489
pharmacokinetic parameters as determined by using a Bayesian forecasting
490
technique. Antimicrob Agents Chemother 1993; 37: 436-40.
491
40. Bauer LA, Black DJ, Lill JS. Vancomycin dosing in morbidly obese patients Eur J
492
Clin Pharmacol 1998; 54: 621-5.
493
41. Blouin RA, Bauer LA, Miller DD, et al. Vancomycin pharmacokinetics in normal
494
and morbidly obese subjects. Antimicrob Agents Chemother 1982; 21: 575-80.
495
42. Rybak M, Lomaestro B, Rotschaefer JC et al. Therapeutic monitoring of
496
vancomycin in adult patients: a consensus review of the Americal Society of
497
Health-System Pharmacists, the Infectious Diseases Society of America and the
498
Society of Infectious Diseases Pharmacists. Am J Health-Syst Pharm 2009; 66:
499
82-98.
500
43. Pea F, Porreca L, Baraldo M, et al. High vancomycin dosage regimens required
501
by intensive care unit patients cotreated with drugs to improve haemodynamics
502
following cardiac surgical patients. J Antimicrob Chemother 2000; 45: 329-35.
503
44. Moise –Broder PA, Forrest A, Birmingham M, Schentag JJ Pharmacodynamics of
504
vancomycin and other antimicrobials in patients with Staphylococcus aureus
505
lower respiratory tract infections. Clin Pharmacokinet 2004; 43: 925-42.
506
45. Wang J, Fang C, Chen Y, et al. Necessity of a loading dose when using
507
vancomycin in critically ill patients. J Antimicrob Chemother 2001; 47: 239-46.
508
46. FIGURE LEGENDS
510
511
Figure 1
512
Plots of model-predicted versus observed concentrations for the final model based
513
on a) population parameter estimates and b) individual parameter estimates.
514
515
516
Figure 2
517
Box and whisker plots of the distributions of vancomycin trough concentrations over
518
the first 4 days of therapy predicted from a) the new dosage guidelines and b) the
519
current dosage guidelines using CL and V1 estimates derived from routine data
520
collected from 100 patients.
521
Table 1: Patient demographic and pharmacokinetic features of the model
524
development and evaluation datasets. Results are presented as number, or
525
median (range).
526
527
Population model
building dataset
Dosage guideline evaluation dataset
Statistical comparison Demographic data
Number of patients 398 100
Males (%) 63 50 p = 0.019
Age (years) 66 (16 – 97) 71 (22 – 91) p < 0.001
Weight (kg) 72 (40 – 159) 65 (35 – 130) p < 0.001
Initial SeCr (mol/L) 98 (30 – 573) 94 (55 – 353) NS
Initial CLCR (mL/min) 64 (12 – 216) 50 (12 – 148) p = 0.003
Pharmacokinetic data
Number of samples 1557 171
Initial dose (mg) 1000 (500 – 1750) 1000 (500 – 1500) NS
Concentration (mg/L) 12.1 (2.0 – 49.2) 12.1 (2.0 – 29.2) NS
Samples per patient 3 (1 – 19) 2 (1 – 5) p < 0.001
Time after start of
infusion (hrs) 11.9 (1.1 – 92.3) 12.4 (0.3 – 57.3) NS
Follow-up period (days) 4.9 (0.5 – 44.4) 2.5 (0.2 – 9.3) p < 0.001
Table 2: Population parameter estimates based on the final population model.
530
531
Population model Final
estimates
RSE %
Bootstrap estimates
95% CI
CL (L/h) 2.99 1.9 2.98 (2.85 - 3.13)
CRCL 0.0154 4.3 0.0154 (0.0144 - 0.0165)
V1 (L/kg) 0.675 1.8 0.676 (0.637 - 0.713)
V2 (L/kg) 0.732 0.7 0.775 (0.543 - 1.090)
Q (h-1) 2.28 23.7 2.25 (1.68 - 2.90)
CL (%) 27 14 27 (24 - 31)
V1 (%) 15 40 15 (8 - 21)
V2 (%) 130 20 125 (88 - 150)
Q (%) 49 29 54 (34 - 81)
Additive error (mg/L) 1.6 7.7 1.6 (1.3 - 1.8)
Proportional error (%) 15 7 15 (12 - 17)
532
Key: CL = typical estimate of clearance for a CLCR of 66 mL/min, CRCL = proportional
533
change in CL with CLCR (calculated using TBW and Cockcroft-Gault equation24), Q
534
intercompartmental CL, = inter individual variability expressed as a percentage,
535
RSE = relative standard error expressed as a percentage coefficient of variation,
536
#(mL/min)
Table 3: Current vancomycin dosage guidelines.
539
540
CLCR (mL/min) Weight <60 kg Weight >60 kg
< 20 1000 mg then sample after 24 hrs 1000 mg then sample after 24 hrs
20 - 29 1000 mg 48 hourly 1000 mg 48 hourly
30 - 49 750 mg 24 hourly 750 mg 24 hourly
50 - 59 1000 mg 24 hourly 1000 mg 24 hourly
60 - 69 500 mg 12 hourly 1000 mg 24 hourly
70 - 79 750 mg 12 hourly 750 mg 12 hourly
80 - 100 750 mg 12 hourly 1000 mg 12 hourly
> 100 1250 mg 12 hourly 1250 mg 12 hourly
541
Key: CLCR estimate based on the Cockcroft-Gault equation24
Table 4: New vancomycin loading dose guidelines based on the final
544
population model.
545
546
Loading Dose
547
Weight < 60 kg 60 – 90 kg >90 kg Loading dose 1000 mg 1500 mg 2000 mg
548
549
550
551
Table 5: New vancomycin maintenance dose guidelines based on the final
552
population model.
553
554
Maintenance Dose
555
CLCR (mL/min) Dose (mg) Interval (hrs)
< 20 500 mg 48 hours
20 - 29 500 mg 24 hours
30 - 39 750 mg 24 hours
40 - 54 500 mg 12 hours
55 - 74 750 mg 12 hours
75 - 89 1000 mg 12 hours
90 - 110 1250 mg 12 hours
>110 1500 mg 12 hours
556
Key: CLCR estimate based on the Cockcroft-Gault equation24. N.B. Higher troughs
557
and lower peaks would be achieved by splitting the total daily dose into 3 or 4 equal
558
portions, for example, 1000 mg 8 hourly instead of 1500 mg 12 hourly or 500 mg 6
559
Table 6: Proportions (%) of predicted vancomycin trough concentrations within
561
different ranges during the first 4 days of therapy.
562
563
Predicted concentration
range
Current guidelines (n =
514 )
New guidelines (n = 688)
Difference in proportion
99% CI of the difference
< 10 mg/L 0.77 (77%) 0.26 (26%) -0.51 -0.44 to -0.57
10 – 15 mg/L 0.19 (19%) 0.55 (55%) 0.36 0.30 to 0.43
15 – 20 mg/L 0.03 (3%) 0.16 (16%) 0.13 0.09 to 0.17
> 20 mg/L 0.00 (0%) 0.03 (3%) 0.03 0.01 to 0.04
564
Key: n = the number of predicted trough concentrations during the first 4 days in the
565
100 evaluation patients.
566
568
569
570
571
572
573
574
575
576
577
578
579
580
581
582
583
584
585
586
587
588
589
590
[image:26.595.135.548.124.565.2]591
592
593
594
96 84
72 60
48 36
24 12
25
20
15
10
5
Time after the start of therapy (hours)
P
re
d
ic
ted c
o
nc
en
tr
at
io
n
(
m
g/
L
)
595
596
597
598
599
600
601
602
96 84
72 60
48 36
24 12
25
20
15
10
5
0
Time after the start of therapy (hours)
P
re
d
ic
te
d c
o
nc
e
n
tr
a
ti
o
n
(m
g
/L
)
[image:28.595.84.545.94.430.2]