Rochester Institute of Technology
RIT Scholar Works
Theses Thesis/Dissertation Collections
2011
An Experiential comparative analysis of two remote
usability testing methods
Erika Varga
Follow this and additional works at:http://scholarworks.rit.edu/theses
This Thesis is brought to you for free and open access by the Thesis/Dissertation Collections at RIT Scholar Works. It has been accepted for inclusion
Recommended Citation
An Experiential Comparative Analysis of Two
Remote Usability Testing Methods
By
Erika Varga
Committee Members
Dr. Evelyn Rozanski
Jill Hewitt
Thesis submitted in partial fulfillment of the requirements for the degree of
Master of Science in Master of Science in Human Computer
Interaction
Rochester Institute of Technology
B. Thomas Golisano College
of
Computing and Information Sciences
Table of Contents
Abstract...vii
Chapter 1. Introduction...1
1.1 Overview...1
Chapter 2. Background...3
2.1 Remote Usability Testing Methods...3
2.2 Prototype Fidelity...4
Chapter 3. Methodology...5
3.1 Treatments...5
3.1.2 Music Prototype...7
3.1.2.1 Tasks...7
3.1.3 Game Prototype...10
3.1.3.1 Tasks...10
3.2 Metrics...12
3.3 Experimental Design...13
3.4 Participant Recruitment...15
3.5 Remote Synchronous Testing Method...16
3.5.1 Materials...16
3.5.1.1 Layout and Structure...17
3.5.1.2 Dynamic Content...18
3.5.1.3 Content Areas...19
3.5.2 Environment...21
3.5.3 Procedure...21
3.6 Remote Asynchronous Testing Method...23
3.6.1 Materials...23
3.6.1.1 Layout and Structure...23
3.6.1.2 Dynamic Content...23
3.6.1.3 Content Areas...23
3.6.2 Environment...24
3.6.3 Procedure...24
3.7 Pilot Tests...25
Chapter 4. Results...27
4.1 Participant Demographics and Experience...28
4.1.1 Demographics...28
4.1.2 Experience with the Internet...28
4.1.3 Experience with HCI...30
4.1.4 Experience with Usability Testing...30
4.1.5 Experience with the Prototype Websites and Content Areas...32
4.1.5.1 Music...32
4.1.5.2 Games...35
4.2 Remote Synchronous Testing Method...37
4.2.2 Tasks...42
4.2.2.1 Time on task...42
4.2.2.2 Task Difficulty Ratings...43
4.2.3 Usability Issues Discovered...44
4.2.4 Prototype...46
4.2.5 Post-session...47
4.3 Remote Asynchronous Testing Method...49
4.3.1 Pre-session...51
4.3.2 Tasks...53
4.3.2.1 Time on task...53
4.3.2.2 Task Difficulty Ratings...53
4.3.3 Usability Issues Discovered...54
4.3.4 Prototypes...55
4.3.5 Post-session...58
Chapter 5. Discussion...59
5.1 Usability Issues ...60
5.2 Limitations and Recommendations...61
5.2.1 Participant Recruitment...61
5.2.2 Uncontrolled Remote Environment...61
5.2.3 Usability Issues...61
5.2.4 Prototype Level of Detail...62
5.2.5 Tasks...62
5.2.6 Technology...62
5.2.7 Total Test Time...63
Chapter 6. Conclusion...64
Acknowledgments...65
References...66
Appendix A. Remote online testing services...69
Appendix B. Heuristic evaluations...70
Appendix C. Participant profiles...76
Appendix D. Usability test materials...78
Appendix E. Music prototype...91
List of Figures
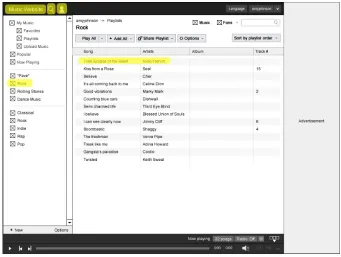
Figure 1: The “Rock” playlist...8
Figure 2: Creating a new playlist from a song in the search results...9
Figure 3: A community member's profile page indicating their listening habits...9
Figure 4: Graphic illustrating how to play a game...11
Figure 5: Inviting a friend to play a game through the “Invite” feature in the chat window...11
Figure 6: Buying a t-shirt for your virtual game character...12
Figure 7: Welcome page layout for the online guide...17
Figure 8: Page layout for pre-test activities, the tasks, and post-test activities...18
Figure 9: A view of the URL variables collected in the survey from the online guide...19
Figure 10: Getting started page...20
Figure 11: Tasks page...20
Figure 12: After the test page...20
Figure 13: Prospective participants that filled out the qualification survey...27
Figure 14: Average number of hours spent per week on various online and offline activities...29
Figure 15: Number of hours on each activity by hours spent online, offline, or both...29
Figure 16: Level of HCI experience...31
Figure 17: Participants who participated in a usability study in the past...31
Figure 18: Number of times participants have participated in usability studies in the past...32
Figure 19: Sources for listening to music...33
Figure 20: Number of music sources per respondent...33
Figure 21: Prospective participants' experience with actual music websites...34
Figure 22: Participants' experience with actual music websites before the RS and RA sessions..35
Figure 23: Types of games played...36
Figure 24: Number of types of games played...36
Figure 25: Prospective participants' experience with actual game websites...37
Figure 26: Satisfaction with the RS activities...39
Figure 27: Level of agreement with statements about the RS method...39
Figure 28: Software used to share the participant's screen, record voice, and record audio in the RS method...41
Figure 29: Participant satisfaction with completing RS pre-session activities...42
Figure 30: Task difficulty ratings in the RS method...43
Figure 31: Level of agreement with statements about the prototype in the RS method...45
Figure 32: Usability issues by severity rating in the RS method...46
Figure 33: Most confusing characteristics of the prototypes in the RS method...47
Figure 34: Participants' level of agreement with the amount of detail in the prototypes in the RS method...48
Figure 35: Participant satisfaction with completing the RS post-session activities...48
Figure 36: Satisfaction with activities in the RA method...50
Figure 37: Level of agreement with statements about the RA method...50
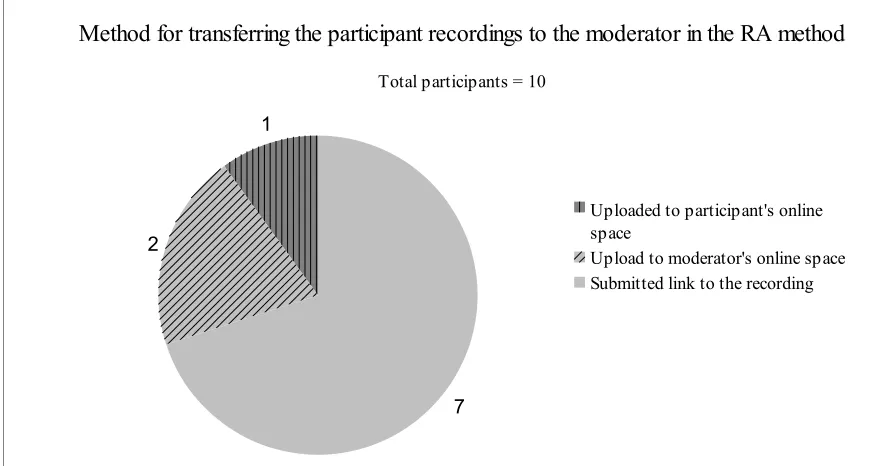
Figure 39: Method for transferring the participant recording to the moderator in the RA method
...52
Figure 40: Task difficulty ratings in the RA method...54
Figure 41: Level of agreement with statements about the prototype in the RA method...56
Figure 42: Usability issues by severity rating in the RA method...56
Figure 43: Most confusing characteristics of the prototypes in the RA method...57
Figure 44: Participants' level of agreement with the amount of detail in the prototypes...57
List of Tables
Table 1: Within-subjects experimental design...13
Table 2: Participant testing sequences and task counterbalancing...14
Table 3: Prospective participant profiles...15
Table 4: Participant testing sequences for pilot tests...26
Table 5: Actual participant profiles...28
Table 6: Time to complete each part of the RS method (minutes)...38
Table 7: Time on task in the RS method (seconds)...42
Table 8: Non-unique usability issues discovered in the RS method...44
Table 9: Time to complete each part of the RA method (minutes)...49
Table 10: Time on task in the RA method (seconds)...53
Abstract
An Experiential Comparative Analysis of Two Remote Usability Testing Methods Erika Varga
Chapter 1. Introduction
Remote usability testing is a key tool for usability professionals. Various remote methods exist and it is often difficult to choose the appropriate method. Testing lower-fidelity prototypes often present unique problems because they provide minimally aesthetic and minimally
interactive partial representations of a final product.
Traditional laboratory testing requires that participants travel to the same location as the moderator. Participants’ image and voice are typically recorded as he or she uses the apparatus being tested in a controlled environment. While the researcher is able to control the environment to mitigate confounding variables, traditional laboratory testing is time consuming and
expensive. As work becomes increasingly spread across the globe, quick and inexpensive methods are needed to conduct effective usability testing.
The objectives of this study were to understand how the absence of a moderator in remote usability testing influences the quantity, type, and severity of usability issues discovered,
participant experience, and interaction with low-fidelity prototypes. Another objective of this study was to pilot an online version of traditional, laboratory test documents.
This study report is divided into several chapters: In Chapter 1 an overview of the problem and reason for conducting this study is described, followed by Chapter 2 where related work and definitions in remote usability testing and prototype fidelity are presented. The methodology is presented in Chapter 3. The results are presented in Chapter 4, followed by a discussion comparing the two remote methods in Chapter 5, limitations and recommendations for future work in Chapter 6, and concluding remarks in Chapter 7.
1.1 Overview
Usability testing has become a popular tool for collecting valuable feedback to improve software interfaces. Traditionally testing takes place in a laboratory where the usability
tasks and survey questions. If a participant is lost during a task, or is unsure about the steps required to complete the test, the moderator is there to provide guidance. This type of test also occurs in a structured environment where the researcher is able to control almost every aspect of the environment in order to prevent extraneous influences from muddling study integrity.
Having another person nearby when testing lower-fidelity prototypes is particular helpful when participants encounter problems. The moderator is able to clarify any misconceptions or confusion about the website being tested or how the prototype was built. There is almost no wait time in a laboratory test between participant questions and moderator guidance because the test occurs in real-time. Laboratory testing also affords the moderator additional sources of feedback. The moderator can pair verbal participant responses with body movement, gestures, and vocal expressions.
Usability professionals collect feedback from audiences with different cultures, physical abilities, and experiences. The globalization of work has meant that usability professionals create software user interfaces for target audiences that do not live within a reasonable distance from the moderator where lab testing might occur. Participants in different cities, states, countries and timezones would not be able to travel to a lab to complete the usability test and alternative usability testing methods are required to accommodate the physical dispersion of participants. Participants testing lower-fidelity prototypes have varying degrees of interactivity and aesthetics may require extra assistance to understand intentional functionality and not to confuse prototype snafus with usability issues.
This pilot study is a qualitative and semi-quantitative experiential discussion of how two remote methods affect usability issues discovered and participants' satisfaction with their
usability testing experience. The following research questions will be answered in this study:
• How does the remote usability testing method influence the quantity, type, and severity of usability issues discovered in a low-fidelity prototype?
• How much time and assistance is required to conduct a remote usability testing?
• How does the testing method impact the participant experience?
Chapter 2. Background
A review of recent literature was conducted to understand remote usability testing methods and prototype fidelity to frame the methodology for this study.
2.1 Remote Usability Testing Methods
Remote usability testing can take place synchronously (RS) or asynchronously (RA). In RS testing the moderator is separated spatially from participants and the test is typically
conducted in real-time. Andreasen et al. (2007) simulated a RS environment by having
participants visit their usability lab and communicate with the moderator in a separate room via Internet phone and screen sharing. Thompson et. al. (2004) and Castillo et. al. (1996) test participants in their own working environment. RA testing on the other hand separates the moderator from the participant in both space and time (Andreasen et al, 2007; Bruun et al, 2009; Brush et al., 2004; Castillo et al., 1996; Tullis et al., 2002; Petrie et al., 2006). Three of the eight studies with remote testing methods used RS testing (Thompson et al., 2004; Castillo et. al. 1996; Brush et. al., 2004) and four of the eight studies used RA methods (Bruun et. al., 2009; Hartson et. al., 1998; Tullis et. al., 2002; Petri et. al., 2006) (excluding Andreasen et. al., 2007). Of all eight studies conducting remote testing, only one compares both RA and RS testing methods (Andreasen et al, 2007). Testing is done in the lab in each study as either a control or as the basis for comparing it to remote methods.
The common way to conduct the RS tests was with video and audio recordings of the participants’ screen while completing tasks (Thompson et. al., 2004; Walker et. al., 2002; Bruun et. al. 2009; Castillo et. al. 1996; Tullis et. al. 2002). RA testing methods included longitudinal diaries, “user reported critical incidents”, online forums, and online questionnaires (Andreasen et al, 2007; Bruun et. al. 2009; Hartson et. al. 2004; Tullis et. al., 2002).
the computer screen which contains a survey with tasks to guide the user and gather user
feedback, and a second, larger browser window below the narrow window that contains the UI to be tested. The Tullis et. al. (2002) method is free compared to those more expensive tools listed in Appendix A and only requires computer programming knowledge.
2.2 Prototype Fidelity
Prototypes are a means of communicating design ideas with designers, development teams, and various stakeholders and can be used to discover usability issues (Rudd et. al., 1996). Prototypes range from sketchy interpretations with limited functionality to glimpses of the final product with near-complete functionality and aesthetics. Lower fidelity prototypes are typically used at the beginning of the design process to facilitate idea generation, while higher-fidelity prototypes are used toward the end of the design process to test the usability of a near-complete system. While usability testing is typically found near the middle and end of the design process, it can be performed with low-fidelity prototypes in a more limited manner. Different forms of low-fidelity prototypes can be tested, such as paper prototypes, wireframe mockups, and minimally aesthetic mockups. Low-fidelity prototypes typically need more explanation than higher-fidelity prototypes (Rudd et. al., 1996). Only two of the studies in the literature review varied the fidelity of the prototypes tested (Lim et. al., 2006; Walker et. al., 2002). Of these two studies, neither studied remote usability testing.
Chapter 3. Methodology
A review of recent literature indicates that usability researchers have focused on
comparing remote methods to traditional lab methods using a high-fidelity prototype with higher interactivity and aesthetics or a low-fidelity prototype with minimal interactivity and/or
aesthetics. Due to a lack of investigation comparing remote RS and RA methods using low-fidelity prototypes, this pilot study has been conducted to gain insightful qualitative feedback about RS and RA remote usability testing methods. This is also an exploration into the creation of a remote tool that can be used to administer remote tests and guide the moderator and
participants.
Thirteen participants completed a remote RS and RA usability test using two low-fidelity prototypes of actual game and music websites. An online guide was used by both the participant and moderator to administer the test and collect all data. Lab testing was not conducted because similar research shows conflicting results and comparisons between laboratory and remote usability testing. Moreover, limited time was available to complete the study.
3.1 Treatments
Two similar websites with similar interaction techniques will be used as the basis for the prototypes. Grooveshark (Escape Media Group, 2011) and Omgpop (Omgpop, 2011) provide a highly interactive, online experience and are good examples of “Web 2.0” type websites that use collective, user information, value user control over their information, value control above the level of a “single device”, and are services instead of software (O'Reilly, 2005).
Grooveshark and Omgpop were selected based on their wide appeal to the available participant pool and heuristic evaluations using Nielsen's 10 usability heuristics indicate that each website had several existing usability issues (Nielsen, 2010b) (Appendix B). Grooveshark and Omgpop were selected to guarantee that enough data is gathered to compare the RS and RA remote testing methods.
The website is a service where users can access their music across Internet capable devices. Users can interact with other users on the site by sharing their music listening habits with others.
Omgpop is a free and highly interactive online game website. The website is also an online service like Grooveshark, where users can access the site and play games with other users on any Internet capable device. Members can play games with each other and compete for status by collecting “coins” and achievement medals. With these coins and medals members buy virtual items for games. The website allows for social interaction through user-created chat rooms and one-on-one messaging. Members can add friends to a friend list and initiate games with them.
These websites are the basis for the two low-fidelity prototypes based on a heuristic evaluation which indicates there are several existing usability issues (Appendix B: Figures 1-2). Each prototype contained functionality focused solely on the scope of the tasks. The key
functionality captured in the prototypes includes:
• Grooveshark.com: Search for songs, save songs for future listening, listen to songs, get information on other listeners’ listening habits
• Omgpop.com: Play games with friends, learn to play games, find friends, communicate with friends, and customize game play
The prototype for each website has similar characteristics:
• Shows broad concepts (navigation, content areas, information architecture), less
important text will be replaced by place holder graphics (square with an “X” through the middle)
• Black lines with monochrome shades of black
• Drawn with vector graphics on a computer using Adobe Fireworks software (Adobe, 2011b)
• Minimal shading and gradients, no photographic images (Illustrations replaced with placeholders)
• Some intricate icons taken exactly as they are from the actual site, other icons are re-created
• Click through interaction (The user can interact with certain elements by clicking on them, which takes them to another page.)
• Dynamic results to users' actions are represented as scripted choices. In some cases search terms are already entered in the prototype based on the tasks. In other cases, a “usability test message” will display which indicates the user has a choice or that some action is taking place. In the actual website, these user choices or actions would actually be handled dynamically and automatically by the system (Appendix E: Figures 4, 6, and 7).
Both prototypes were created by designing the static wireframes in Adobe Fireworks and then made interactive using the inVision App website (InVision App, 2011). Static wireframes were exported as images from Fireworks and then uploaded to the inVision App website tool where clickable links were added to each page in order to link them together.
3.1.2 Music Prototype
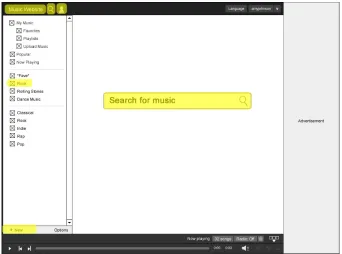
Once a heuristic evaluation was conducted for Grooveshark, tasks were created for the website. The following section describes the prototype and accompanying tasks as it was created around the key functions of the website. The tasks described below are exactly as they appeared in the online guide. A total of seventeen images were used to create the entire prototype
(Appendix E: Figures 1-17). Images were linked together using clickable URLs. The only type of interaction afforded the participant was clicking on these URLs and navigating through the “pages”. A working version of the music prototype can be found at http://invis.io/PQ2HFSR/.
3.1.2.1 Tasks
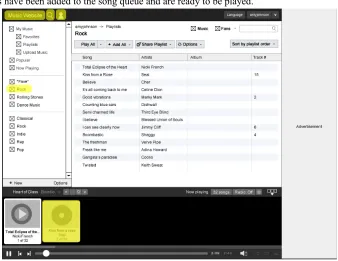
indicating the song had played. Success for this task was measured by whether the participant played the two songs in the “Rock” playlist.
Task 2: “Search for the song, 'King for a Day,' by Green Day and add it to a new playlist called 'Green Day Favorites'”. The participant is asked to search the website for a particular song and add it to a newly created playlist (Figure 2). In the prototype the participant is able to run through the motions of finding the song and creating a playlist, but the prototype does not actually create the playlist nor save the song to it. Success is measured by the participant hitting the “Create” button to finish creating a new playlist.
[image:16.612.130.484.363.614.2]Task 3: “Your friend 'bmetal' also uses this website. Find out what he has listened to recently.” The participant is asked to search the community of members for a person called “bmetal” (Figure 3). To determine what “bmetal” has listened to, the participant is expected to navigate to this person's profile page to find out what they have listened to recently. Success for this task is measured by the participant finding “bmetal's” profile page and finding the status messages on the profile page indicating what they've listened to recently.
Figure 2: Creating a new playlist from a song in the search results
3.1.3 Game Prototype
Once a heuristic evaluation was conducted for Omgpop, tasks were created for the website. The following section describes the prototype and accompanying tasks as it was created around the key functions of the website. A total of fifteen individual images were used to create the entire prototype (Appendix F: Figures 1-15). Images were linked together using clickable URLs. The only type of interaction afforded the participant was clicking on these URLs and navigating through the “pages”. A working version of the music prototype can be found at http://invis.io/KC2VEEZ/.
3.1.3.1 Tasks
Task 1: “Learn how to play the Bomber Guy game”. The participant is asked to find particular information on how to play the Bomber Guy game (Figure 4). The participant should find the Bomber Guy game and the page that has a graphics illustrating game play. Success is measured by the participant finding this page.
Task 2: “Find your friend 'john86' and start a game of Bomber Guy with him.” The participant is asked to navigate to the Bomber Guy game screen where they queue up to play the game with other members. The participant must click the “Play” button to navigate to this screen. Once there, the participant must either copy and paste an invitation link to the game in a chat window to “john86” or the participant must hit the “Invite” button in the chat window (Figure 5). Success is measured by whether the participant can copy and paste this link or invite them via the chat window.
Figure 4: Graphic illustrating how to play a game
Figure 6: Buying a t-shirt for your virtual game character
3.2 Metrics
A mix of qualitative and quantitative metrics were used to compare the RS and RA remote testing methods. The following metrics will be collected to answer the research questions:
• Qualitative
◦ Usability issue type (as discovered from the data, ex. “unclear meaning or label”) (Lim et. al., page 297, 2006; Brush et al., 2004; Walker et. al., 2002; Petrie et al., 2006; Brush et al., 2004; Andreasen et al, 2007)
◦ Usability issue severity rating (using Nielsen’s (2010) severity rating scale) (Petrie et al., 2006; Brush et al., 2004; Andreasen et al, 2007; Bruun et al., 2009)
• Quantitative
◦ Number of usability issues (Lim et. al, 2006; Petrie et al., 2006; Brush et al., 2004; Walker et. al., 2002; Petrie et al., 2006; Brush et al., 2004; Andreasen et al, 2007; Bruun et al., 2009)
◦ Moderator and participant time on setup/pre-test, time on task, and post-test (Moderator time starts when the moderator administers pre-test materials and questionnaires and ends when the moderator completes the post-test wrap up.
Participant time starts when the participant begins the pre-test questionnaire and ends when the participant completes the post-test wrap up.) (Bruun et al., 2009)
Using both qualitative and quantitative metrics will provide a more holistic view of the participant experience with the prototypes in each of the remote settings. The number of usability issues, test time, usability issue type, and usability issue severity will help determine whether each of the scenarios produce the same results. The participant experience data will help
determine how those involved feel about the methods and how they fit into the participants’ own context (ex. easy to use while working from home office).
3.3 Experimental Design
This study is a 2 x 2 factorial design where the independent variables are remote testing method and website tested (Table 1). The dependent variables are a mix of qualitative and
quantitative data that focuses on usability issues discovered, time required to conduct testing, and moderator and participant experience.
Table 1: Within-subjects experimental design
RS Method RA Method
The experimental design is a within-subjects design and comparisons will be made using descriptive statistics and qualitative analysis. Table 2 describes which prototype and remote method each participant will test and the sequence of tasks. Each participant completed a usability test with the RS and a usability test with the RA method. The researcher was the moderator for the RS method only and participants used a self-guided approach for the RA method.
Table 2: Participant testing sequences and task counterbalancing
Session 1 Session 2
Participant Prototype Remote method Task 1 Task 2 Task 3 Prototype Remote method Task 1 Task 2 Task 3
1 music sync 1 2 3 game async 1 2 3
2 music sync 2 3 1 game async 2 3 1
3 music sync 3 1 2 game async 3 1 2
4 game async 1 2 3 music sync 1 2 3
5 game async 2 3 1 music sync 2 3 1
6 game async 3 1 2 music sync 3 1 2
7 music sync 2 3 1 game async 2 3 1
8 music sync 1 2 3 game async 1 2 3
9 music sync 3 1 2 game async 3 1 2
10 game async 2 3 1 music sync 2 3 1
11 game async 1 2 3 music sync 1 2 3
12 game async 3 1 2 music sync 3 1 2
13 music async 1 2 3 game sync 1 2 3
14 music async 2 3 1 game sync 2 3 1
15 music async 3 1 2 game sync 3 1 2
16 game sync 1 2 3 music async 1 2 3
17 game sync 2 3 1 music async 2 3 1
18 game sync 3 1 2 music async 3 1 2
19 music async 2 3 1 game sync 2 3 1
20 music async 1 2 3 game sync 1 2 3
21 music async 3 1 2 game sync 3 1 2
22 game sync 2 3 1 music async 2 3 1
23 game sync 1 2 3 music async 1 2 3
3.4 Participant Recruitment
Participants were screened for particular characteristics to ensure they met the following requirements:
• Age 18 to 52
• General knowledge of and experience with the Internet
• No previous experience with the specific prototypes
• General knowledge of the subject matter presented in the prototypes The full participant profiles are described in Table 3.
Table 3: Prospective participant profiles
Generic characteristics
Age 18-52
Education Currently enrolled in a 4-year, undergraduate degree at RIT
Relevant characteristics
Computer use Experienced web user
Subject matter experience (with music and games)
General knowledge of the concepts and similar websites/experiences
Experience with Grooveshark.com and Omgpop.com
None
Experience with human-computer
interaction Little to no experience
Participants were recruited from the Golisano College of Computing and Information Sciences student population at Rochester Institute of Technology in Rochester, New York and from the researcher's online social networks. Inquiries for participant involvement were posted to Facebook (Facebook, 2011) and Twitter (Twitter, 2011).
An email was sent to all Golisano students with a summary about the two usability tests inquiring about prospective participants (Appendix D: Figure 1). A link to the qualification survey was included in the email to screen prospective participants (Appendix D: Figure 2). The qualification survey was created and stored on the SurveyGizmo website (Widgix, 2011).
online in order to find more participants. Anyone interested was instructed to fill out the qualification survey and sent a link via either email or online instant messaging. Students who met the study's qualifications were emailed instructions to complete both sessions. Two participants each completed an RS and RA pilot test to ensure the study’s methodology was sound and that adequate resources existed.
3.5 Remote Synchronous Testing Method
The following section describes the methodology used for the RS session. The materials used to guide the participant and moderator, and method for collecting qualitative and
quantitative data are discussed first. Next, the environment where the participant and moderator completed the usability test is described, followed by the procedure for completing the usability test.
3.5.1 Materials
3.5.1.1 Layout and Structure
A simplistic, pre-made blog theme was used to provide the underlying layout (Fiegel, 2011). The theme was modified to act like a wizard, where a set of instructions must be
completed in a certain order to reach an end goal. Each page had the title of the study at the top of the page along with the type of method for the session (Area designated as number 1 in Figures 7 and 8). Each page also had the same navigation with a link to each page of the guide (Area designated as number 2 in Figure 7 and 8). Each page also had a large, main content area to place all the information for each step of the usability test (Area designated as number 3 in Figure 7 and 8).
Figure 7: Welcome page layout for the online guide
The guide consisted of four main pages which align with the main parts of a usability test: Welcome, Get started, The Tasks, and After the test. The Welcome page introduced the
Figure 8: Page layout for pre-test activities, the tasks, and post-test activities
3.5.1.2 Dynamic Content
A login page was created using the Wordpress plugins, “Custom Login Page,” (Chia, 2011) and “Members Only” (Hamilton, 2011). Participants authenticated with their email address and a password set by the researcher to view the online guide. A participant's unique ID number was used as a variable in the PHP and HTML code to dynamically display content on the page (tasks, prototype link) and to submit information about himself, the prototype, and his survey responses.
The tasks and link to the prototype were dynamically displayed on the page based on the participant that logged into the online guide using PHP. Information about the participant, prototype, and method was collected by the surveys using dynamically created URLs to the surveys in the online guide. For example, when a user logged in, a link to the “Pre-session” survey was displayed in the guide using PHP variables, which sent information about the session to the survey: http://edu.surveygizmo.com/s3/505900/presession?
method=sync&user_id=1&website=music/.
Figure 9: A view of the URL variables collected in the survey from the online guide
3.5.1.3 Content Areas
The guide was broken into four main parts: Welcome, Get Started, The Tasks, and After the Test. Each of the four parts was then divided into sub-steps. The sub-steps were shown and hidden using a collapsing menu that only showed one step at a time. The first page, “1. Get Started,” was divided into five sub-steps: “Submit the consent form”, “Fill out the pre-session survey”, “Perform a think aloud example”, “Open the prototype”, and “Share the participant's screen” (Figure 10).
The second page, “2. Tasks,” was divided into 3 sub-steps: “Task 1”, “Task 2”, and “Task 3” (Figure 11). Instructions were printed at the top of the page reminding the participant to think aloud. A message was displayed that the moderator would start recording audio and video.
Figure 10: Getting started page
The RS online guide can be visited at http://www.xune.net/guides/sync/ using a username of “participant” and a password of “sync123”.
3.5.2 Environment
The moderator was located in an HCI Lab in the Golisano College of Computer and Information Sciences at Rochester Institute of Technology in Rochester, New York or the researcher's home in Rochester, New York, depending on convenience and access to adequate Internet connection speeds.
Participants completed the RS session in a location of their choice and had access to different environments and types of computer software and hardware. Eleven participants completed the RS session from home and the remaining two completed the session at school. Ten participants completed the RS session in a quiet, home environment and at least five of these participants were the only ones in the room.
Ten participants used a laptop to complete the RS session and three participants used a desktop computer. Nine of the thirteen participants used a computer whose screen ranged from “13 to 18 inches”. The remaining four participants had a computer screen size less than thirteen inches or greater than eighteen inches. Participants used their computers for a wide range of reasons: school and entertainment (five participants), only entertainment (two participants), and school, work, and entertainment (two participants).
3.5.3 Procedure
The participant received an email with instructions for completing the RS session
(Appendix D: Figure 5)1. The email indicated when the moderator would call the participant. For
participants completing the RS session first, the participant was instructed to complete the informed consent form and download the Skype program for communicating with the moderator and sharing their screen (Appendix D: Figure 7). The consent form could be uploaded to a
1 The participant indicated on the qualification survey when they were available to complete the RS session. This date and time was indicated on the email with session instructions. If the participant did not indicate their
survey. The email included a link to the online test guide with details on the participant's user name required to log into the secured website for the online guide.
On the day of the test, the moderator called the participant's mobile phone using Skype (Skype Limited, 2011) or a mobile phone. If the participant was willing, both moderator and participant used Skype for communicating. The moderator instructed the participant to visit the online guide to use throughout the session. The moderator then introduced the study and session to the participant and instructed the participant to read and sign a consent form if they had not already done so as instructed in the set of instructions emailed to them. Next the participant was asked to perform a thinking aloud example.
Participants were encouraged to use the think-aloud protocol as they completed the three tasks. Participants were asked to indicate when they had started and completed each task. Time on task is defined as the time from when the participant starts reading the task aloud and says “Done,” or a phrase indicating completion (for example, “I think that's what I'd do to complete the task.”).
The participant shared their screen with the moderator using Skype or IBM LotusLive (IBM, 2011) as they completed three tasks in the prototype. The moderator recorded the participant's screen and the audio conversation using a 30-day trial of Camtasia (Techsmith, 2011), Camstudio (RenderSoft, 2011), or VodBurner (Netralia Pty Ltd, 2011). After completing the tasks, the participant completed a post-session survey. The moderator’s voice was also recorded using Camtasia. The participant completed three tasks and logged the task difficulty rating for each task (Appendix D: Figure 9). The online guide displayed the tasks for the
particular participant completing the session based on the information used to gain access to the online guide. After the participant responded to the task difficulty rating survey, the moderator asked any questions applicable to the task.
After completing the three tasks, the participant completed a post-session survey which collected information about the prototype and remote method used in the session (Appendix D: Figure 10). If it was the participant's second session, additional questions appeared in the survey asking the participant to compare his or her experience using both prototypes and remote
methods. If the RS session was the participant's first session, the moderator gave verbal
also verbally gave the password for the RA online guide to the participant. The time to complete the post-session activities is defined as the time in seconds from the participant rated Task 3 or when the moderator finished asking questions about Task 3 to the end of the session.
3.6 Remote Asynchronous Testing Method
The following section describes the methodology used for the RA session. First the materials used to guide the participant and moderator and method for collecting qualitative and quantitative data is discussed. Next, the environment where the participant and moderator completed the usability test is described, followed by the procedure for completing the usability test.
3.6.1 Materials
An online test guide was created for the RA session similar to the guide created for the RS session to direct the moderator and participant through the usability test. Both guides were created to be as similar as possible with the intention that the participant in the RA session would perform all or most of the same actions as those experienced when completing the RS session. The differences in the RA session online guide are described below.
3.6.1.1 Layout and Structure
The layout and structure in the online guide for the RA method was the same as the RS method.
3.6.1.2 Dynamic Content
Dynamic content in the online guide for the RA method was the same as the RS method.
3.6.1.3 Content Areas
The second page, “2. Tasks,” was the same for the RA method as it was for the RS method, except that the instructions at the top of the page reminding the moderator to record the session was replaced by instructions reminding the participant to start recording his or her screen.
The third page, “3. After the test,” was the same for the RA method as it was for the RS method, except that there was an additional section (Section 1) instructing the participant to stop the recording and how to submit it to the moderator.
The RA guide can be visited at http://www.xune.net/guides/async/ using a username of “participant” and a password of “async456”.
3.6.2 Environment
There was no moderator for this session. Eight participants completed the RA session at home, one at school, and two at work. Eight participants completed the RA session in a quiet, home environment and at least six participants were the only person in the room.
Eight participants used a laptop to complete the RA session and three participants used a desktop computer to complete the RA session. Nine participants used a computer whose screen ranged from “13 to 18 inches” and three participants had a computer screen size smaller than thirteen inches or larger than eighteen inches.
Participants used their computers for a wide range of reasons: school and entertainment (three participants) and school, work, and entertainment (three participants).
3.6.3 Procedure
participant submitted the pre-session survey and the session end time is when the participant submitted the video recording to the moderator. The total video time is subtracted from the total session time to calculate the time when the session was not recorded. An accurate time when the participant started and stopped the recording cannot be determined, so a range of time is
proposed as the possible max amount of time that the pre-session could have occurred.
3.7 Pilot Tests
Two pilot tests were conducted to discover any issues with the usability test
methodology. An RS and RA session for both the music and game prototypes was tested (Table 4). The first pilot test with Participant 1 was run on May 5, 2011 from 6:50 PM to 7:53 PM. Several issues were discovered from this RS pilot test with the music prototype:
• Two links in the online guide were not working: “Click here to begin” on the Welcome page and the link to open the page to upload the consent form
• The participant had to install the screen sharing program during the test which took about 5 extra minutes of test time. Instead, pre-requisite software should be downloaded before the participant starts the RS session.
• There were no questions in the post-session survey about the type of environment the participant was located in during the session. These questions should be added to the post-session survey.
• The participant was confused by seeing “What did you like least about...”before
questions asking “What did you like most about...” The participant expected the questions asking what was liked most to appear first. These types of questions should be reversed.
• The participant stressed the point that she would have liked to have been able to navigate through more of the prototype by being able to click links. The prototype was left as is, since the intention of this type of low-fidelity prototype is to make only certain parts interactive.
Table 4: Participant testing sequences for pilot tests
Session 1 Session 2
Participant Prototype Remote method Task 1 Task 2 Task 3 Prototype Remote method Task 1 Task 2 Task 3
1 music sync 1 2 3 game async 1 2 3
2 game async 1 2 3 music sync 1 2 3
The second RS pilot test was run on May 15, 2011 from 9:30 PM to 10:30 PM. Several issues were discovered from this RS pilot test with the game prototype:
• At the time of the pilot test, Microsoft SharedView (Microsoft, 2011) was planned to have the participant share their screen. Participant 2 had a Mac OS and could not run the Windows only SharedView application. It is important to ensure that any usability test software works for all participants.
Participant 2 also noted several issues with the RS method:
• The participant had trouble using ScreenCastle to create an audio/video recording file. After completing the RA session and having run the recorder during the session, the participant stated that the recorder locked up and would not produce the final file. Software chosen for the usability test should work for all participants2.
Chapter 4. Results
Participants were recruited between May 6, 2011 and June 29, 2011. 416 people attempted the qualification survey. The response rate for the qualification survey was close to 39% (actual 38.94%). Thirteen people were successfully recruited and completed the study (Figure 13). All other respondents did not qualify or were no longer interested in participating in the study.
Figure 13: Prospective participants that filled out the qualification survey
People that attempted the survey were those who did not submit the survey using the “Submit” button on the final page of the survey. Those who had submitted the survey in this way were considered to be those who “Completed” the survey. Qualifying respondents must have
“Completed” the survey and also met the conditions to participate in the study (See Methodology for participant qualification requirements). Participants that successfully “completed the study” were those who “qualified for [the] study” and also completed at least one of the two usability test sessions (Table 5). RS and RA usability testing was conducted between May 23, 2011 and July 9, 2011.
Attempted qualitifcation survey
Completed
qualification survey Qualified for study Completed study 0 50 100 150 200 250 300 350 400 450 416 162 153 13
Prospective participants that filled out the qualification survey
Table 5: Actual participant profiles
Generic characteristics
Age 18-52
Education Currently enrolled in a 4-year, undergraduate degree at RIT,
currently enrolled in a 2+ year graduate degree at RIT, or previously graduated within the past 5 months from RIT
Relevant characteristics
Computer use Experienced web use
Subject matter experience (with music and games) General knowledge of the concepts and similar websites/experiences
Experience with Grooveshark.com and Omgpop.com None
Human-computer interaction experience Little to no experience or experienced
4.1 Participant Demographics and Experience
Information was collected on each participant to ensure they met the study's criteria (Appendix C).
4.1.1 Demographics
Eleven participants were between the ages of “18 and 35” and two participants were between the ages of “36 and 52”. Seven participants were graduate students and the remaining six were undergraduate students. There were no participants younger than seventeen or older than fifty-two. No participants indicated they required assistive technologies to complete the study.
4.1.2 Experience with the Internet
Figure 14: Average number of hours spent per week on various online and offline activities
Figure 15: Number of hours on each activity by hours spent online, offline, or both
5.9 1.0 5.7 4.4 11.8 1.5 11.6
"How many hours do you spend on the following activities a week?"
Number of respondents = 13
Playing games Programming
Searching for information / researching:
Editing / creating graphics or videos
Listening to music
Shopping for items / selling items Studying / reading / writing
Programm
ing Shopping or selling Creating graphics or videos
Searching for info, research
Playing
games Studying, reading, writing Listening to music 0 20 40 60 80 100 120 140 160 180
"How many hours do you spend on the following activities a week?"
Number of respondents = 13
4.1.3 Experience with HCI
Participants had varying degrees of experience with HCI concepts and practices, such as human factors, usability testing, and usability engineering. Nine participants had little to no experience with HCI (Columns “No experience”, “Heard topics”, and “Read topics”, Figure 16). Two people with little to no experience had been involved as a usability test participant in the past, but this involvement is not considered as HCI experience, because no understanding of the HCI process is required, other than being able to produce applicable feedback for the usability test. Four participants were either studying HCI as a graduate student, working in an HCI field, or both studying and working in an HCI field. This group of participants had far more experience than those with little to no experience.
4.1.4 Experience with Usability Testing
Seven participants reported they had participated in at least one usability study in the past, while the other six participants reported they had not (Figure 17). Six of the seven
participants who participated in a usability test in the past, indicated they had done so one to five times (Figure 18). The seventh person had been a participant in five to ten usability tests. No one who had been a participant in the past had done so more than ten times.
Notes about Figure 19.”No experience” = Participant has not heard about HCI, read HCI topics, taken HCI courses, worked toward or completed an HCI degree, worked as an HCI professional. “Heard topics” = Participant has heard about HCI topics. “Read topics” = Participant has read about HCI topics on their own time. “Studying HCI” = Participant has completed or is working toward an HCI-related degree. “HCI professional” = Participant who works in an HCI-related field. “Studying HCI and is a professional” = Participant has completed or is working toward an HCI-related degree and is also working as an HCI professional
Figure 17: Participants who participated in a usability study in the past Figure 16: Level of HCI experience
No experience Heard topics Read topics Studying HCI HCI
professional Studying HCI and is a professional 0 1 2 3 4 5
6 Level of HCI Experience
Has been in a usability test participant in the past
Has never been in a usability test participant
Experience with HCI
N um be r o f r es po nd en ts Yes No 5 6 7 8 7 6
Have you participated in a usability study in the past?
Number of respondents = 13
Figure 18: Number of times participants have participated in usability studies in the past
4.1.5 Experience with the Prototype Websites and Content Areas
To assess whether prospective participants had used the prototypes in this study,
participants were asked how frequently they visited music and game websites in the past month3.
Participants were also asked what types of sources they use to listen to music and what types of games they play.
4.1.5.1 Music
Participants used multiple sources to listen to music in the month leading up to the usability tests (Figure 19). The most used sources for listening to music include streaming music websites, digital devices, AM/FM radios, and music stored locally on a computer. Satellite radio was the least used (one participant). Many participants used a combination of these sources (Figure 20). All twelve (one participant did not complete the pre-session survey assessing their music experiences) respondents used between three and six different sources to listen to music.
3 “Past month” is defined as the last 30 days from the time the participant completed the qualification survey and may vary by participant.
1-5 times 6-10 times 11-15 times 16-20 times 20+ times 0
1 2 3 4 5 6 7
6
1
0 0 0
"How many times have you been a participant in a past usability study?"
Number of respondents = 7
N
um
be
r
of
r
es
p
on
de
nt
Figure 19: Sources for listening to music
Figure 20: Number of music sources per respondent
5 1 4 5 5 5 2
"What sources do you use to listen to music?"
Number of respondents = 12
Stream online (on demand) Satellite radio
Online radio AM/FM receiver
Music stored locally on my computer Digital device (iPod, iPhone, Zune, etc.)
CDs, cassette tapes, vinyl
0 sources 1 source 2 sources 3 sources 4 sources 5 sources 6 sources 7 sources 0 1 2 3 4 5
0 0 0
2 2
4
2
0
"What sources do you use to listen to music?"
Number of respondents = 12
All thirteen prospective participants at the time of the qualification survey had not used Grooveshark in the past month, the website that is the basis for the music prototype (Figure 21). Pandora was visited by eleven participants at least once in the past month, which is the most frequented among all the music sites surveyed. Last.FM, free.napster.com, and AOL Music were also visited by at least one participant in the past month. No other music sites were visited in the past month.
Actual music usage was also assessed at the time they completed either the RA or RS session using the same question that appeared in the qualification survey (Figure 22). One
participant did not fill out the pre-session survey and is not included in this assessment. Since the time of the qualification survey, participants visited several additional music sites: eMusic, Yahoo! Music, Slacker radio, and Myspace music. No participant had listened to Grooveshark.
Figure 21: Prospective participants' experience with actual music websites
Never 1-10 11-20 21+
0 2 4 6 8 10 12 14
"How many times have you used these streaming music websites in the past 1 month?"
Number of respondents = 13 AOL Music
Emusic.com Free.napster.com Grooveshark Last.FM Maestro.fm Mog Myspace Pandora Rhapsody Slacker
Frequency of use
Figure 22: Participants' experience with actual music websites before the RS and RA sessions
4.1.5.2 Games
Participants play various types of games (Figure 23). Puzzles, role-playing games (RPGs), board games, and racing games were most played in the month leading up to the usability study. Puzzle games are played by most participants (twelve participants) and other types of games such as arcade and visual novel are played by only two participants. Nine
participants played between four and five different types of games (Figure 24). Two participants played less than three types and three participants played five to six types of different games.
All thirteen participants at the time of the qualification survey had not used Omgpop, the website that is the basis for the game prototype, in the past month (Figure 25). Armor Games, Bing games, Candystand, Games.com, Kongregate, Miniclip, Pogo, Popcap, Shockwave, and Yahoo! Games were all visited between one and ten times by at least one participant within the past month. At least one participant visited Games.com, Miniclip, Popcap, and Shockwave between eleven and twenty times in the past month. Gameforge was the only other website not visited by any participants.
Never 1-10 11-20 21+
0 2 4 6 8 10 12
"How many times have you used these streaming music websites in the past 1 month?"
Number of respondents = 12 AOL Music
Emusic.com Free.napster.com Grooveshark Last.FM Maestro.fm Mog Myspace Pandora Rhapsody Slacker Yahoo! Music
Freuqency of use
Figure 23: Types of games played
Figure 24: Number of types of games played
8 3 4 4 6 12 6 2
"What types of games do you play?"
Number of respondents = 13
Role playing (RPG) First person shooter (FPS) Real time strategy (RTS) Sports
Racing Puzzles Board games
Other = Arcade, Visual Novel
0 types 1 types 2 types 3 types 4 types 5 types 6 types 7 types 8 types 0 1 2 3 4 5 1 2 1 3 4 2 1 0 0
"What types of games do you play?"
Number of respondents = 13
Number of types of games played
Figure 25: Prospective participants' experience with actual game websites
Game usage was also assessed at the time they completed either the RA or RS session using the same question that appeared in the qualification survey. Since the qualification survey, four more participants indicated they had visited Games.com in the past month. Several
participants visited Armor Games, Bing games, Games.com, Kongregate, Miniclip, Pogo,
Shockwave, and Yahoo! Games between one and ten times in the past one month. No participant had visited Omgpop.com.
4.2 Remote Synchronous Testing Method
Thirteen participants completed the RS session. It took participants approximately thirty-one minutes to complete the RS session (Table 6). It took participants approximately twenty minutes to complete the pre-session activities, two minutes to complete the tasks, and nine minutes to complete the post-session activities.
Never 1-10 11-20 21+
0 2 4 6 8 10 12 14
"How many times have you used these browser-based game websites in the past 1 month?"
Number of respondents = 13
Armor Games Bing Candystand Gameforge (MMOGame) Games.com Kongregate Miniclip Omgpop Pogo Popcap Shockwave Yahoo! Games Frequency of use
Table 6: Time to complete each part of the RS method (minutes)
Session Part Average Min Max Standard Deviation
Pre-session 19.65 8.58 31.2 13.76
Tasks 2.26 0.67 6.45 3.05
Post-session 8.89 2.35 15.28 3.46
Total 30.75 NA NA NA
Eight found it convenient to be able to participate in a usability test remotely without having to visit a physical location. One participant stated that he liked “being able to participate at [his] own convenience from [his] home office.” Even though many of the participants found the RS method convenient, many had issues with the technology used to share his or her screen. Five participants were “Very satisfied” or “Satisfied” with the technology they used to complete the RS session, while three were “Dissatisfied” or “Very Dissatisfied” (Figure 26). These issues are described in more detail in the Pre-session section below.
All twelve participants were either “Very satisfied” or “Satisfied” with thinking aloud during the session and were “Very satisfied” or “Satisfied” with the time it took to complete the entire session.
Figure 26: Satisfaction with the RS activities
Figure 27: Level of agreement with statements about the RS method
Thinking aloud Time needed to
complete the session Technology used in the session
0 2 4 6 8 10
Satisfaction with the RS activities
Number of respondents = 12
Very Satisfied Satisfied Neutral Dissatisfied Very Dissatisfied Not Applicable
Remote method activities
N
um
be
r o
f r
es
po
nd
en
ts
Received the right amount of moderator guidanceEasy to "think aloud" during the tasks Convenient to complete the session remotelyEasy to screen share Easy to record the audio and video for the remote sessionEasy to download and view the website Difficult to talk to a moderator without seeing their faceProvided valuable feedback Session took too long to complete Difficult to figure out what to do to complete the entire studyOnline guide was helpful Would participate in a future study using this remote method
0% 20% 40% 60% 80% 100%
Level of agreement with statements about the RS method
Number of respondents = 12
4.2.1 Pre-session
The plan was to use Skype to call the participant on his or her mobile phone, to share the participant's screen using either Skype or LotusLive, and use Camtasia to record the audio and video. Testing took longer than expected and the Camtasia trial expired. Camtasia was replaced by the VodBurner software that connects with the Skype application to record audio and video calls through Skype.
Depending on the method used for the audio chat or sharing the screen, the other method was chosen accordingly (Figure 28). For example, if the participant wanted to talk on their mobile phone and not Skype, LotusLive was used to share the screen4. One participant could not
audio chat on Skype because she did not have a computer microphone, but she could share her screen using Skype. Since she already had Skype screen sharing working, the moderator opted to use Skype instead of LotusLive. The complete software method used for this session was Skype screen sharing, the moderator used their mobile phone to call the participant on their mobile phone, and Camstudio was used to record the mobile to mobile conversation.
There were several issues with sharing the participant's screen. During one session the moderator discovered that a call from Skype to a participant's mobile phone would not work simultaneously with the participant using Skype to share their screen. The participant switched to LotusLive instead. Another participant also had trouble using Skype. The participant had to re-install the recommended updates for Skype before the sessions could start. The resulting
recording for this session was also faulty. While the entire session was recorded, the file does not capture the audio and video after a few seconds.
In two other sessions the moderator's Internet connection disconnected and the Skype call was lost, but the moderator was able to resume where the session was interrupted. In another session LotusLive stopped working repeatedly, so the participant had to take time to stop and restart sharing his screen. In a fourth session VodBurner stopped recording after the second task, so the moderator took notes instead of relying solely on the video.
Two participants commented about the lack of a microphone to complete the RS session. One participant wanted to use a microphone to talk with the moderator on her computer, but did not have a microphone on hand and instead had to use her mobile phone. The participant found this inconvenient because she had to rest the phone on her shoulder while she completed the tasks. A second participant disliked that it took time away from the test to find and setup his microphone and stated, “There are a lot of steps involved.”
The time it took to complete the pre-session activities is defined as the time, in seconds, the session began to the time the first task started.
Figure 28: Software used to share the participant's screen, record voice, and record audio in the RS method
All thirteen participants completed the pre-session survey (Appendix C: Figure 8). The first two participants that completed the pre-session survey using the music prototype were not able to respond to two questions about their music experiences:
• “How many times have you used these streaming music websites in the past 1 month?”
• “What sources do you use to listen to music?”
These participants were not able to respond to these questions because there was an error in the online guide to successfully communicate with the survey to show the question.
3
4
4 1 1
Software used to share the participant's screen, record voice, and record audio in the RS method
Number of respondents = 13
Six participants were “very satisfied” with completing the pre-session activities and four participants were “satisfied” with completing the pre-session activities for the RS session (Figure 29).
Figure 29: Participant satisfaction with completing RS pre-session activities
4.2.2 Tasks
4.2.2.1 Time on task
The time on task was calculated for eight of the nine participants who used the music prototype and three of the four participants who used the game prototype (Table 7). Time on task was not calculated for the remaining participants because the video was not successfully
recorded and times could not be found.
Table 7: Time on task in the RS method (seconds)
Music prototype (8 of 9 participants) Game prototype (3 of 4 participants)
Average SD Average SD
Task 1 180.17 1.94 97 18.29
Task 2 146 0.95 25.67 87.68
Task 3 138.3 0.8 69.67 99.95
0 1 2 3 4 5 6 7 6 4 2
0 0 0
Participant satisfaction with completing the RS pre-session activities
Number of respondents = 12
4.2.2.2 Task Difficulty Ratings
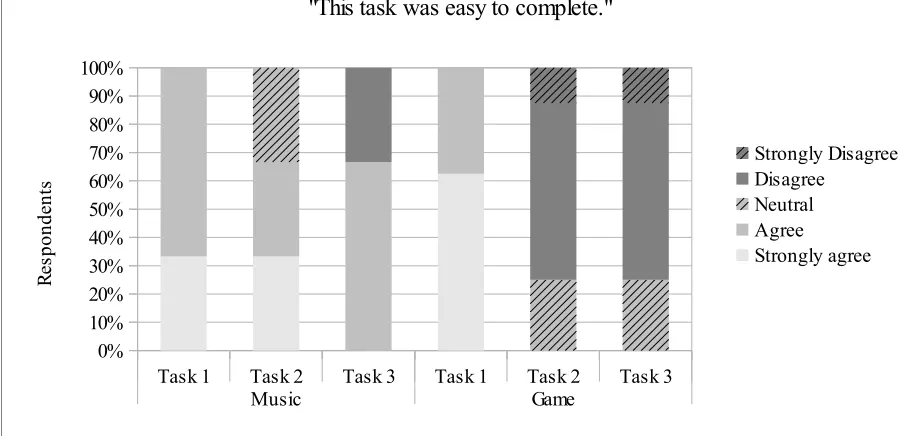
All participants completed the task difficulty rating survey questions for the music and game prototypes (Appendix D: Figure 9). More than 60% of participants “strongly agreed” or “agreed” that each task in the music and game prototypes for the RS method were easy to complete (Figure 30). Approximately 25% of participants strongly disagreed that Task 1 in the music prototype was easy to complete. And approximately 25% of participants disagreed that Task 3 in the music prototype and Tasks 2 and 3 in the game prototype were easy to complete. Two participants were confused by the wording of Task 1 in the music prototype. One participant did not understand how she had “saved” songs on the website. The second participant was unsure whether “listening to two saved songs” referred to the songs he searched for in Task 2 (which he performed first). One participant was confused by the wording of Task 2 in the game prototype. The participant started Task 2 and motioned to chat with her friend (to successfully complete the task) when she re-read the task and thought it meant rather to actually start a game with the friend.
Figure 30: Task difficulty ratings in the RS method
Task 1 Task 2 Task 3 Task 1 Task 2 Task 3 Music prototype Game prototype 0%
10% 20% 30% 40% 50% 60% 70% 80% 90% 100%
"This task was easy to complete."
Strongly Disagree Disagree
Neutral Agree
Strongly agree
R
es
po
nd
en
4.2.3 Usability Issues Discovered
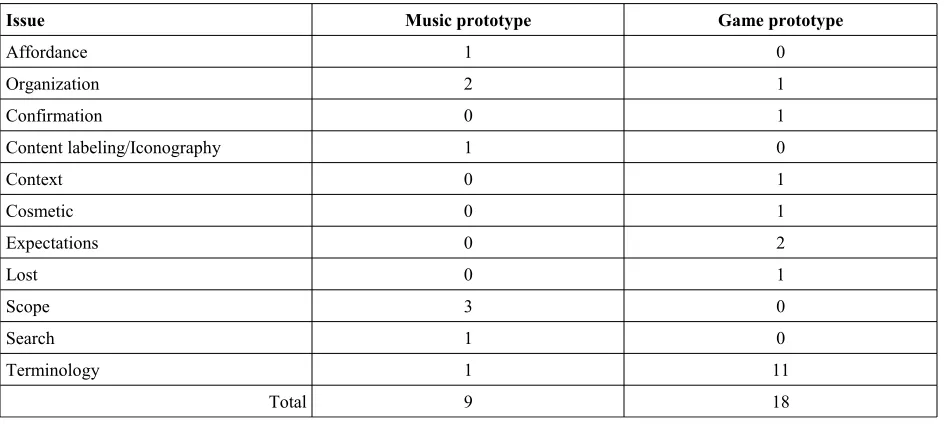
A total of fifty-five non-unique usability issues were discovered in the music prototype and twelve in the game prototype among all participants (Table 8). The most discovered usability issue categories in the music prototype were issues relating to confusing search capabilities (fifteen issues), organization (twelve issues), and lack of confirmation notices (seven issues). The most discovered usability issue categories in the game prototype were confusing terminology (ten issues), confusing organization (one issue), and wrong expectations (one issue).
Participants were asked to rate their level of agreement with various statements about the website prototype they used in the RS session (Figure 31). More than 50% of participants felt the prototype was easy to use and navigate, although approximately 90% of participants agreed they had to ask for help to use the prototypes, approximately 45% felt the prototypes did not match their goals, and 25% felt they needed a higher level of interaction to understand the website. Approximately 90% of participants stated they felt the terminology was not confusing which contrasts with the ten times terminology usability issues were found in the game prototype.
Table 8: Non-unique usability issues discovered in the RS method
Issue Music prototype Game prototype
Organization 12 1
Confirmation 7 0
Content labeling/Iconography 6 0
Cosmetic 3 0
Expectations 3 1
Lost 3 0
Manipulation 2 0
Prototype 2 0
Scope 2 0
Search 15 0
Start function 1 0
Terminology 0 10
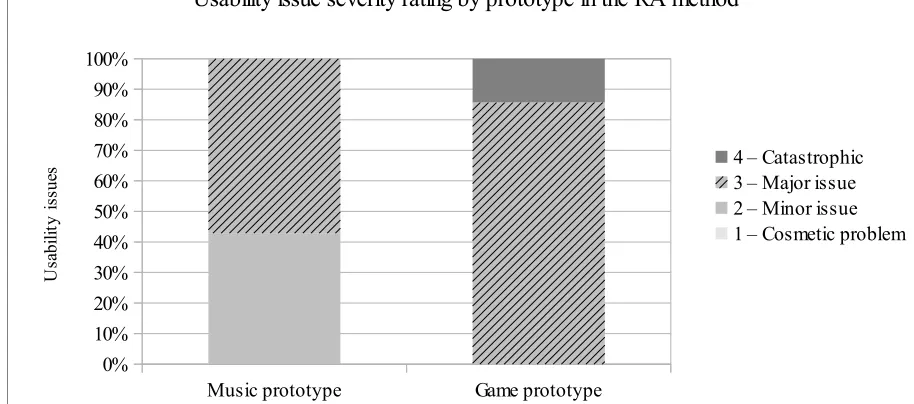
Approximately 10% of the usability issues in the music prototype were “catastrophic” (Figure 32). “Minor issues” made up approximately 41% to 55% of the issues in the music prototype. “Cosmetic issues” made up less than 10% of the issues in the music prototype.
For the game prototype, approximately 65% of the usability issues were “major issues”. The remaining 35% were “cosmetic issues”.
Figure 31: Level of agreement with statements about the prototype in the RS method
Easy to find the right information Navigation was easy to understand Used the website in the most efficient manner Needed to ask others for help to use the website Website overall was easy to use Language and terms were confusing Website does not match my goals Level of interaction and choices was just right M ore detail needed to understand the website Felt comfortable talking about the information on the website
0% 20% 40% 60% 80% 100%
Level of agreement with statements about the prototype in the RS method
Number of respondents = 12
Strongly agree Agree Neutral Disagree Strongly Disagree % of respondents
St
at
em
en
t a
bo
ut
th
e
w
eb
si
Figure 32: Usability issues by severity rating in the RS method
4.2.4 Prototype
Several participants searched for the interactive elements in the prototype to figure out how to use the website and complete the tasks. One participant read the task and clicked around the page and said, “Can you click that...or...ok, I'm confused. What can't you click? Ohh, ok, I see you can only click the certain ones [page elements] for the task anyways.” A second
participant expected a search box to appear in a particular part of the page and when he found it and discovered it was not clickable, he discovered a second search box that was interactive and said he knew to use the interactive one. A third participant stated, “Oh, there's two 'Rocks' [playlists]. Well, this one's clickable, so I'll do [use] that.”
The moderator stated that most elements of the prototype were not interactive and that the participant should describe elements on the website they would want to interact with or areas of the website they would expect to use in order to complete the tasks. Regardless of this
disclaimer, participants either exclusively looked for interactive elements to complete the tasks or felt they had not completed a task until they believed an interactive element had led them to their end goal.
Music prototype Game prototype 0%
10% 20% 30% 40% 50% 60% 70% 80% 90% 100%
Usability issue severity rating by prototype in the RS method
4 – Catastrophe 3 – Major issue 2 – Minor issue 1 – Cosmetic problem
U
sa
bi
lit
y
is
su