Using Electric Vehicle Fleet as Responsive Demand
for Power System Frequency Support
Sikai Huang, Lei Wu, David Infield
University of StrathclydeGlasgow, UK [email protected]
Tianshu Zhang
China Electric Power Research Institute Beijing, P. R. China
Abstract—Based on conventional car driving patterns, it has been recognized that typically a car remains stationary for 95% of the time, only being driven on the road for the remaining 5% of that time on average. This gives the system operator opportunities to utilize future EV charging as system reserve demand in order to provide system control, such as frequency response. In this paper, a next generation power system with high penetration of renewables represents the future power grid in Great Britain. Three charging schemes for EVs are presented in order to illustrate their potential as responsive demand for power system control. A case study was undertaken for the year 2020. System frequency stability tests have been performed with shedding EV fleet charging.
Keywords—Electric vehicles (EVs); vehicle-to-grid (V2G); demand response (DR); load shaping; frequency stability
I. INTRODUCTION
With an increasing penetration of renewable energy sources into power systems, frequency management with low power system inertia is becoming of real concern for Transmission System Operators (TSOs). The kinetic energy stored in all rotating generators and motors that are synchronously connected to the network (or near synchronously connected in the case of induction generators and motors) will be released in response to system frequency drops and oppose the change in system frequency. This is referred to as ‘inertial response’. However, modern renewable energy sources, such as variable speed wind turbines and PV systems, are regarded as non-synchronous generators by TSOs since they are decoupled from the network by power electronic converters and cannot automatically contribute to power system inertia. Comprehensive research has been conducted to improve understanding of the dynamic characteristics of power systems. A working group has been established by National Grid in the UK to investigate the issues associated with frequency response from renewable energy sources, in particular variable speed wind turbines through synthetic inertial response [1]. The European Network of Transmission System Operators for Electricity (ENTSO-E) is investigating the requirement of frequency support services from wind plant.
Interest in the electric transport sector, especially hybrid electric vehicles (HEVs) and plug-in electric vehicles (PEVs)
has increased considerably in recent years. As an alternative to conventional internal combust engine (ICE) vehicles, EVs offer the opportunities to both reduce the fuel consumption and carbon emissions by using electricity as its main source of power. However, there is a concern that much of the EV charging load may occur at times when the electricity supply system is already heavily loaded and will impact across the entire power system. This may further exacerbate the performance of power systems with high penetration of renewable energy sources [2-3]. It has been shown that EVs can be used to provide frequency support by acting as responsive load [4-5] or discharging stored battery energy, known as vehicle to grid (V2G) [6]. The principle of acting as responsive load is to disconnect EV charging load in response to frequency drops so that the load demand on the system will reduce allowing power systems frequency regulation to be achieved. V2G requires discharging the stored energy back to the grid from EVs when required, for example when lower than expected wind generation is available. However, because of the potential reduction in battery life through cycling as a consequence of using V2G; such operations may be only used for extreme cases.
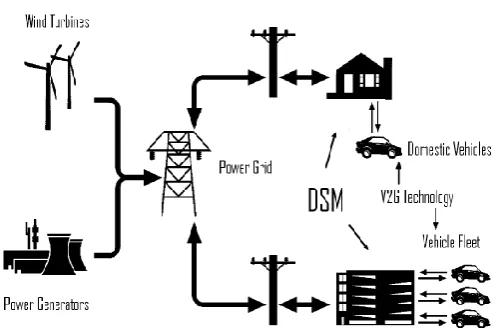
[image:1.595.309.558.203.367.2]conditions are constantly changing. In this paper, integration of domestic car Monte Carlo simulation model and simplified GB power system model has been established that enables the provision of frequency response from EVs; and then applied to examine the frequency stability of a simplified Great Britain power systems with a high penetration of wind generation.
II. SYSTEM MODELLING
A. Electric Vehicle Charging Model
[image:2.595.336.520.53.315.2]Two types of electric vehicles have been considered as structuring the electric vehicle charging demand (EVCD) in the modelling. A battery based electric vehicle (BEV) has the capacity to allow 109 miles driving distance; while, the plug-in hybrid electric vehicle (PHEV) offers approximately 15.5 miles on electric mode driving [7]. Table I states the specifications for both types of electric vehicle.
Table I. Specifications of EVs used in the EVCD model.
Attributes BEV PHEV
Battery capacity (C) 24 kWh 4.5 kWh
Range limit (D) 109 miles 15.5 miles
Full charging time
(T) 3.3 hours 1.5 hours
Charging rate (P) 32A 13A
Most of these electric vehicles are expected to be used by domestic households. It is reasonable to assume that the daily miles travelled by domestic cars are close to current value for conventional domestic vehicles, as presented in [4]. A Monte Carlo (MC) model has been developed to simulate domestic car daily driving patterns, as shown in Figure 2, [8]. The MC model predicts the daily driving distance and car departure and arrival times based on available statistics. Two levels of charging have been considered in order to investigate their potentials impact on the electricity grid. Assuming the charger is only installed at household, EV charging load tends to be determined by the stochastic daily car use and the charging strategies applied.
B. Next Generation Power System with Wind Generation A number of scenarios are developed to reflect the UK National Grid’s view of the potential generation mix for the year 2020, e.g. the ‘Gone Green’ scenario which will meet the UK Government’s climate change targets, and ‘Business as Usual’ scenario which is based on only incremental changes to existing markets and frameworks. National Grid in the UK has established a Grid Code Frequency Response Working Group across stakeholders to assess the frequency response services necessary to secure the system operation in the future. Significant development in EV charging stations has been planned in this power system. It is estimated that the potential market penetration for EVs will reach approximately 1.8 million by 2020 and 13.5 million by 2035, which including EV and Plug-in Hybrid Electric Vehicles (PHEV), [9]. The UK power
system can be divided into 17 study zones for analysis purposes. The approach to simplified power system modelling [10]-[12] is applied to represent the transient system frequency response. Wind capacity and local wind speed (turbulence intensity) in each zone has been used to calculate the frequency support capacity available from wind farms using a methodology developed in [13]. The frequency transient characteristics following a significant loss of generation are examined for specific demand and weather conditions. The EV load is treated as responsive demand in this study so as to reduce the charging power demand in response to sudden significant frequency drops on the system. In this way, the EV charging load can also provide a ‘synthetic’ inertial response, either alone, or alongside synthetic inertia from wind. In this case study, 2020 ‘Gone Green’ scenario has been assessed with 27.3GW wind generation (17GW off-shore) with the assumption for 1.8 million EVs as a mix of full EVs and PHEVs.
Figure 3 Simplified GB power system model including wind generation and electric vehicle charging load.
[image:2.595.53.274.274.368.2] [image:2.595.310.556.560.688.2]III. EV AS SYSTEM RESPONSIVE DEMAND
A. Charging Strategies for EV Fleet
Three charging strategies have been developed to calculate the charging load: ‘Unconstrained’ charging, ‘Timed’ charging, and ‘Proposed’ charging strategies which take into account the statistical distribution of the beginning of the charge cycle, the stochastic distribution of the times when EV chargers are switched on and off, and EV owners’ charging pattern. The charging demand is calculated based on the market penetration of EVs is the same as predicted by the ‘Gone Green’. For above charging strategies, the focus is on shifting the charging demand from existing domestic electricity peak time to between mid-night and early morning time.
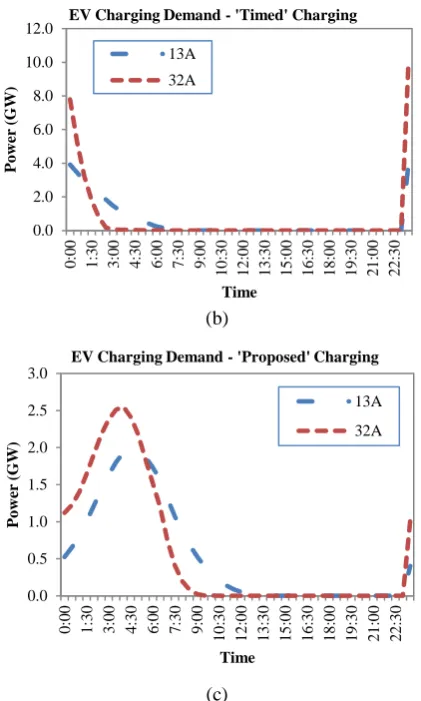
The simulation results for three charging strategies are shown in Figure 4. For the ‘Unconstrained’ charging, it is assumed that charging starts as soon as the EV arrives home. The EV charging load thus follows the personal car returning home distributions, [4], [8]. There is considerable potential to shift charging into time-zone when household demand is low. Next charging strategy investigated, ‘Timed’ charging, is simply to delay all vehicles charging until a designated time. This was selected as 11:30 pm, since the conventional domestic load is generally low at this time of night. It is also the time used in an EV user trial being undertaken by the Ford Motor Company, [14]. In this scenario all EVs start charging from 11:30 pm with 13A or 32A charging rates as appropriate. As would be expected, this approach creates a new peak load due to vehicle charging, as illustrated in Figure 4 (b). Although this new peak occurs at a period of otherwise low demand, its magnitude is unacceptable in the case of high charging since the total load then exceeds the previous peak value. This is clearly a drawback of the technique. In the contrast, using the 13A charging rates, vehicle charging has been spread out over a longer period and thus does not increase the overall peak load value. For this reason, a progressive ‘Proposed’ technique has been introduced to smooth out the impact of vehicle charging. The approach is to delay a proportion of vehicle charging by a random time subsequent to 11:30 pm. The delay period is determined by sampling from a Gaussian distribution. This approach effectively solves the problem of creating a new night-time peak load due to EV charging, even with the 32A charging rate.
(a)
(b)
(c)
Figure 4. EV charging demand profiles. (a) “Unconstrained” charging; (b) “Timed” charging; (c) “Proposed” charging. 13A for PHEV charger, and 32A for EV charger.
B. EV Fleet Charging as System Responsive Demand for Frequency Support
[image:3.595.324.535.59.410.2]A simplified GB power system is taken as a case study to investigate the impact of frequency response from EVs on frequency stability. It is assumed that the amount of wind generation in the system is 27.3GW (on-shore and off-shore wind farms) by the year 2020, and there will be 1.8 million EVs deployed across the country. Both full EVs and PHEVs have been considered. A power system load profile model including the charging characteristics of EVs has been developed in this work based on a stochastic approach that takes into account the statistical distribution of the times when EV chargers are switched on and off, and EV owners’ driving pattern, [8]. The system load for a typical winter weekday by the year of 2020 has been estimated using the developed model as shown in Figure 3. The wind speeds for regions 1 to 3 are shown in Figure 5 to give an indication of the wind variability. The wind capacity will make up a moderate proportion of generation mix because of the relatively low wind speeds. It can be seen in Figure 6 (a) that system load reaches the lowest point at 6am for both ‘Unconstrained’ and ‘Proposed’ 13A charging control strategies. 0.0 0.5 1.0 1.5 2.0 2.5 3.0 3.5 0 :0 0 1 :3 0 3 :0 0 4 :3 0 6 :0 0 7 :3 0 9 :0 0 1 0 :3 0 1 2 :0 0 1 3 :3 0 1 5 :0 0 1 6 :3 0 1 8 :0 0 1 9 :3 0 2 1 :0 0 2 2 :3 0 Po w er ( GW ) Time
EV Charging Demand - 'Unconstrained' Charging
13A 32A 0.0 2.0 4.0 6.0 8.0 10.0 12.0 0 :0 0 1 :3 0 3 :0 0 4 :3 0 6 :0 0 7 :3 0 9 :0 0 1 0 :3 0 1 2 :0 0 1 3 :3 0 1 5 :0 0 1 6 :3 0 1 8 :0 0 1 9 :3 0 2 1 :0 0 2 2 :3 0 Po w er ( GW ) Time
EV Charging Demand - 'Timed' Charging
13A 32A 0.0 0.5 1.0 1.5 2.0 2.5 3.0 0 :0 0 1 :3 0 3 :0 0 4 :3 0 6 :0 0 7 :3 0 9 :0 0 1 0 :3 0 1 2 :0 0 1 3 :3 0 1 5 :0 0 1 6 :3 0 1 8 :0 0 1 9 :3 0 2 1 :0 0 2 2 :3 0 Po w er ( GW ) Time
EV Charging Demand - 'Proposed' Charging
13A
[image:3.595.55.269.542.706.2]Figure 5. Synthesized wind speed for a typical winter weekday.
For this case study, 6am has been chosen to examine the impact of the largest generation loss on the frequency stability in the GB power system for the year of 2020, because that the loss of generation accounts for a large proportion of the generation mix. It has been assumed that a sudden infeed loss of 1800 MW occurred. Frequency deviation due to loss of generation is shown as green line in Figure 7
.
It is assumed
that the certain proportion of
EV charging load is disconnected from the network in response to the system frequency drop. In this case, 10% and 20% of the ‘proposed’ EV charging load are disconnected in order to support system frequency as illustrated in Figure 7. The system parameters have been tuned to allow the frequency contained close to statuary 49.2 Hz for base load and unconstrained 13A charging strategy. As seen from the figure, system frequency recovered faster with 20% of ‘proposed’ charging load disconnected comparing to only 10% been disconnected. With 9.6GW of wind power in the system at 6am, system frequency recovered far more rapidly than the situation with no wind in the case of disconnecting 10% of the modelled ‘proposed’ EV charging load, comparing the blue line with the red line. The reason is that in the simplified GB power system model, the wind generation module has already with a controller to contribute system frequency support.IV. CONCLUSION
Based on the statistics conduct from conventional car use, electric vehicles have potentials to provide services as system responsive demand. In this paper, EV charging simulation results with three charging strategies are presented, and a simplified next generation GB power system has been developed with high penetration of EV and wind. In order to discover the potentials of utilizing EV load as system responsive demand, two different charging rates are considered and winter weekday system load profiles are presented. A specific case has been performed where system load reach its lowest value. As in the case study, a sudden system generation loss is considered and EVs charging is utilized for support system frequency. From the case study, it is feasible for EVs to provide system frequency support; however, the end-user needs have not been considered in this study. In the next phase of study, the state of charge of
EV battery estimation and an economic reward model should be included in order to evaluate the more accurate the cost of EV as system responsive demand.
(a)
[image:4.595.325.531.99.463.2](b)
Figure 6. System load with EV charging for a typical winter weekday, including ‘Unconstrained’ and ‘Proposed’ charging strategies. (a) 13A charger profiles; (b) 32A charger profiles.
Figure 7. EV acting as system responsive demand for frequency support. 02 04 06 08 10 12 14 16 18 20 22 24
0 5 10 15
Time (hr)
Wind
Sp
ee
d (m/
s)
Region 1 Region 2 Region 3
02 04 06 08 10 12 14 16 18 20 22 24 30
35 40 45 50 55 60
Time (hr)
Sy
ste
m loa
d (GW)
Unconstrained 13A Proposed 13A Base load
02 04 06 08 10 12 14 16 18 20 22 24 30
35 40 45 50 55 60
Time (hr)
Sy
ste
m loa
d (GW)
Unconstrained 32A Proposed 32A Base load
0 5 10 15 20 25 30 49.2
49.3 49.4 49.5 49.6 49.7 49.8 49.9 50 50.1
Time (s)
Frequency (Hz)
[image:4.595.314.538.512.686.2]ACKNOWLEDGMENT
This work was supported by the UK’s Engineering and Physical Sciences Research Council (EPSRC) under project EP/K005316/1.
REFERENCES
[1] National Grid, "Frequency Response Technical Sub-Group Report," 2011.
[2] J. A. P. Lopes, et al., "Integration of Electric Vehicles in the Electric Power System," Proceedings of the IEEE, vol. 99, pp. 168-183, 2011. [3] K. Qian, et al., "Modeling of Load Demand Due to EV Battery Charging
in Distribution Systems," Power Systems, IEEE Transactions on, vol. PP, pp. 1-1, 2010.
[4] Y. Mu, et al., "Primary Frequency Response From Electric Vehicles in the Great Britain Power System," Smart Grid, IEEE Transactions on, vol. PP, pp. 1-9, 2012.
[5] P. M. R. Almeida, et al., "Electric vehicles participating in frequency control: Operating islanded systems with large penetration of renewable power sources," in PowerTech, 2011 IEEE Trondheim, 2011, pp. 1-6. [6] M. Yuchao, et al., "Modeling the Benefits of Vehicle-to-Grid Technology
to a Power System," Power Systems, IEEE Transactions on, vol. 27, pp. 1012-1020, 2012.
[7] E. Rask, et al., "On charging equipment and batteries in plug-in vehicles: Present status," in Innovative Smart Grid Technologies (ISGT), 2012 IEEE PES, 2012, pp. 1-1.
[8] H. Sikai and D. Infield, "The impact of domestic Plug-in Hybrid Electric Vehicles on power distribution system loads," in Power System Technology (POWERCON), 2010 International Conference on, 2010, pp. 1-7.
[9] National Grid, “Gone Green 2011 Key facts and figures”, 2011. Available online:
http://www.nationalgrid.com/NR/rdonlyres/F6FA7970-5FEA-4918-
8EE2-2A8E6B9626FF/50214/10312_1_NG_Futureenergyscenarios_factsheet_ V2_st3.pdf
[10] P. M. Anderson and M. Mirheydar, "A low-order system frequency response model," Power Systems, IEEE Transactions on, vol. 5, pp. 720-729, 1990.
[11] L. Wu and D. Infield, "Wind Plant Contributions to Power System Frequency Response," in European Wind Energy Association Annual Conference (EWEA2012), Copenhagen, Denmark, 2012.
[12] D. C. Hill, et al., "Application of Auto-Regressive Models to U.K. Wind Speed Data for Power System Impact Studies," Sustainable Energy, IEEE Transactions on, vol. 3, pp. 134-141, 2012.
[13] L. Wu and D. G. Infield, "Towards an Assessment of Power System Frequency Support From Wind Plant-Modeling Aggregate Inertial Response," Power Systems, IEEE Transactions on, vol. PP, pp. 1-1, 2013. [14] R. Carter, A. Cruden, D. Densley, and T. Nicklin, "Timed Charging Points for Electric Vehicles: User Behaviour and Potential Impacts to Low Voltage Networks," in European Electric Vehicle Congress, Brussels, Belgium, 2011, p. 7.
Table II System Parameters
Capacity Wind Nuclear Pumped
Storage Others
System Load
Power System Inertia Constant
Case 1 9.6 6.9 1.8 12.4 30.7 4.15
H 0 6.5 4.5 6 - -