This is a repository copy of Experimental observation of the nonlinear coupling of flame flow and acoustic wave.
White Rose Research Online URL for this paper: http://eprints.whiterose.ac.uk/90867/
Version: Accepted Version
Article:
Chen, L.W. and Zhang, Y. (2015) Experimental observation of the nonlinear coupling of flame flow and acoustic wave. Flow Measurement and Instrumentation, 46 (Part A). 12 - 17. ISSN 0955-5986
https://doi.org/10.1016/j.flowmeasinst.2015.09.001
[email protected] https://eprints.whiterose.ac.uk/ Reuse
Unless indicated otherwise, fulltext items are protected by copyright with all rights reserved. The copyright exception in section 29 of the Copyright, Designs and Patents Act 1988 allows the making of a single copy solely for the purpose of non-commercial research or private study within the limits of fair dealing. The publisher or other rights-holder may allow further reproduction and re-use of this version - refer to the White Rose Research Online record for this item. Where records identify the publisher as the copyright holder, users can verify any specific terms of use on the publisher’s website.
Takedown
If you consider content in White Rose Research Online to be in breach of UK law, please notify us by
1
Experimental observation of the nonlinear coupling of flame flow and
acoustic wave
Li-Wei Chen*a and Yang Zhangb
a
Department of Mechanical and Computer-Aided Engineering, The National Formosa University, Yunlin, 632, Taiwan
b
Mechanical Engineering Department, The University of Sheffield, Mapping Street, Sheffield S1 3JD, UK
*Corresponding author: Phone: +886(5)6315315; Fax: +886(5)6315310; E-mail: [email protected]
Abstract
This is an experimental investigation to study the nonlinear coupling characteristics of a
propane/air flame with acoustic standing waves, using chemiluminescence emission and
phase-locked PIV measurements. A variety of coupling modes are observed for the excitation source with
combustion instability oscillations and its harmonics and sub-harmonics. The frequency analysis
shows that flame/acoustic coupling behaviour results in complex nonlinear coupling. The coupling
behaviour is weak at lower excitation intensities (0.3V). At a voltage amplitude of 2 V, the results
show that the excitation frequency (fe) is only coupled with the sub-harmonic frequency (fe/5) for
the premixed flame. However, for the diffusion flame, more complex frequency components are
observed, which exhibit relationships of fe ± ff and fe ± fe/5. At a voltage amplitude of 13.7 V, the
sub-harmonic frequencies (2fe/5 and 3fe/5) and the premixed flame buoyancy oscillations (ff) are
increased. PIV measurements provide detailed flow velocity vector fields in an acoustically excited
tube for different phase angles and the effect on the flames at different equivalence ratios, which
increases the understanding of flame oscillation behaviour. It is found that all of the nonlinear
phenomena that are observed occur because of the coupling between buoyant and acoustic
excitation and create complex nonlinear frequency couplings.
2
1. Introduction
Combustion instability is commonly observed in practical combustion systems, such as furnaces and
gas turbines. Flame-acoustic interaction is one of the major reasons for these undesirable
phenomena in an enclosed combustion system. It is known that the range of acoustic frequencies,
amplitudes and phase angles can affect the flame dynamics. Due to the thermoacoustic mechanism,
the amplitude of acoustic oscillations can grow and therefore their effect on the flame dynamics
also grows [1, 2]. These effects are enhanced in a combustion chamber, because there is coupling
between an unsteady heat-release rate and acoustic pressure. Under certain conditions, this
coupling can result in increased thermoacoustic instability oscillations and consequently lead to
failure of the system [3, 4]. Practically, these unstable processes occur in the nonlinear regime,
where the system oscillates at a limit cycle [5]. Determining the mechanism of thermoacoustic
instability is complex because it involves a number of different phenomena.
It is seen that flame dynamics are significantly altered by acoustic excitation. Acoustically excited
flames are useful for research involving flame-acoustic interactions because acoustic perturbation
is an advantageous means of control for a flame that oscillates at specific frequencies [6]. The
acoustic signal can also be synchronised with other measurement devices. Depending on the
frequency and magnitude, the addition of a forced acoustic field can considerably modify the
dynamic flame structures and movements. The use of external acoustic perturbation also has an
effect on combustion at the chemical level, which results in a change in the emissions and the
molecular concentrations [7, 8]. There have been many studies of nonlinear flame oscillations using
acoustically excited flames. Kim et al. [8] and Kartheekeyan et al. [9] demonstrated that external
forcing an induced flame periodic oscillation can further create undesirable nonlinear oscillations
3
shown that flames exhibit nonlinear responses under various acoustic and combustion conditions.
In nonlinear systems, the flame oscillation wave and the acoustic excitation wave can induce other
frequency components, besides the excitation frequency. For instance, a sub-harmonic flame
response was found in pulsed premixed methane/air flames in the studies by Bourehla and Baillot
[10]; and Williams et al. [11] showed the existence of sub-harmonic flame oscillation components
of f/2, f/3, 2f/3, f/4 and f/5 in a laser-based investigation of the structures of a acoustically excited
flame. Huang et al. [12] identified nonlinear couplings between the buoyancy driven flame
instability and acoustic excitation using high speed colour imaging and an innovative colour digital
image processing technique for an acoustically excited and baffle-stabilised diffusion flame burner.
Most of these studies concentrate on external excitation in a fuel pipe in an open space. Not many
studies involve the observation of nonlinear flame dynamics in an acoustically forced tube and their
coupling behaviour. Recently, the authors have used a phase-locked PIV system to study the flow
characteristics for a propane diffusion flame at different nozzle position along an acoustically
excited tube [13]. The results show that the diffusion flame dynamics are significantly affected by
the standing wave in a tube because of the large velocity oscillation in the acoustic flow in the
anti-node area. The main objective of this study is to use nonlinear theory to explain the observed
nonlinear response modes for an acoustically excited premixed flame in a tube. A
chemiluminescence emission measurement system (PMT) is used to systematically examine the
oscillating frequency of propane-air flames at different intensities of acoustic excitation, especially
the nonlinear coupling of the flame dynamics and acoustic excitation. Detailed flame flow velocity
fields and vorticity are measured and calculated using a PIV (Particle Image Velocimetry) system, to
make use of more useful physical flame parameters from the two-dimensional spatial information
4
2. Experimental Setup
The schematic layout of the experimental apparatus is illustrated in Fig. 1. The design is similar to
the design in reference [13]. It consists of a burner system, a computer controlled 3D traverse, a
signal generation and a synchronisation system, a PIV system and a chemiluminescence emission
measurement system (PMT). The square tube was used to simulate the enclosed environment of a
practical combustion chamber. The burner utilised in this study was designed to produce a wide
range of premixed stabilised flames. Gaseous fuel (Propane) and air were respectively supplied
from the fuel bottle and the compressed air bottle and were controlled by dedicated flow-meters.
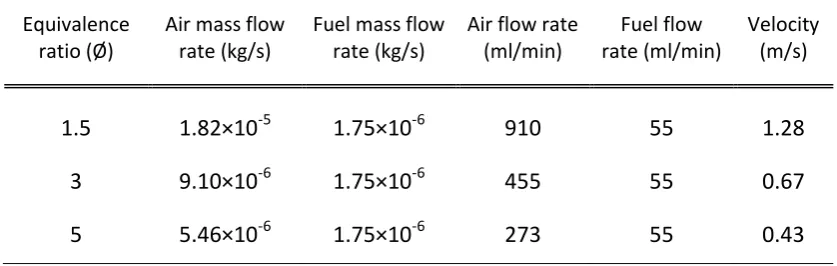
The flow rate for the propane was set at 55ml/min. Using this fuel flow rate, three equivalence
ratios of premixed flames were set as the main parameters. The experimental conditions are listed
in table 1. External acoustic excitation was provided by a loudspeaker, which was driven by a
power amplifier whose amplitude and frequency signals were controlled by a PC base LabView
system. The driving amplitude was defined using the peak-to-peak of the output voltage (V) of the
amplifier and was set at 0.3V, 2V and 13.7V for the study. The details for the burner system, the
PIV system and the signal generation and synchronisation system are the same as those for [13].
The chemiluminescence emission measurement apparatus consisted of two photomultipliers
(ORIEL, Model: 70704), a high voltage source supply, a converging lens arrangement, optical filters
and a randomly bifurcated fine fibre optic bundle. This optical system measured the flame
chemiluminescence intensity using a photomultiplier-tube (PMT). The filtered light collected from
the flame was used a set of monochromatic filters. Transmission of the light signal was
accomplished using a fibre optic cable. The CH* chemiluminescence was collected using a lens
system, which was designed to image the flame onto the end of a fibre optic cable. The data
outputs from the multipliers were displayed and stored in a PC based system. A National
5
analysis. The acoustic excitation signal, the PIV trigger timing and the PMT signals were
synchronized to allow a logical analysis.
3. Results and Discussion
Previous research [14] proved that the first four resonance frequencies of the present rig were 65
Hz, 220 Hz, 385 Hz and 550 Hz, respectively. The acoustical node and anti-node regions also fit the
observable area for the current test rig at an external excitation frequency of 385 Hz. Therefore, an
acoustic excitation frequency of 385 Hz was set as the main frequency for further analysis. The
burner nozzle was positioned in the acoustic anti-node region (see Fig. 1) to determine how the
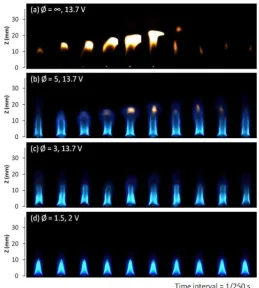
flame wave responded nonlinearly to acoustic excitation. Figure 2 shows the visible flame images at
different equivalence ratios at an excitation frequency of 385 Hz and a voltage amplitude of 13.7 V
(2 V in the case of Ø = 1.5). The strongly oscillating diffusion flame case is also shown in Fig. 2a. It is
seen that under the same acoustic excitation, the premixed flame is more stable than a diffusion
flame. The flame pattern is also more stable when the air-fuel mixing ratio is increased. At an
equivalence ratio of 5, a reddish flame colour is only visible at the flame tip. The flame oscillation
behaviour is similar to that for the diffusion flame, but it is much weaker. At Ø = 1.5, which is the
flammability limit for the current nozzle, the flame oscillation is the weakest of all the test cases.
The flame cone angle remains almost constant under acoustic forcing. However, the flame can be
extinguished suddenly by a slight increase in amplitude. These observations demonstrate that the
behaviour of the premixed flame is quite different to that for a diffusion flame under acoustic
perturbation. A diffusion flame can become a lifted flame, a partially premixed flame or a partially
extinct flame type, during each flame oscillation cycle.
In the case of the premixed flame, the flame pattern is generally stable and only a slight oscillation
6
attached to the nozzle in the 2nd image and then the flame is partially lifted. After that, the visible
blue flame pattern is observed below nozzle exit. This occurs because when the acoustic flow is
downward, the flame is pushed by the acoustic wave. In contrast, the flame slightly lifts off when
the acoustic flow is turned upwards. This study also found that this kind of flame behaviour is not
observable at Ø = 1.5. As shown in Table 1, the initial mean nozzle exit velocity at Ø = 1.5 is 1.28
m/s, which is higher than that for the other cases. This is much higher than the largest downward
acoustic flow velocity, which is around 0.6 m/s. It is seen that for the extreme case, the fuel jet still
resists the downward acoustic wave. Therefore the flame is stable at each phase angle of the
excitation cycle. However, the flame is close to the lower flammable limit at Ø = 1.5, so the mixture
is probably further diluted by the acoustic perturbation. It is eventually extinguished when there is
a slight increase the excitation intensity.
Figure 3 illustrates the power spectrum for the CH* chemiluminescence signals for the premixed
flames under acoustic excitation. The frequency components are very different at the different
equivalence ratios and external excitation intensities. For the case of a premixed flame, at a voltage
amplitude of 0.3 V, the only visible peak is the forcing frequency. For the diffusion flame (Ø = ),
both the flame flickering frequency (ff = 15 Hz) and the forcing frequency (fe = 385 Hz) are observed.
The harmonic frequencies of the natural flame frequency are also observed at 0.3 V. An expanded
view of the excitation frequency peak region shows two small peaks, which exhibit a relationship of
fe ff for the case of Ø = . At voltage amplitudes of 13.7 V and 2 V, the excitation frequency is
found, accompanied by two sets of fore and aft peaks. The data indicates that these
complementary peaks exhibit a relationship of fe ± ff and fe ± fe/5, and two clear peaks are also
7
frequency, which is fe/5. Unlike the obvious flame flickering in the diffusion flame, the natural flame
flickering frequency for the premixed flame is difficult to determine and the external perturbation
intensity is sufficiently large to overshadow the low frequency buoyancy-induced flame flicker.
Therefore, the sub-harmonic frequency (fe/5) is observed as the main complementary frequency
peak, instead of the flame flickering frequency. For instance, the complementary peaks are shown
to have a relationship of fe ± fe/5 for the premixed flame at 2 V.
These frequency components are explained by nonlinear theory and they are attributed to the
nonlinear response modes. For instance, the harmonic frequencies for the natural flame frequency
for the diffusion are correlated to the nonlinear response, which is shown in below:
) (1)
Fore and aft complementary frequency peaks at higher forcing intensities have been reported
recently by Huang et al. [12] , using a different test rig and using high speed colour imaging and
processing. They have also been observed in the nonlinear response of quasi-periodic fluid motion
[15]. Fenstermacher et al. [16] examined the turbulence transition of radial fluid velocity under
cylindrical rotational excitations using laser-Doppler velocimetry and Fourier-Transformation (FT).
The results showed the existence of a subtractive frequency-coupling component that is similar to
that of the fe - ff and fe - fe/5 modes. The nonlinear coupling between the and
or wave signals can result in the creation of a
sin t sin t or a sin t sin t frequency component. This can then be broken down
into the following equations:
(2)
8
(3)
This may explain the observed nonlinear coupling relationship of fe ± ff and fe ± fe/5.
Studies of the effect of the forcing intensity show that there are no observable harmonic coupling
at 0.3 V. After further increasing the voltage amplitude to 2 V, the frequency component is similar
for each premixed flame and the external forcing has no obvious effect on the premixed flame at
different equivalence ratios. However, the sub-harmonic frequencies, which are 2fe/5 and 3fe/5,
become visible in both the diffused and premixed flame cases. A further increase in the voltage
amplitude to 13.7 V produces frequency components is similar to those at 2 V, but the amplitude of
the sub-harmonic response is increased. A tiny peak is also observed at around 10 Hz, at Ø = 3 and
5. A set of fore and aft peaks that accompany each sub-harmonic frequency are also observed. The
power spectrum for the premixed flame without excitation indicates that the natural flickering of
the premixed flame is around 10 Hz. It is seen that the lower intensity of the acoustic excitation can
overshadow the flicker frequency. However, it can be induced again at higher forcing intensities.
Figure 4 shows the velocity vectors and the vorticity contour maps for the flow field for the
premixed flames at different equivalence ratios. The velocity fields for the premixed flame are
similar to those for the diffusion flame at phase angles of 72° and 144°, where the acoustic wave
induces an upward flow motion, which further accelerates the flame buoyancy effect for each case.
The flame flow velocity was then increased to the maximum at these phase angles. At a phase
angle of 0°, the acoustic perturbation is low. A strong upward flow motion is observed above the
nozzle for the premixed flame and no obvious downward velocity vectors can be seen on the X-axis.
9
diffusion flame, the fuel jet needs surrounding air as an oxidant to sustain the chemical reaction. In
this case, the low initial velocity of the fuel jet and the ambient air are both affected by the acoustic
excitation. There is an obvious disturbance in the flame flow pattern at a phase angle of 0°. At a
phase angle of 288°, the largest downward acoustic flow is observed. The velocity field at this phase
angle is very different for each flame. For the diffusion flame, the upward flame flow and the
downward acoustic flow create a chaotic flow pattern, whereas for the premixed flame, upward
velocity vectors are observed in the centre of each figure. When the air-fuel mixture rate is
increased, the flow motion becomes stronger. For the case of Ø = 5, a cone-shaped low velocity
field is observed at Z = 20 mm, where the flame front is pushed by the strong downward acoustic
field. A comparison between this data and Fig. 2b shows that the mushroom-shaped flame tip in 3rd,
4th and 5th image matches the PIV velocity data. At Ø = 3, a greater air flow rate increases the initial
fuel velocity and resists the downward acoustic flow, so the upward flame flow pattern on the
X-axis is stronger than that for Ø = 5 at phase angles of 216° and 288°. It is seen that the combination
of the initial mixture flow velocity and the buoyancy effect of the flame counters the acoustic effect.
The vorticity contour maps in Fig. 4 show that the angled velocity acceleration zones match well
with the angled vorticity contour. In the diffusion flame, many disordered positive and negative
vorticities are spread across the image, at each phase angle. The upwardly moving hot gas is broken
up by the up-and-down flow of the acoustic wave. These locally opposing flows then form many
little vortices because of Kelvin-Helmholtz instability. For the premixed flame, strong vorticity is
distributed on both sides of the X-axis. The positive vorticity is shown on the left hand side and the
right hand side is negative. In particular, vorticity patterns are observed at phase angles of 0°, 72°
10
of hot gases and is further accelerated by upward acoustic flow. This combination creates a fast
flow that is stronger than the strongest upward acoustic flow. Therefore, these two flows create
relatively opposite velocity gradients and form a strong vortex. At phase angles of 216° and 288°,
the flame flow is pushed by the downward acoustic flow and results in a decreased upward flame
flow, so the vortex is weaker.
4. Conclusions
The nonlinear coupling response of flame dynamics and acoustic excitation in an acoustically
excited standing wave tube is determined using a chemiluminescence emission measurement
system and a PIV system. The acoustic excitation leads to change in the observed flame oscillation
frequency and the flow structure evolutions for excitation signals of different amplitudes for
different equivalence ratios.
The frequency analysis of the flame oscillation indicates that flame/acoustic coupling behaviour
results in nonlinear flame dynamics. In the acoustic velocity anti-node region, both the natural
flickering frequency and the excitation frequency of the flame dominate the flame behaviour for a
diffusion flame at 0.3 V. For a premixed flame, excitation forcing is the only factor that affects the
flame dynamics and no coupling behaviour is detected at such a low intensity. When the voltage
amplitude is raised to 2 V, the excitation frequency (fe) is accompanied by nonlinear fore and aft
frequency peaks. In the premixed flame, these complementary frequency peaks are shown to have
a relationship of fe ± fe/5. For the diffusion flame, it is found that the excitation frequency is coupled
with both the sub-harmonic frequency of the excitation frequency (fe/5) and the natural flame
oscillating frequency (ff). At higher excitation intensities, the natural frequency and the
11
A phase-locked PIV system is used to determine the flow characteristics for a propane-air flame.
The results show that the effect of acoustic excitation on the flame dynamics decreases as the
air-fuel flow rate is increased, because the combination of the initial flow velocity and the buoyancy
effect of the flame counters the acoustic perturbation. Therefore, a chaotic flow pattern is only
observed in the I
flow simply follows the oscillation of the acoustic flow field. The vorticity contour maps match well
with the velocity data, because the acoustic flow and the hot gas flow create opposing velocity
components and form strong vortices.
This study demonstrates that the complex flame response complies with nonlinear theory and the
observed frequency peaks are not random, but represent the nonlinear coupling modes of the
excitation source and the flame instability oscillation. In acoustic excited flames, it can be shown
that acoustic forcing results in response components at frequencies other than the excitation
frequency. The observed nonlinear frequency modes are explained by nonlinear theory. An
explanation of the physical mechanisms that are involved in the formation of these nonlinear
frequency modes is given. For a practical combustion device, such as a gas turbine combustor, a
study of the various frequency peaks and the relationships between them would be worthwhile.
Acknowledgement
12
References
[1] Chao, Y.-C. and Ming-Shan, J., Behavior of the lifted jet flame under acoustic excitation,
Symposium (International) on Combustion 1992; 24: 333-340.
[2] Baillot, F. and Demare, D., Physical mechanisms of a lifted nonpremixed flame stabilized in an acoustic field, Combustion Science and Technology 2002; 174: 73-98.
[3] Toong, T.Y., Richard F, S., John M, S., and Griffin Y, A., Mechanisms of combustion instability,
Symposium (International) on Combustion 1965; 10: 1301-1313.
[4] Demare, D. and Baillot, F., Acoustic enhancement of combustion in lifted nonpremixed jet flames, Combustion and Flame 2004; 139: 312-328.
[5] N. NOIRAY, D. DUROX, T. SCHULLER, and S. CANDEL, A unified framework for nonlinear combustion instability analysis based on the flame describing function, Journal of Fluid Mechanics 2008; 615: 139-167.
[6] Farhat, S.A., Ng, W.B., and Zhang, Y., Chemiluminescent emission measurement of a diffusion flame jet in a loudspeaker induced standing wave, Fuel 2005; 84: 1760-1767.
[7] Saito, M., Sato, M., and Nishimura, A., Soot suppression by acoustic oscillated combustion,
Fuel 1998; 77: 973-978.
[8] Kim, K.T., Lee, J.G., Quay, B.D., and Santavicca, D.A., Response of partially premixed flames to acoustic velocity and equivalence ratio perturbations, Combustion and Flame 2010; 157: 1731-1744.
[9] Kartheekeyan, S. and Chakravarthy, S.R., An experimental investigation of an acoustically excited laminar premixed flame, Combustion and Flame 2006; 146: 513-529.
[10] Bourehla, A. and Baillot, F., Appearance and Stability of a Laminar Conical Premixed Flame Subjected to an Acoustic Perturbation, Combustion and Flame 1998; 114: 303-318.
[11] Williams, T.C., Shaddix, C.R., Schefer, R.W., and Desgroux, P., The response of buoyant laminar diffusion flames to low-frequency forcing, Combustion and Flame 2007; 151: 676-684.
[12] Huang, H.W., Wang, Q., Tang, H.J., Zhu, M., and Zhang, Y., Characterisation of external acoustic excitation on diffusion flames using digital colour image processing, Fuel 2012; 94: 102-109.
[13] Chen, L.W., Wang, Q., and Zhang, Y., Flow characterisation of diffusion flame in a standing wave Experimental Thermal and Fluid Science 2012; 41.
[14] Chen, L.W., Flow Characterisation of Flames in an Acoustically Excited Chamber, in
Department of Mechanical Engineering. 2012, University of Sheffield, Sheffield. p. 214.
13
14
Table
Table 1. Propane/air flow parameters in the experiment.
Equivalence ratio (Ø)
Air mass flow rate (kg/s)
Fuel mass flow rate (kg/s)
Air flow rate (ml/min)
Fuel flow rate (ml/min)
Velocity (m/s)
1.5 1.82×10⁻⁵ 1.75×10⁻⁶ 910 55 1.28
3 9.10×10⁻⁶ 1.75×10⁻⁶ 455 55 0.67
[image:15.595.88.507.147.280.2]15
[image:16.595.167.427.391.680.2]Figures
Fig. 1. The schematic layout of the experimental apparatus.
Fig. 2. Propane-air flame images at different equivalence ratios and at the excitation frequency of
16
17
Fig. 4. Velocity vectors and the vorticity contour maps of the instantaneous propane-air flame flow