This is a repository copy of Development of DLC coating architectures for demanding functional surface applications through nano- and micro-mechanical testing.
White Rose Research Online URL for this paper: http://eprints.whiterose.ac.uk/87850/
Version: Accepted Version
Article:
Beake, BD, Liskiewicz, TW, Vishnyakov, VM et al. (1 more author) (2015) Development of DLC coating architectures for demanding functional surface applications through nano- and micro-mechanical testing. Surface and Coatings Technology, 284. pp. 334-343. ISSN 0257-8972
https://doi.org/10.1016/j.surfcoat.2015.05.050
© 2015, Elsevier. Licensed under the Creative Commons Attribution-NonCommercial-NoDerivatives 4.0 International http://creativecommons.org/licenses/by-nc-nd/4.0/
[email protected] https://eprints.whiterose.ac.uk/ Reuse
Unless indicated otherwise, fulltext items are protected by copyright with all rights reserved. The copyright exception in section 29 of the Copyright, Designs and Patents Act 1988 allows the making of a single copy solely for the purpose of non-commercial research or private study within the limits of fair dealing. The publisher or other rights-holder may allow further reproduction and re-use of this version - refer to the White Rose Research Online record for this item. Where records identify the publisher as the copyright holder, users can verify any specific terms of use on the publisher’s website.
Takedown
If you consider content in White Rose Research Online to be in breach of UK law, please notify us by
1
Development of DLC coating architectures for demanding functional surface
applications through nano- and micro-mechanical testing
B.D. Beake1,*, T.W. Liskiewicz2, V.M. Vishnyakov3 and M.I. Davies1
1
Micro Materials Ltd., Willow House, Yale Business Village, Ellice Way, Wrexham, LL13
7YL, UK
2
Institute of Functional Surfaces, School of Mechanical Engineering, University of Leeds,
Woodhouse Lane, Leeds, LS2 9JT, UK
3 School of Computing and Engineering, University of Huddersfield, Queensgate,
Huddersfield, HD1 3DH, UK
2
Abstract
DLC coatings can combine high hardness with low friction. However, they are often
deposited with high levels of intrinsic stress and display low adhesion strength resulting in
poor performance in demanding applications. A highly topical challenge is to develop
advanced DLC coatings capable of withstanding more demanding applications in the
automotive, cutting tools, MEMS and oil and gas sectors. The results from several
nanomechanical and tribological test techniques - nanoindentation, scratch and
nano-fretting (nano-wear) - can be used together to aid the design of DLC coating architectures for
enhanced durability in specific applications. In this study the behaviour of multilayered DLC
coatings (Cr/W-C:H/a-C:H, Cr/W-C:H/Si-a-C:H) was compared to that of CrN/a-C:H:W
(WC/C). We have previously reported that in nano-wear tests the coating with the highest
hardness and H/E displayed greater wear resistance [T.W. Liskiewicz et al, Surf. Coat.
Technol. 237 (2013) 212]. By employing nano- and micro-scale tribological testing with
probes of differing sharpness it is possible to change the sensitivity of the test to probe the
response of the coating top layer or the entire multilayer coating-substrate system. In the
nano-scratch tests using a spherical indenter with a 5 m end radius the maximum stresses
are located well within the top layer of the multilayer coatings and consequently the
mechanical properties of this top layer dominate the nano-tribological behaviour. In the
micro-scratch using a 25 m spherical probe the stress field extends further towards the
sub-layers and steel substrate and consequently the behaviour is completely different. Under these
conditions the coating with the lowest hardness and H/E showed improved performance with
higher critical loads for cracking and total coating failure. High resolution SEM imaging has
been used to investigate this further. A simple contact model strongly suggests that cracking
and failure events occur on the harder coatings when the maximum von Mises stress was
3
1. Introduction
Diamond-like carbon (DLC) is a metastable form of amorphous carbon and has a mixture of
sp3 and sp2 bonding and the mechanical properties of DLC films vary with sp2/sp3 ratio [1]. A
wide range of available amorphous carbon coating architectures and a number of possible
deposition methods allow tailoring of the coating functionality to many demanding functional
surface applications. DLC coating properties include high hardness, low friction, electrical
insulation, anti-corrosion, chemical inertness, optical transparency, biological compatibility,
ability to absorb photons selectively, smoothness and resistance to wear. Hence, DLC
coatings have found many practical applications across industrial sectors, including razor
blades, computer hard drives, silicon solar cells, MEMS applications, orthopaedic implants,
optical lenses, and finally cutting tools and internal combustion engine components [2].
Improved resolution and efficiency of DLC coating testing techniques is needed for
development of new demanding applications and accurate nano-mechanical characterisation
is a critical step in DLC coating efficient optimisation. Analytical tools for nano-scale
materials testing have rapidly developed over the last decades and integration of
measurement data obtained from nano-mechanical testing provides reliable inputs to
improved predictive coating wear models [3,4].
In order to tailor DLC coatings for demanding functional surface applications it is necessary
to optimise the coating tribological behaviour, which has been extensively studied in the
literature. Gies et al. deposited homogeneous and gradient a-C:H:W coatings on steel and
determined their mechanical properties using nanoindentation and reciprocating wear test
with nanometre resolution [5]. The authors showed better performance in micro- and
macro-wear tests of the gradient coating systems and proposed an improved macro-wear model taking into
4
Arnell looked at running-in behaviour of DLC coatings using ball-on-disk apparatus [6]. A
classical running-in wear curve with a transition in wear rate from a high initial rate to a low
rate with sliding was observed. It was also found that variations in friction coefficient with
sliding distance were not related with this transition in wear rate and a transfer film was
rapidly developed on the uncoated ball surface. Gåhlin et al. reviewed and discussed ME-C:H
coatings applications in motor vehicles [7]. They found out that over time, Me-C:H coatings
contributed to significant decrease of friction and dramatic increase of wear resistance and
resistance to seizure in these applications. More recently, Zeng et al. compared three types of
high wear resistant carbon composite coatings by exploring the influence of a
sputter-chemical vapour deposition hybrid process on coating properties [8]. The authors showed that
it possible to optimise the deposition process by using pure Argon atmosphere resulting in
coating with exceptionally high load-bearing capacity and excellent wear resistance attributed
to its excellent adhesion, high toughness and low friction coefficient.
The authors of this paper have also performed a more complete characterisation of carbon
coatings by combining the results of the nanoindentation tests with additional
nano-mechanical and nano-tribological test capability, namely nano-scratch, nano-impact and
nano-wear [9-11]. These tests provided complementary information about the durability of
DLC films in these more complex mechanical loading situations. It was shown that substrate
yield can play a key role in the nano-tribological behaviour, particularly for ultra-thin films
on Silicon. By performing repetitive nano-scratch tests at a sub-critical load it was possible to
tune the maximum stress close to the coating-substrate interface so that the test was more
sensitive to high stress in the film and at the interface.
In this paper the behaviour of three multi-layered DLC coatings is studied by
nanoindentation, nano-scratch and micro-scratch testing. The multilayered coatings were
5
and Cr/W-C:H/Si-a-C:H coating systems the adhesion layer is a thin Cr and then gradient
layers are applied to adapt the E-modulus of the soft substrate to the E-modulus of the hard
top coating, thus giving the coating both abrasive wear resistance and impact fatigue wear
resistance (flexibility/toughness). In the WC/C system the hard CrN sublayer provides load
support and improved adhesion. Nanomechanical characterisation provides detailed
mechanical property data including the elastic modulus and plasticity of the coating systems
in addition to hardness determination. The nanomechanical properties of DLC films
commonly show a strong correlation with the wear resistance of the DLC films in dry sliding
or impact conditions. Nanotribological characterisation by nano- and micro-scratch testing
with the modelling approach described provides direct access to the contact pressure so that
peak stresses can be determined. The ratio of the hardness to modulus (H/E) has been found
to correlate with tribological behaviour more closely than hardness alone with several reports
of higher H/E being generally beneficial in sliding/abrasion [12-14]. In this work the
relationship between the plasticity index (PI) and the ratio of hardness to reduced modulus
(H/Er) has been investigated for the different coatings. The correlation with H/Er rather than
H/E is explored in this publication since it is Er rather than E that is directly determined from
the unloading curve analysis using non-rigid indenters. By employing nano- and micro-scale
tribological testing with probes of differing sharpness it is possible to change the sensitivity
of the test to probe the response of the coating top layer or the entire multilayer
coating-substrate system. High resolution SEM imaging has been used to provide further details on
the deformation mechanisms and a simple contact model correlating the position of the
maximum in the von Mises stress with the coating-substrate interface is explored. In the
nano-scratch tests using a spherical indenter with a 5 µm end radius the maximum stresses
are located well within the top layer of the multilayer coatings and consequently the
6
micro-scratch using a spherical indenter with a 25 µm end radius the stress field extends
further towards the sub-layers and steel substrate. With increasing load the maximum stress
can be positioned at different interfaces in the multilayer system to investigate any potential
deficiencies in adhesion between different layers.
2. Experimental
2.1 Materials
A series of three DLC coatings with varied mechanical properties was deposited on M2 grade
steel substrates for this study. Multilayer coatings with a-C:H and Si-a-C:H top layers were
deposited using the industrial scale PECVD Flexicoat 850 system (Hauzer Techno Coating,
the Netherlands) in the Advanced Coatings Design Laboratory in School of Mechanical
Engineering at the University of Leeds while a multilayer WC/C was a commercial coating,
Balinit C Star, obtained from Oerliken Balzers company. The a-C:H and Si-a-C:H coatings
deposited with chromium and graded tungsten carbide interlayers in order to enhance
adhesion between the DLC coating and the substrate. The Cr layer was deposited using
magnetron sputtering, while the WC layer was deposited using magnetron sputtering with the
gradual introduction of Acetylene gas to the complete PACVD stage, thus creating a
functional gradient layer in one continuous deposition process. Additionally, Si-a-C:H was
doped with silicon using hexamethyldisiloxane (HDMSO) precursor. According to Oerliken
Balzers specification, Balinit C Star is applied in a single-pass vacuum process at
temperatures between 180 and 350 °C, resulting in homogeneous coating structure. Thickness
of the coatings was assessed using Calotester (Tribotechnic, France) employing abrasion ball
cratering testing method. Full details of the coating architecture are given in Table 1 below,
7
[Table 1 about here]
2.2 Nanoindentation, nano-scratch and micro-scratch testing
Nanoindentation, nano-scratch and micro-scratch testing were performed using the NanoTest
Vantage (from Micro Materials Ltd., Wrexham, UK). Nanoindentation experiments were
performed in order to characterise the hardness and Young’s modulus of the coatings. ISO
14577-4 recommends that measurements should be made across a range of indentation loads
to enable film-only values of hardness and elastic modulus to be determined. In particular, it
cautions that measurements at an indentation depth of 10 % of the film thickness provide a
good estimate of the coating hardness but will contain some contribution from the elastic
properties of the underlying substrate. The experiments were performed on the three coatings
with a sharp Berkovich indenter to peak loads of 1, 3, 5, 10, 20, 30, 40, 50…100 mN with 10
repeats for each load. The loading time was 20 s with a hold of 5 s at peak load before
unloading in 20 s. Data were corrected for thermal drift using hold periods of 60 s prior to the
load ramp and after 90 % unloading. The area function of the indenter and frame compliance
were calibrated using fused silica and single crystal tungsten reference samples. Hardness,
reduced modulus, elastic work (We) and plastic work (Wp) were measured over the contact
depth range corresponding to 1-100 mN so that the relationship between the plasticity index
(PI), the H/Er and the apparent constant of proportionality in Equation 1 when using a
Berkovich indenter could be determined.
PI = Wp/(Wp + We) = 1 – x(H/Er) [Eqn. 1]
where x is a constant and Er is the reduced indentation modulus.
Progressive load (3-scan, topography-scratch-topography) nano-scratch tests to 500 mN were
8
calibrated by spherical indentation testing on fused silica. The nano-scratch procedure
involved 3 sequential scans, topography-scratch-topography, at 2.5 m/s, always in the same
direction. These were (i) pre-scan: scanning at 0.1 mN over a 500 m track (ii) progressive
load scratch: the load is low (0.1 mN) over the first 50 m scan then ramping at a constant
rate of 2.9 mN/s to reach 500 mN just before the end of the scan (iii) post-scan, with the same
low load as the pre-scan. 5 scratch tests were done on each coating with adjacent tracks
separated by 100 m. By performing three-scan progressive load nano-scratch tests it is
possible to determine the critical load for the onset of non-elastic deformation since this is the
load at which the residual scratch depth is no longer zero.
Micro-scratch testing to 5 N was performed using a similar 3-scan procedure using a
spheroconical diamond probe of end radius 25 m. The probe radius was calibrated by
spherical indentation testing on fused silica. The procedure involved 3 sequential scans,
topography-scratch-topography, at 20 m/s, always in the same direction. These were (i)
pre-scan: scanning at 10 mN over a 1000 m track (no wear occurs at this load with a 25 m
probe) (ii) progressive load scratch: the load is low (10 mN) over the first 50 m scan then
ramping at a constant rate of 107 mN/s to reach 5 N just before the end of the scan (iii)
post-scan, with the same low load as the pre-scan. 5 scratch tests were done on each sample, with
adjacent tracks separated by 100 m. Sample roughness was determined over a 330 µm scan
length taken from the pre-scans. The Ra surface roughness was found to be 10.9, 11.3 and
11.5 nm for the a-C:H, Si-a-C:H and a-C:H:W coatings respectively (mean values are
averages of five repeats). Friction was also measured during the nano- and micro-scratch tests
using calibrated tangential force sensors. A Zeiss Supra40VP Field Emission Gun SEM
system was used for high-resolution microscopic analysis of the nano- and micro-scratch
9
The probe depth data (either on-load or residual) are shown (in figure 4(b-c)) after removal of
any slope, topographic and the instrument compliance contribution to the measured
deformation, i.e. true depth data. The mean pressure during the nano- and micro-scratch tests
was estimated by the application of a Hertzian treatment previously applied to the
nano-scratch testing of carbon films with spherical probes [15,16]. The method enables the yield
stresses and the pressure required for the failure of the film to be estimated from contact
mechanics, assuming the geometry of indentation, provided spherical indenters are used. The
contact depth (hc) in a spherical indentation contact is given by
hc = (ht + hr)/2 [Eqn. 2]
where hc is the contact depth, ht is the on-load scratch depth and hr is the residual depth from
the final scan. The contact radius (a) is determined from Equation 3, where R is the indenter
radius.
a = (2Rhc-hc2) [Eqn. 3]
Pm = L/a2
[Eqn. 4]
The contact pressure, Pm, at any point along the scratch track is given by equation 4, where L
is the applied load. To apply this approach to the nano-scratch data it is necessary to assume
that: (i) the presence of a tangential load does not influence the pressure distribution too
greatly so that the measured friction coefficient is well below 0.3 (ii) the radius of the
indenter is constant (iii) the sliding speed is sufficiently slow and contact sufficiently close to
10
bottom of the scratch track in the final topographic scan. It is also important that the test
instrumentation has sufficiently high lateral rigidity (as the NanoTest Vantage) so that when
using a sensitive friction transducer the scratch track is not significantly affected by surface
roughness. The method has previously been validated for DLC films deposited on Silicon
with good agreement found between scratch track widths determined from the analytical
method and assessed by microscopic examination [16].
3. Results
3.1 Nanoindentation
Nanoindentation revealed clear differences in mechanical behaviour between the different
DLC coatings. As an illustration the results from tests to 40 mN peak load are shown in Table
2. The a-C:H coating had the highest hardness, modulus, H/Er, H3/Er2and lowest plasticity
index. Measurements of hardness and reduced modulus vs. depth [previously reported in ref.
3] show that the hardness of the three coatings decreases at very low indentation depths,
reflecting non-fully developed plasticity in the contact (i.e. the mean pressure developed in
the contact is less than the actual hardness of the film, as described in detail in ISO14577-4).
The measured reduced elastic modulus increases with increasing indentation depth for
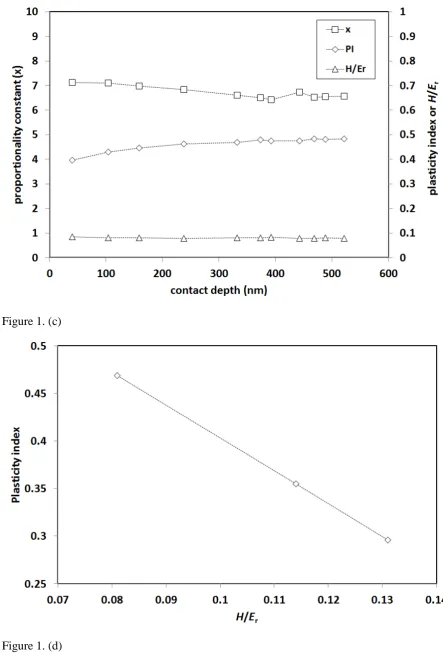
Si-a-C:H and a-Si-a-C:H:W but slightly decreases for a-Si-a-C:H. The depth-dependence of the relationship
between plasticity index (PI), H/Er and the apparent constant of proportionality when using a
Berkovich indenter is shown in Figure 1(a-c). The relationship between PI and H/Er for the
coatings at a contact depth of 300 nm is shown in Figure 1(d). There is a linear relationship
over this range of H/Er with R2 = 1.
11 3.2 Nano-scratch tests with R = 5 µm probe
The critical load (Ly) was determined from the depth data as the load where the residual
corrected depth is non-zero.
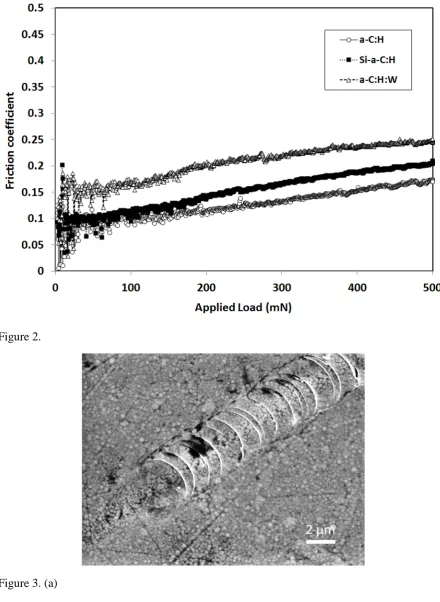
[Fig. 2 and Table 3 about here]
The load-dependence of friction coefficient in nano-scratch test using R = 5 µm probe is
shown in Figure 2. The friction coefficient at yield is shown in Table 3. SEM images are
shown in Figure 3. The a-C:H and Si-a-C:H show semi-circular cracks at the rear of the
contact extending across the entire scratch track. For coatings A and B the onset of cracking
at Lc1 was accompanied by an inflexion in the residual depth data. The inflexion in depth was
more pronounced on the a-C:H coating. Lc1 values were (422 ± 4) mN and (445 ± 12) mN for
a-C:H and Si-a-C:H respectively. a-C:H:W did not show Lc1 failure before 500 mN. The Lc2
failure (total failure of the coating) was not reached before 500 mN on any of the coatings.
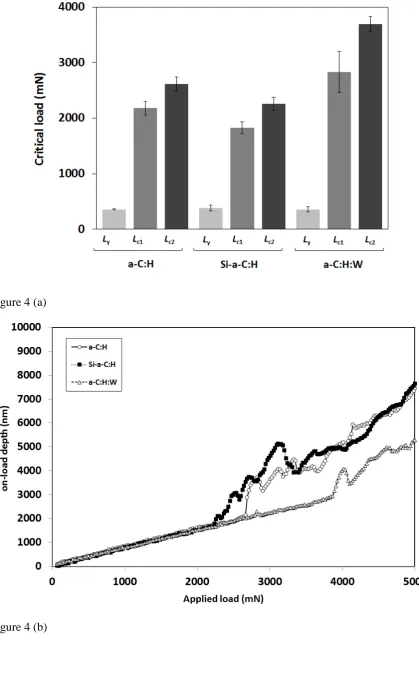
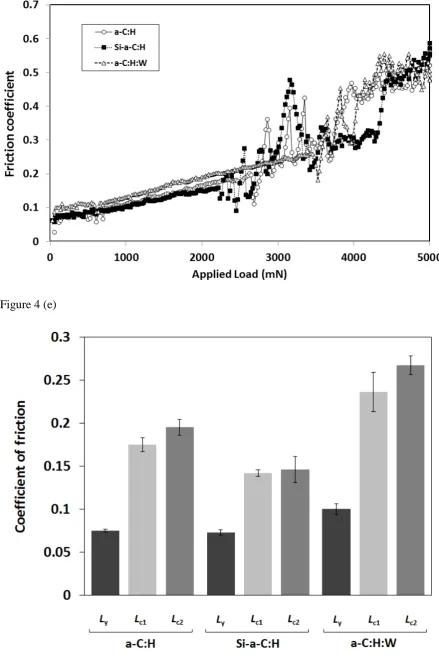
3.3 Micro-scratch tests with R = 25 µm probe
Figure 4 (a) shows (a) the Lc1 and Lc2 critical loads for each of the three coatings. The ranking
is the same for both critical loads, with the highest values on a-C:H:W and the lowest on
Si-a-C:H. Fig. 4 (b)-(e) show illustrative behaviour from a test on each of the coatings. Fig. 4 (b)
shows the on-load probe depth, (c) residual depth, (d) the corresponding load-dependence of
elastic recovery. Fig 4.(e) shows the variation in friction coefficient with applied load. Prior
to Lc1 failure the on-load and residual depth data are very similar for all three coatings (fig.
4(b-c)). The dependence of the friction at Ly, Lc1 and Lc2 is summarised in Fig. 4 (f). The
frictional response of a-C:H and Si-a-C:H is very similar frictional behaviour, with friction
12
higher friction of (0.100 ± 0.006) at yield. The friction coefficient gradually increases with
applied load following the same trend for all the coatings (figure 4 (e)), with the data on
a-C:H:W being about 0.03 higher.
Figure 5 shows SEM images of micro-scratch tracks. A complex deformation with cracks in
front, behind and at the side of the contact zone is observed on a-C:H (fig. 5(a)). The crack
pattern on a-C:H:W is very different to that on the other two coatings. A network of fine
cracks is produced that appears to follow the microstructure. Although there is spallation and
chipping outside the scratch track it appears reduced in comparison to that observed on the
a-C:H and Si-a-a-C:H coatings.
[Table 4 about here]
4. Discussion
4.1 Nanoindentation and plasticity
There was a marked correlation between the nanomechanical behaviour of the coatings and
their tribological response in nano- and micro-scale scratch testing. Nanoindentation data at
different peak loads contain differing elastic contribution from the M2 substrate (and
sub-layers). The measured reduced elastic modulus increases with increasing indentation depth
for Si-a-C:H and a-C:H:W but slightly decreases for a-C:H. This is due to the influence of the
steel substrate which is stiffer than Si-C:H or C:H:W but slightly lower modulus than
a-C:H. To obtain accurate values of the elastic modulus of the top layer, it is necessary to
remove this substrate component which exists even when indenting to 1/10 of the coating
thickness. Measurements at a range of indentation depths are extrapolated to zero depth to
13
reduced indentation moduli for the top-layer were 202, 140 and 130 GPa (which correspond
to Young’s moduliof 235, 153 and 140 GPa respectively assuming the Poisson’s ratio of the
film is 0.2). The relationship between plasticity index and H/Er (Equation 1) was investigated
over a wide load range (fig. 1 (a-c)). Although similar relationships could be determined for
H/E instead of H/Er we have chosen to report H/Er since this is the primary output from the
nanoindentation curve and so does not require exact knowledge of the coatings’ Poisson’s
ratios. On these coatings H/Er varied little with load over this depth range so changes in
plasticity and proportionality constant primarily reflect the effect of changing indenter
geometry over this depth range. There appear to be two regimes with x being constant above
about 250 nm and increases as the depth is reduced below this. For loads and penetration
depths where the indenter is self-similar the relationship between H/Er and plasticity is robust
and the apparent constant varies very little across a wide load range. However, at smaller
depths the rounding of the Berkovich indenter influences this relationship and lower plasticity
and higher values of x are found. Figure 1(d) shows the relationship at a contact depth of 300
nm where x is constant vs. depth so the rounding of the Berkovich is not significant. The type
of DLC influences the value of the proportionality constant. The a-C:H coating has a
plasticity index of 0.30 and x ~5.4, Si-C:H has plasticity index of 0.36 and x ~5.7 and
a-C:H:W has a plasticity index of 0.48 and x ~6.5. Since it relates the H/Er in the contact to the
plasticity index the proportionality constant contains a contribution from the substrate (x ~6.6
for hardened steel). At low relative indentation depth the substrate contribution is minimal
and the observed differences in x are due to differences in coating properties. FE analysis has
predicted x ~5 [17-18] whilst for bulk materials experimental evidence suggests that x ~ 5 for
glasses and x ~6-7 for metals [19-20]. For hard coating systems x has been reported to be
~6.4 on TiN-based nanocomposites [21] and 5.7 on TiAlCrN/TiAlCrSiYN multilayers [22].
14
essentially contain the same information and can be used interchangeably [19-20]. However,
although they are well correlated there appear to be some subtle differences. The three
coatings studied here show slightly lower PI than hr/hm with the difference being greatest for
a-C:H, i.e. the coating with highest H/E (max. difference = 0.05). The reasons for the
different values of x between the coatings are that the equation is not exact and deviations
become more apparent at higher H/E. There may also be some influence from surface
roughness, pile-up/sink-in or the fact that the energy based equations use the energy to the
maximum depth whilst hardness from unloading curve analysis is determined at the contact
depth [23].
Although much softer than nitride coatings such as TiAlN, the a-C:H:W coating has similar
plasticity and x. It can be considered as metal-doped and in terms of plasticity it has the
character of more ceramic coating which may well be connected to its high load carrying
capacity without cracking in highly loaded contact. DLC coatings typified by the a-C:H
coating are hard and elastic, having high H, H/E and Y/E. Tabor determined a constraint
factor C, connecting hardness and yield stress according to H = CY [24]. Based on
experiments on metals a value of 2.8 was found to be a good fit experimentally. However, for
higher Y/E materials such as the coatings tested here much lower values are found.
The Si-a-C:H and especially a-C:H:W coatings have lower hardness and higher plasticity, a
combination which has been associated with improved crack resistance in scratch testing in
amorphous hydrogen-free carbon coatings [25-28]. Although the a-C:H:W coating is softer it
has a higher threshold for cracking when tested with R = 5 and 25 m probes. Plastic flow
can be considered as the major source of stress relaxation in the coating system. Although
plasticity is not the same as toughness, as discussed in detail elsewhere [19, 21, 26-28],
15
fracture toughness is associated with high H3/E2 then this appears to be a consequence of the
higher load-support (the critical load for plastic flow is connected to H3/E2) so that for a given
load the total deformation is lower so the bending stresses in the coating are reduced rather
than intrinsic structural toughening.
4.2 Nano-scratch behaviour (R = 5 m)
Based on Johnson’s contact mechanics analysis the critical load should scale with H3/E2 on
bulk materials [12, 30]. For these coatings there was a strong but non-linear dependence on
H3/E2 and H/E (Tables 2 and 3). The coating yield stress has been estimated from the
nano-scratch test data. The Hertzian analysis is well suited to the nano-nano-scratch testing of DLC films
with spherical probes with an end radius of 5 µm or greater due to their intrinsic low friction
and high H/E so that contact remains elastic or close to it over a wide load range. Plastic
deformation in the sample beneath a spherical indenter can be first expected to occur when
Pm ~1.1Y at a depth of ~0.47a [24, 29, 30]. The mean pressure at yield (Pm) has been
converted to a yield stress, Y, using the relationship that Y = Pm/1.1. Table 5 shows a
comparison between the yield stress determined from the nano-scratch tests with the 5 micron
probe and the yield stress determined from an analytical analysis of the nanoindentation test
data with the Berkovich indenter. Although the indenter geometry in the two types of tests is
different, in both cases the yield occurs well within the coating. The simplifying assumptions
that (i) the test probe radius is constant vs. depth (ii) that friction was sufficiently low that the
stress field is not too different from that in a spherical indentation (iii) the lateral rigidity of
the instrumentation is high enough, are well met. There is reasonably good agreement,
especially for Si-a-C:H and a-C:H:W.
16
Although at yield the depth under load is highest on the a-C:H (Table 3), as the yield occurs
at markedly different critical loads on the three coatings this reflects the much higher critical
load for this coating (206 mN). When comparing the depth at a given applied load then the
trend is reversed and a-C:H shows the smallest on-load and residual depths.
4.3 Micro-scratch behaviour (R = 25 m)
By employing a larger radius test probe is possible to change the sensitivity of the test to
probe the response of the entire multilayer coating-substrate system. The feasibility of this
has been investigated by Schwarzer and co-workers for scratch testing thicker monolayer and
multilayer coating systems on cemented carbide where the total thickness of the coating
layers was 10-11 m with test probe radii the range 20-200 µm [31]. For the instrumentation
used in that study it was reported that the combination of high surface roughness of the
coatings and insufficient resolution made it impossible to detect the onset of plastic flow. In
contrast, in this current study the DLC coatings were smoother and the test instrumentation is
optimised for nano-/micro-scale testing having high sensitivity and lateral rigidity so that it is
trivial to determine reliably the critical load for plastic flow from the point at which the
residual depth is no longer zero. On other coating systems and bulk materials (e.g. thin
carbon coatings on Si, Si [9-11]) we have found no evidence that any significant yield occurs
below this and have reported good agreement between the mean pressures determined at
yield both with literature and the results of nanoindentation tests.
In contrast to the behaviour with the R = 5 m probe the yield and failure pressures with the
R = 25 m probe are increasingly dominated by substrate deformation. The maximum von
Mises stress at Ly is located at a depth well within the top coating layer. However, it is likely
17
higher for the a-C:H coating despite its much higher hardness since the significant part of the
deformation is due to elastic deformation of the substrate. The a-C:H:W coating showed
higher load support without cracking. The higher Lc1 and Lc2 do not equate to significantly
greater mean pressure in the contact, but due to the higher load the stress field was able to
develop deeper into the substrate before the onset of cracking.
In a tribological system toughness may be at least as important as hardness. An interesting
concept for providing a qualitative assessment of differences in coating toughness has been
proposed by Zhang and co-workers [28, 32, 33]. They equated Lc1 with the resistance to the
initiation of cracks and (Lc2-Lc1) as a measure of the toughness (Lc2 = load for total failure).
They defined a parameter representing resistance to crack initiation and also propagation as
follows (Eqn. 5):-
scratch crack propagation resistance parameter (CPR) = Lc1(Lc2-Lc1) [5]
Although absolute values of this parameter, later called “scratch toughness” [28], are highly
dependent on the radius of the test probe nevertheless it can provide a useful qualitative
assessment of coating response. The CPR values were (1.0 ± 0.4), (0.8 ± 0.2) and (2.3 ± 0.7)
N2 for the a-C:H, Si-a-C:H and a-C:H:W coatings respectively. Higher Lc1 and Lc2 correspond
to a tougher coating despite having lower H3/E2. There is a correlation between H3/E2 and
failure with lower H3/E2 coatings being able to deform more elastically prior to the Lc2
failure. Zhang and co-workers have studied several metal-doped nc-MenN/a-SiNx coating
systems where improved scratch toughness was found to be at the expense of hardness
[26-28]. In nano-scratch testing it is commonly observed for a hard coating deposited on a hard
and brittle substrate that higher hardness, H/E and H3/E2 is correlated with lower scratch
depths at low load but a lower Lc2. Reported examples of coating systems showing this
18
~0.8 m nc-TiN/a-SiNx on Si in nano-scratch testing with a R = 3 m probe [34]. When
micro-scratch testing of hard nitride coatings on cemented carbide the on-load scratch depths
do not vary significantly with coating properties but the same trend of higher hardness, H/E
and H3/E2 being connected with a lower Lc2 is also commonly found [21, 35-37].
[Table 6 about here]
4.4 Deformation mechanism in the scratch test
To further understand the interrelationships between plasticity, load support, scratch recovery
and cracking a simple contact model has been applied to estimate the magnitude and location
of the maximum von Mises stress at the different critical loads for each of the coatings in the
micro-scratch test. The mean pressure vs. applied load determined by the Hertzian analysis of
micro-scratch test data is shown in Figure 6 (a). The mean pressure at yield is around 14-16
GPa. As the applied load increases the decrease in pressure towards ~12 GPa is due to a
greater contribution from the softer layers and substrate together with added complexity from
cracking/yield.
The analysis suggests that at the Lc2 failure the maximum von Mises stress is located below
the free surface at a depth of around 3.9, 3.7 and 4.8 m for the C:H, Si-C:H and
a-C:H:W coatings respectively (Table 6, figure 6 (b)). As a first approximation the compressive
plastic strain in these coatings can be assumed to be minimal due to the large radius of the
probe used in the test. Haq and co-workers showed that in indentation of DLC films with a 5
m spherical indenter the localised compressive plastic strain determined by cross-sectional
transmission electron microscopic analysis (XTEM) is relatively low (~4%) compared to that
19
XTEM studies by Haq and co-workers clearly shows that the influence of indenter geometry
is greater than that of coating thickness [38-41]. In the micro-scratch test the indenter radius
was 25 m so compressive strain in the coating should be minimal. The maximum in von
Mises stress appears to coincide with the location of the adhesive layer-gradient layer
boundary at the Lc1 failure on the a-C:H and Si-a-C:H coatings. The maximum in von Mises
stress appears to coincide with the location of the substrate-adhesive layer boundary at the Lc2
failure on the a-C:H and Si-a-C:H coatings.
Although we have made some simplifying assumptions it does appear that for the a-C:H and
Si-a-C:H coatings the Lc1 and Lc2 events may occur when the maximum stress is closer to
interfaces in the multilayer structure. In contrast, for the a-C:H:W coating the Lc1 and Lc2
events both occur when the stress maximum is far into the substrate. Schwarzer and
co-workers have proposed [31] that (i) plastic flow occurs wherever the critical von Mises stress
is exceeded (ii) with increasing load this plastic zone grows until it reaches the interface
between the coating and the substrate weakening the integrity of the system (iii) if
additionally high tensile stresses at the surface coincide with this weakening then mode-I
fractures could propagate to this interface resulting in global coating failure by shearing off
large areas (the observed critical load). The failure mechanism on the a-C:H and Si-a-C:H
coatings appears to follow a broadly similar progression. Between Ly and Lc1 the plastic zone
grows with cracking occurring when the maximum von Mises, i.e. weakening, stress being
centred on the interface between the bonding layer and the graded layer. The cracking at the
rear of the moving probe is associated with high tensile stress [42]. It appears that these are
cohesive cracks in the sense that they do not propagate to the interface with the substrate and
cause debonding. As the load is increased further the maximum stress becomes centred on the
interface with the substrate and dramatic debonding occurs. On the a-C:H:W coating the
20
deformation results in the maximum stress being driven into the substrate before cracking
occurs and the more extreme bending of the coating itself may be responsible for the cracking
and film failure.
4.5 Influence of probe geometry and deformation on friction
Although the surface roughness is the same for all three coatings there was a marked
difference in friction between them when testing with the sharper probe. The friction force in
the nano-scratch test can be deconvoluted into its interfacial and ploughing components so
that the interfacial friction can be reported (Eqn. 6):-
total = interfacial + ploughing [Eqn. 6]
The friction coefficient at yield is commonly reported to be ~0.05-0.1 for carbon films when
sliding against spherical diamond probes [9, 42]. Differences in elastic deformation and
plastic ploughing have a marked influence on the evolution of the friction vs. load in the
nano-scratch test. Lower deformation on the a-C:H and Si-a-C:H coatings results in a smaller
ploughing contribution to the total friction. The ploughing contribution is small at yielding,
nevertheless differences remain so it can be inferred that the lower total friction on coating A
is due to both lower ploughing and lower interfacial friction.
The use of a larger radius probe enables the ploughing contribution to the total friction to be
minimized so that the interfacial friction can be more accurately determined. The slight
difference (offset by ~0.03) between friction coefficients at yield determined with the 5 and
25 µm probes may reflect surface roughness, change in the location of yield and/or increased
21
probe are initially almost identical for the three coatings so the ploughing contributions to the
total measured friction are the same. This marked difference to the nano-scratch behaviour
where higher hardness reduces deformation and ploughing is due to the larger radius and
more substrate-dominated response. With the 25 m probe the a-C:H and Si-a-C:H coatings
show very similar frictional behaviour, with friction coefficients of 0.07 at the onset of yield.
The a-C:H:W coating has higher friction of 0.1 at the onset of non-elastic deformation
(figure 4 (f)). The variation of friction vs. load follows the same trend for all three, only offset
slightly higher for the a-C:H:W coating (figure 4 (e)). Since the ploughing contribution is
essentially identical the larger total friction on the a-C:H:W is due to a higher interfacial
friction component.
5. Conclusions
There was a marked correlation between the nanomechanical behaviour of the coatings and
their tribological response. By employing nano- and micro-scale tribological testing with
probes of differing sharpness it has proved possible to alter the sensitivity of the scratch test
to probe the response of the coating top layer or the entire multilayer coating-substrate
system. Although a clear relationship exists between the ratio of hardness to reduced modulus
and the ratio of plastic to total work done in the indentation test (the plasticity index), the
apparent constant of proportionality between them varied, being lower for lower plasticity
coatings. Plastic deformation is a major source of stress relaxation in the scratch test and the
coating with higher plasticity index did not crack before the maximum load in the
nano-scratch test was reached. Friction and yield stress were found to strongly depend on the test
probe radius. With a suitable choice of test probe geometry (R = 5 m) the Hertzian analysis
22
estimated by analytical treatment of nanoindentation data. The friction force can be separated
into interfacial and ploughing components. The different contributions to the ploughing
component of the friction in the nano- and micro-scale scratch tests result in a different
dependence of friction vs. load. In the nano-scratch test the coating hardness (and Y/E) affects
the extent of deformation and ploughing. The nano-scratch measurements show that a-C:H:W
has a higher interfacial and ploughing friction force. In the micro-scratch test with the larger
25 µm probe the stress field extends further towards the substrate resulting in similar
deformation (on-load and residual scratch depths) and ploughing contribution to the total
friction force. The maximum von Mises stress appears to coincide with the location of the
adhesive layer-gradient layer boundary at the Lc1 failure and with the location of the
substrate-adhesive layer boundary at the Lc2 failure on the a-C:H and Si-a-C:H coatings. The
a-C:H:W coating with higher plasticity index exhibited much higher critical loads for fracture
(Lc1) and total film failure (Lc2). SEM supports a different failure mechanism for this coating
where enhanced stress relief due to the greater plastic deformation results in the maximum
stress being driven into the substrate before cracking occurs.
6. References
1. J. Robertson, Diamond-like amorphous carbon, Materials Science and Engineering, R
37 (2002), 129-281.
2. Tribology of Diamond-like Carbon Films: Fundamentals and Applications, C. Donnet
and A. Erdemir (Eds.), Springer, 2008.
3. T.W. Liskiewicz, B.D. Beake, N. Schwarzer and M.I. Davies, Short note on improved
integration of mechanical testing in predictive wear models, Surf Coat Technol 237
23
4. N. Schwarzer, Scale invariant mechanical surface optimisation applying analytical
time-dependent contact mechanics for layered structures, (2015) pp287-328 in
Surface Modification Technologies XXVIII, Eds. TS Sudarshan, P Vuoristo and H.
Koivuluoto.
5. A. Gies, T. Chudoba, N. Schwarzer, J. Becker, Influence of the coating structure of
a-C:H:W coatings on their wear-performance: A theoretical approach and its practical
confirmation, Surface & Coatings Technology 237 (2013) 299-304.
6. J. Jiang and R.D. Arnell, On the running-in behaviour of diamond-like carbon
coatings under the ball-on-disk contact geometry, wear 217 (1998) 190-199.
7. R. Gåhlin, M. Larsson, P. Hedenqvist, ME-C:H coatings in motor vehicles, Wear 249
(2001) 302-309.
8. X.T. Zeng, S. Zhang, X.Z. Ding, D.G. Teer, Comparison of three types of carbon
composite coatings with exceptional load-bearing capacity and high wear resistance,
Thin Solid Films 420-421 (2002) 366-370.
9. Nano-scratch, nanoindentation and fretting tests of 5–80 nm ta-C films on Si(100),
BD Beake, MI Davies, TW Liskiewicz, VM Vishnyakov and SR Goodes, Wear, 301
(2013) 575-582.
10.B.D. Beake, T.W. Liskiewicz and J.F. Smith, Deformation of Si(100) in spherical
contacts – Comparison of nano-fretting and nano-scratch tests with nano-indentation,
Surf. Coat. Technol., 206 (2011) 1921-1926.
11.Review of recent progress in nanoscratch testing, BD Beake, AJ Harris and TW
Liskiewicz, Tribology 7 (2013) 87-96.
12.A. Leyland and A. Matthews, On the significance of the H/E ratio in wear control: a
nanocomposite coating approach to optimised tribological behaviour Wear 246,
24
13.A. Leyland and A. Matthews, Design criteria for wear-resistant nanostructured
glassy-metal coatings, Surf. Coat. Technol., 177-178 (2004) 317-324.
14.G.S. Fox-Rabinovich, S.C. Veldhuis, V.N. Scvorstov, L.S. Shuster, G.K. Dosbaeva,
Elastic and plastic work of indentation as a characteristic of wear behavior for cutting
tools with nitride PVD coatings, Thin Solid Films, 469-470 (2004) 505.
15.Ben D. Beake and Tomasz W. Liskiewicz, Nanomechanical characterization of
carbon films, in press.
16.B.D. Beake, S.R. Goodes and B. Shi, Nanomechanical and nanotribological testing of
ultra-thin carbon-based and MoST films for increased MEMS durability, J. Phys. D:
Appl. Phys. 42 (2009) 065301.
17.Y.-T. Cheng and C.-M. Cheng, Relationships between hardness, elastic modulus, and
the work of indentation, Appl. Phys. Lett. 73 (1998) 614-616.
18.Y.-T. Cheng and C.-M. Cheng, Scaling, dimensional analysis, and indentation
measurements, Mater. Sci. Eng. R 44 (2004) 91-149.
19.B.D. Beake, G.S. Fox-Rabinovich, S.C. Veldhuis and S.R. Goodes, Coating
optimisation for high-speed machining with advanced nanomechanical test methods
Surf Coat Technol 203 (2009) 1919-1925.
20.Y. Choi, H.-S. Lee and D. Kwon, Analysis of sharp-tip indentation load-depth curve
for contact area determination taking into account pile-up and sink-in effects, J.
Mater. Res. 19 (2004) 3307-3315.
21.B.D. Beake, S.R. Goodes, J.F. Smith, G.S. Fox-Rabinovich and S.C. Veldhuis, Using
nanomechanics to optimise coatings for cutting tools, in Handbook of Nanostructured
Thin Films and Coatings, Mechanical Properties, Chapter 6, pp205-244, Ed. S Zhang,
25
22.B.D. Beake, G.S. Fox-Rabinovich, Y. Losset, K. Yamamoto et al, Why can
TiAlCrSiYN-based adaptive coatings deliver exceptional performance under extreme
frictional conditions? Faraday Discussions 156 (2012) 267-278.
23.K.K. Jha, N. Suksawang and A. Agarwal, A new insight into the work-of-indentation
approach used in the evaluation of material’s hardness from nanoindentation
measurement with Berkovich indenter, Computational Materials Science 85 (2014)
32–37.
24.D Tabor, The Hardness of Metals, Clarendon Press, Oxford, UK, 1951, ISBN:
0-521-29183-6.
25.B. Shi, J.L. Sullivan and B.D. Beake, An investigation into which factors control the
nanotribological behaviour of thin sputtered carbon films, J Phys D:Appl Phys 41
(2008) 045303.
26.S. Zhang, X.L. Bui, Y. Fu and H. Du, Development of carbon-based coating on
extremely high toughness with good hardness, Int. J. Nanosci. 3 (2004) 571-578.
27.S. Zhang, X.L. Bui, Y. Fu, D.L. Butler and H. Du, Bias-graded deposition of
diamond-like carbon for tribological applications, Diam. Relat. Mater. 13 (2004)
867-871.
28.Y.X. Wang and S. Zhang, Toward hard yet tough ceramic coatings, Surf. Coat.
Technol. 258 (2014) 1-16.
29.A.C. Fischer-Cripps, Critical review of analysis and interpretation of nanoindentation
test data, Surf. Coat. Technol. 200 (2006) 4153-4165.
30.K.L. Johnson, Contact Mechanics, Cambridge University Press, London, UK, 1985,
ISBN: 0-521-34796-3.
31.N. Schwarzer, Q.-H. Duong, N. Bierwisch, G. Favaro, M. Fuchs, P. Kempe, B.
26
32.S. Zhang, D. Sun, Y. Fu and H. Du, Effect of sputtering target power on
microstructure and mechanical properties of nanocomposite nc-TiN/a-SiNx thin films,
Thin Solid Films, 447–8 (2004) 462-467.
33.S. Zhang, D. Sun, Y. Fu and H. Du, Toughness measurement of thin films: a critical
review, Surf. Coat. Technol., 198 (2005) 74-84.
34.B.D. Beake, V.M. Vishnyakov, R. Valizadeh, J.S. Colligon, Influence of mechanical
properties on the nanoscratch behaviour of hard nanocomposite TiN/Si3N4 coatings
on Si, J Phys D: Appl Phys 39 (2006) 1392-1397.
35.G.S. Fox-Rabinovich, B.D. Beake, S.C. Veldhuis, J.L. Endrino, R. Parkinson, L.S.
Shuster, M.S. Migranov, Impact of mechanical properties measured at room and
elevated temperatures on wear resistance of cutting tools with TiAlN and AlCrN
coatings, Surf Coat Technol 200 (2006) 5738-5742.
36.G.S. Fox-Rabinovich, J.L. Endrino, B.D. Beake, A.I. Kovalev, S.C. Veldhuis, L.
Ning, F. Fotaine and A. Gray, Impact of annealing on the microstructure, properties,
and cutting performance of AlTiN coating, Surf Coat Technol 201 (2006) 3524-3529.
37.G.S. Fox-Rabinovich, B.D. Beake, K. Yamamoto, M.H. Aguirre, S.C. Veldhuis, G.
Dosbaeva, A. Elfizy, A. Biksa, and L.S. Shuster, A.Y. Rashkovskiy, Structure,
properties and wear performance of nano-multilayered TiAlCrSiYN/TiAlCrN
coatings during machining of Ni-based aerospace superalloys, Surf. Coat. Technol.
204 (2010) 3698-3706.
38.A.J. Haq, P.R. Munroe, M. Hoffman, P.J. Martin, A. Bendavid, Berkovich indentation
of diamond like carbon coatings on silicon substrates, J. Mater. Res. 23 (2008)
27
39.A.J. Haq, P.R.Munroe, M.Hoffman, P.J.Martin and A.Bendavid,
Nanoindentation-induced deformation behaviour of tetrahedral amorphous carbon coating deposited by
filtered cathodic vacuum arc, Diamond and Related Materials 19 (2010) 1423-1430.
40.A.J. Haq, P.R.Munroe, M.Hoffman, P.J.Martin and A.Bendavid,
Nanoindentation-induced deformation behaviour of diamond-like carbon coatings on silicon substrates,
Thin Solid Films 515 (2006) 1000-1004.
41.A.J. Haq, P.R.Munroe, M.Hoffman, P.J.Martin and A.Bendavid, Effect of coating
thickness on the deformation behaviour of diamond-like carbon-silicon system, Thin
Solid Films 518 (2010) 2021–2028.
42.K. Holmberg, H. Ronkainen, A. Laukkanen, K. Wallin, A. Erdemir and O. Eryilmaz,
Tribological analysis of TiN and DLC coated contacts by 3D FEM modelling and
28
Tables
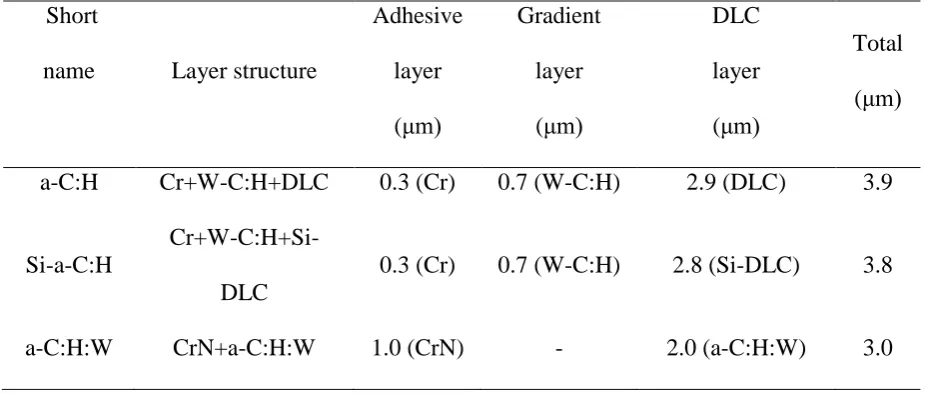
Table 1 Multilayer coating architecture
Short
name Layer structure
Adhesive
layer
( m)
Gradient
layer
( m)
DLC
layer
( m)
Total
( m)
a-C:H Cr+W-C:H+DLC 0.3 (Cr) 0.7 (W-C:H) 2.9 (DLC) 3.9
Si-a-C:H
Cr+W-C:H+Si-DLC
0.3 (Cr) 0.7 (W-C:H) 2.8 (Si-DLC) 3.8
[image:29.595.65.528.147.344.2]a-C:H:W CrN+a-C:H:W 1.0 (CrN) - 2.0 (a-C:H:W) 3.0
Table 2 Nanoindentation results at 40 mN
H (GPa) Er (GPa) hc (nm) H/Er H3/Er2 (GPa)
a-C:H 25.0 ± 1.1 194.7 ± 5.4 227.1 ± 5.9 0.128 ± 0.003 0.41 ± 0.04
Si-a-C:H 16.3 ± 0.5 143.3 ± 2.9 287.3 ± 4.7 0.114 ± 0.002 0.21 ± 0.01
29
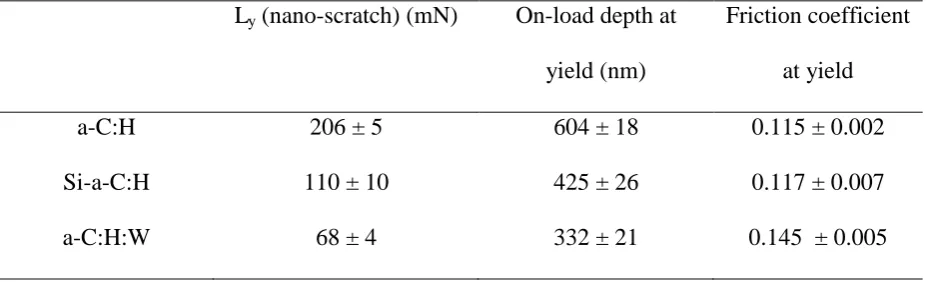
Table 3 Critical load for non-elastic deformation in the nano-scratch test with R = 5 µm
probe
Ly (nano-scratch) (mN) On-load depth at
yield (nm)
Friction coefficient
at yield
a-C:H 206 ± 5 604 ± 18 0.115 ± 0.002
Si-a-C:H 110 ± 10 425 ± 26 0.117 ± 0.007
a-C:H:W 68 ± 4 332 ± 21 0.145 ± 0.005
Table 4 Probe depths at critical loads in the micro-scratch test with R = 25 µm probe
Coating On-load depth
(nm)
Residual depth
(nm)
% Scratch recovery
a-C:H at Lc1 1720 ± 87 652 ± 48 62.1 ± 2.5
a-C:H at Lc2 2028 ± 112 718 ± 82 64.6 ± 5.5
Si-a-C:H at Lc1 1475 ± 102 586 ± 61 60.2 ± 3.4
Si-a-C:H at Lc2 1794 ± 96 693 ± 63 61.3 ± 4.3
a-C:H:W at Lc1 2137 ± 251 1021 ± 167 52.2 ± 2.9
[image:30.595.67.529.390.615.2]30
Table 5 Yield pressures from nano-scratch and nanoindentation tests
Y (nano-scratch) (GPa) Y (nanoindentation analysis) (GPa)
a-C:H 20.6 ± 0.9 23.8
Si-a-C:H 14.9 ± 0.5 14.3
a-C:H:W 12.4 ± 0.8 12.0
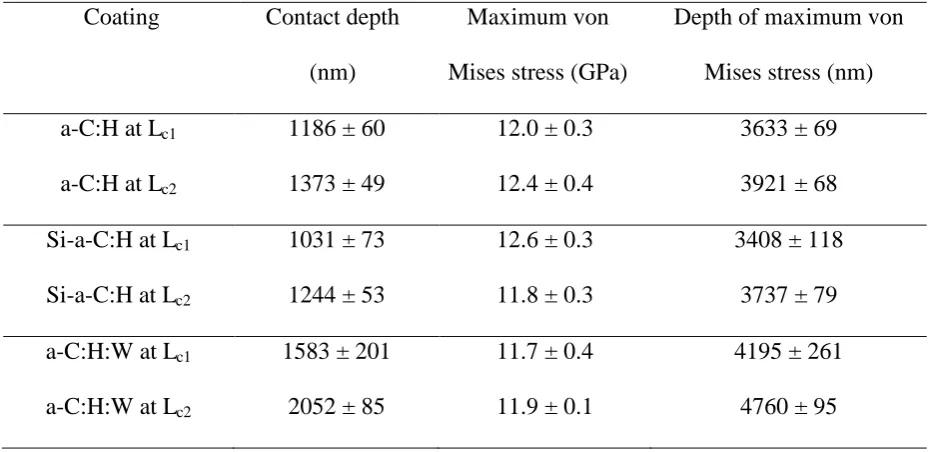
Table 6 Hertzian analysis of micro-scratch test results with R = 25 µm probe
Coating Contact depth
(nm)
Maximum von
Mises stress (GPa)
Depth of maximum von
Mises stress (nm)
a-C:H at Lc1 1186 ± 60 12.0 ± 0.3 3633 ± 69
a-C:H at Lc2 1373 ± 49 12.4 ± 0.4 3921 ± 68
Si-a-C:H at Lc1 1031 ± 73 12.6 ± 0.3 3408 ± 118
Si-a-C:H at Lc2 1244 ± 53 11.8 ± 0.3 3737 ± 79
a-C:H:W at Lc1 1583 ± 201 11.7 ± 0.4 4195 ± 261
[image:31.595.65.530.371.597.2]31
Figure captions
1. (a-c) Depth-dependence of the relationship between plasticity index (PI), H/Er and the
apparent constant of proportionality when using a Berkovich indenter (a) on a-C:H; (b) on
Si-a-C:H and (c) on Si-a-C:H:W. (d) The relationship between PI and H/Er for the coatings at a
contact depth of 300 nm.
2. Load-dependence of friction coefficient in nano-scratch test using R = 5 µm probe
3. SEM images of nano-scratch tracks with R = 5 µm probe. The scratch direction is from top
right to bottom left. (a) a-C:H. x12000 magnification image of the end of the nano-scratch
track (500 mN). (b) Si-a-C:H. x16000 magnification image near of the nano-scratch track
(>450 mN). (c) a-C:H:W. x10000 magnification image midway through the nano-scratch
track (>250 mN).
4. Micro-scratch test using R = 25 µm probe. (a) Critical loads (b) On-load probe depth (c)
residual depth (d) Load-dependence of elastic recovery in micro-scratch testing with R = 25
µm probe. (e) Variation in friction coefficient with applied load (f) Friction coefficient at Ly,
Lc1 and Lc2.
5. SEM images of micro-scratch tracks with R = 25 µm probe. The scratch direction is from
top right to bottom left. (a) a-C:H - x6000 magnification image showing cracking above Lc1
(b) a-C:H - x217 magnification image (c) Si-a-C:H – x227 magnification image (d) a-C:H:W
x4000 magnification image showing cracking (e) a-C:H:W – x227 magnification image.
6. Hertzian analysis of micro-scratch test data (a) Mean pressure vs. applied load (b) Location
32
Figures
Figure 1. (a)
33 Figure 1. (c)
[image:34.595.70.514.69.733.2]34 Figure 2.
35 Figure 3(b)
[image:36.595.162.433.71.272.2] [image:36.595.159.439.324.543.2]36 Figure 4 (a)
[image:37.595.82.502.87.762.2] [image:37.595.113.479.87.374.2]37 Figure 4 (c)
[image:38.595.77.507.59.685.2]38 Figure 4 (e)
[image:39.595.72.512.76.742.2]39 Figure 5. (a)
[image:40.595.84.481.65.664.2] [image:40.595.122.476.70.342.2]40 Figure 5 (c).
[image:41.595.124.475.70.335.2] [image:41.595.96.478.76.641.2]41 Figure 5 (e)
[image:42.595.119.480.69.341.2] [image:42.595.76.514.400.711.2]