White Rose Research Online
[email protected]
Universities of Leeds, Sheffield and York
http://eprints.whiterose.ac.uk/
This is a copy of the final published version of a paper published via gold open access
in Health Economics.
This open access article is distributed under the terms of the Creative Commons
Attribution Licence (
http://creativecommons.org/licenses/by/3.0
), which permits
unrestricted use, distribution, and reproduction in any medium, provided the
original work is properly cited.
White Rose Research Online URL for this paper:
http://eprints.whiterose.ac.uk/83431
Published paper
VALUING TRIAL DESIGNS FROM A PHARMACEUTICAL
PERSPECTIVE USING VALUE-BASED PRICING
PENNY BREEZE,* and ALAN BRENNAN
School of Health and Related Research, University of Sheffield, Sheffield, UK
ABSTRACT
Our aim was to adapt the traditional framework for expected net benefit of sampling (ENBS) to be more compatible with
drug development trials from the pharmaceutical perspective.
We modify the traditional framework for conducting ENBS and assume that the price of the drug is conditional on the trial outcomes. We use a value-based pricing (VBP) criterion to determine price conditional on trial data using Bayesian updating of cost-effectiveness (CE) model parameters. We assume that there is a threshold price below which the company would not market the new intervention. We present a case study in which a phase III trial sample size and trial duration are varied. For each trial design, we sampled 10 000 trial outcomes and estimated VBP using a CE model. The expected
com-mercial net benefit is calculated as the expected profits minus the trial costs.
A clinical trial with shorter follow-up, and larger sample size, generated the greatest expected commercial net benefit.
Increasing the duration of follow-up had a modest impact on profit forecasts.
Expected net benefit of sampling can be adapted to value clinical trials in the pharmaceutical industry to optimise the
expected commercial net benefit. However, the analyses can be very time consuming for complex CE models. © 2014
The Authors.Health Economicspublished by John Wiley & Sons Ltd.
Received 10 June 2013; Revised 25 July 2014; Accepted 12 August 2014
KEY WORDS: value-based pricing; value of information; decision-analytic modelling; systemic lupus erythematosus
1. INTRODUCTION
Drug development costs are burdensome for the pharmaceutical industry. High costs have been attributed to the costs of research, duration of research programmes, and the low probabilities of market approval (Adams and Brantner, 2006). Market access is increasingly dependent on the perceived, or estimated, value of new treat-ments in addition to efficacy.
Value-based pricing (VBP) describes a pricing mechanism that explicitly estimates the price at which the incremental value balances out the incremental costs of the new treatment (Sussexet al., 2013). VBP will be-come more prominent when it is introduced as part of methods for value assessment in the UK from 2014. Al-though the UK is a relatively small market, evidence suggests that 25% of the world pharmaceutical market references UK prices (Hughes, 2011).
Values of information (VoIs), and more specifically expected net benefit of sampling (ENBS), methods have been promoted for determining trial designs for health care research (Claxton, 1999; Willan and Pinto, 2005). ENBS methods undertake simulations of the sample trial data, for a given trial design, and evaluate the value of
*Correspondence to: School of Health and Related Research, University of Sheffield, Regents Court, 30 Regent Street, Sheffield S1 4DA, UK. E-mail: p.r.watson@sheffield.ac.uk
This is an open access article under the terms of the Creative Commons Attribution License, which permits use, distribution and reproduc-tion in any medium, provided the original work is properly cited.
the treatment after data collection using cost-effectiveness (CE) analysis. Bigger trials will be more costly, so ENBS quantifies the expected net trade-off of the benefits of the trial against the cost of the trial.
To date, most ENBS studies in health economics have taken a health care provider perspective to decide whether to invest in research to evaluate whether the new intervention is cost-effective. They assume that re-search will befinanced by public resources. The decision to adopt an intervention now (i.e. before the research study) is uncertain because it is possible that the new intervention is less cost-effective than the alternative, and this is described as the expected opportunity cost (Eckermann and Willan, 2008; McKenna and Claxton, 2011). The opportunity cost is typically quantified as the additional investment needed and the expected quality-adjusted life years (QALYs) forgone, valued at the health care provider’s willingness to pay for a QALY.
This health care provider framework is not directly applicable to the pharmaceutical company. Other decision-theoretic approaches to selecting trial designs from a pharmaceutical perspective have been proposed. A Bayesian clinical trial simulation (BCTS) study has demonstrated that multiple trial designs can be simulated to optimise the likelihood of market access (Nixonet al., 2009). Gittinset al. have proposed designing trials using a behavioural Bayes approach, which assumes that the number of patients who would receive the new intervention (and hence the sales/profit of the new drug) is a function of the observed size of the treatment effect and the statistical significance (Gittins and Pezeshk, 2000a, 2000b). Willan et al. estimated the optimal sample size by valuing trials according to the expected profit conditional on the probability of regulatory approval (Willan, 2008). However, these approaches either assume that the profit per patient isfixed, or they do not spec-ify the future price of the drug and hence do not computefinancial value. At the stage of reimbursement, the pharmaceutical company should have sufficient evidence to get a regulatory licence for the new treatment. However, such strong evidence is not available at earlier stages of drug development, which impacts on the use of ENBS.
There is, as yet, no clear ENBS framework for evaluating alternative clinical trial designs when the evidence base and price for a drug are uncertain. An ENBS approach adapted to evaluate if there is a positive net benefit to pursuing a phase II or phase III trial could impact on the efficiency of drug development programmes by reducing the number of treatments that fail to reach health care markets (DiMasi, 2002).
The aim of this paper is to describe an ENBS framework for phase II or phase III trials and present a worked example. The framework modifies the traditional ENBS method so that it can be used by pharmaceutical com-panies to design clinical trials in drug development programmes. Essentially, the framework combines the ideas of ENBS with the emerging ideas around VBP. We have selected a hypothetical intervention for the disease of systemic lupus erythematosus (SLE) as a case study to investigate how our ENBS using the VBP method could be useful to design a phase III clinical trial given existing trial evidence.
2. METHOD
2.1. Framework: expected net benefit of sampling using value-based pricing
the evidence available to estimate expected costs of different treatment strategies and expected benefits. Relax-ation and extension of these assumptions are considered in the discussion.
We begin with notation. Wefirst take the perspective of the reimbursement authority. They have a set of possible treatment intervention decisionsD= {D1,D2,…,DN} in a CE model that, for each intervention, has
a cost function componentCDiand a QALY componentQDi. The CE model has a vector of uncertain
param-eters,θ. We denote a joint prior distribution given current evidence,p(θ). The willingness to pay for a threshold of the reimbursement authority is denotedλ. This enables quantification of the monetary net benefit function for each possible decisionDi, that is,NBDi ¼λQDiCDi. In the absence of the new treatment, and with prices for
existing treatments already set, the reimbursement authority has evaluated the decision options and mandated use of the most cost-effective treatment given current evidence.
D1¼argmaxi½EθfNBDið Þθ g (1)
Second, we consider the reimbursement authority’s perspective on the new product from the pharmaceutical companyD2. The evidence from the proposed trial will help to further inform or update our understanding of
some of the parameters, a subset we denoteθI, whilst our understanding of the remaining complementary set of
parameters,θCI, would remain unaffected by proposed research. The proposed new trial or research study with a
specified design,ψ, would provide data,Xψθ
I, on parametersθI, giving a posterior density via Bayesian updating
p θI;θC I
j
XψθI
. We denote functions forD2for QALYs asQD2 and for costs excluding the drug price
compo-nent (i.e. the effects on other health care resources utilised for the indication) asCD2 can now be
incorpo-rated. We denote the price of treating one person for 1 year with the new drug as P and the expected number of years of treatment that a patient receives as t. The total expected costs of the new treatment given the trial result Xψθ
I are therefore the drug costs P*EθI;θICjXψθI t θI;θ
C I
j
XψθI
plus the other health care costs EθI;θC
IjXψθI CD2 θI;θ
C I
j
XψθI
.The total expected QALYs of the new treatment are Eθ
I;θCIjXθψI QD2 θI;θ
C I
j
XψθI
. The value-based price, denotedP*, will be chosen by the reimbursement authority. We assume that the CE model is the key tool in this decision and that essentiallyP* is chosen so that the incremental CE ratio of the new treatment versus the old treatment is equal toλ(e.g. Incremental Cost Effectiveness Ratio (ICER) forD2
versusD1= £30 000 per QALY gained). Thus, the CE model’s probabilistic sensitivity analysis (PSA) is re-run
incorporating the new treatment and the trial evidence, andP* is chosen as solving the following equation:
P*Eθ
I;θCIjX
ψ θI
t θI;θCI
j
Xψ θI
n o
þEθ
I;θCIjX
ψ θI
CD2 θI;θ C I
j
Xψ θI
n o
Eθ
I;θCIjX
ψ θI
CD1 θI;θ C I
j
Xψ θI
n o
Eθ
I;θCIjXψθI
QD2 θI;θ C I
j
XψθI
n o
Eθ
I;θCIjXψθI
QD1 θI;θ C I
j
XψθI
n o ¼λ (2)
Thirdly, we consider the pharmaceutical company’s perspective on this, with a modification of the expected profit based on current information proposed by Willan in previous VoI analyses from a pharmaceutical perspective (Willan, 2008). Thefinancial value of sales accruing to the company will be related to the sales volume and the price at which the drug is sold. We characterise sales volume utilising work on drug life cycles and future prices from Hoyle (2011). We assume that the new treatment has a lifetime horizonH. In each yearh
up to that lifetime horizon, the sales volume is a function of the annual incidence of patients eligible for treatment κh, the market share of the new treatment sh, and a deflation factor vh that accounts for real
pharmaceutical price deflation (vh= 1/(1 +r)h), whereris the deflation in drug price over time. The total sales
volume over the lifetime horizon, H, is therefore ∑Hh¼0κhshvh. The total sales value to the company is P*Eθ
I;θCIjXψθI t θI;θ
C I
j
XψθI
n o
∑H
The company will wish to compare this income against its costs, which will include costs of development, costs of the proposed research programme (i.e. the trial) and, once approved, the costs of production and mar-keting. We denote the previous costs of development to date asCDevelopment. We denote the costs of a proposed
trial with a specified design asCψTrialand assume that this has afixed and variable component. We further denote the unit cost of producing and marketing 1 year’s worth of the new treatment for one patient asCProd &Market.
The total costs to the company are thereforeCDevelopmentplusCψTrialplus the costs of production and marketing
multiplied by the amount sold, that is,CProd&MarketEθI;θC IjXψθI
t θI;θCI
j
XψθI
n o
∑H
h¼0κhshvh.
There will be many factors to be weighed in the balance by the company when it decides whether or not to launch a new drug onto the market given its trial results and a proposed value-based price from the re-imbursement authority. Included in that balance will be all of these costs described previously, although none are likely to be directly observable to a third party outside the company. Similar to previous charac-terisation of this issue (Willan and Eckermann, 2012), and in order to simplify this complexity, we con-ceive a minimum price (again for 1 year’s treatment for one patient) below which the company would be unwilling to launch its product in that jurisdiction, and we denote this minimum acceptable sales price
Pmin. The minimum price will be affected by the costs of production, however, will also be determined by the wider costs to the pharmaceutical company of research and development (R&D), and marketing.
The operating profit per patient treated with the new drug, once approved, is dependent on the strength of the trial evidence, and we denote this asπ θI;θCI
j
Xψ θI
. The logic of the company deciding whether or not to launch is as follows. If the value-based price is below the company’s minimum acceptable price, then the pharmaceutical company would not have any sales, or any costs of production, and hence receive zero profit for the new treatment. However, if P* is greater than the pharmaceutical company’s minimum price Pmin, the pharmaceutical company would adopt the value-based price and produce and market the treatment. Profit per patient would then equal value-based price minus the cost of treatment production and multiplied by the mean treatment duration. Therefore, the following algorithm was used to quantify profit per patient π Xψθ
I
.
π Xψθ
I
¼ 0 if P
<Pmin
P θI;θCIjXψθI
CProd&Market
h i
Eθ
I;θCIjXψθI
t θI;θCI
j
XψθI
n o
if P≥Pmin
( )
(3)
The total profit forecastPFXθ
I for a given trial resultXθI is therefore
PFXψθ
I ¼π
Xψθ
I
∑H
h¼0κ
hshvh CDevelopment CψTrial (4)
The fourth component of the framework involves simulating the many possible trial results for the pro-posed trial designs, ψ. Each simulation should reflect current uncertainty in trial outcomes and the joint posterior density for the CE model parameters. We simulated a large number of trial datasets, k= 1 to
K, which we denote Xψθ
I1; X
ψ θI2;…; X
ψ
θIK. The expected value-based price for each simulated dataset,
Xψθ
Ik, can be estimated by solving Eqn 2. Some trial results may estimate poor outcomes for the
pharma-ceutical company, which would result in P* being negative or less than Pmin. In turn, we can estimate the expected profit to the company PFXψθ
IK. The multiple simulated datasets will estimate the distribution of
ECNBψ¼ 1
K ∑
K
k¼1
PF Xψθ
IK
ECNBψ ¼EXψθ
I
PF Xψθ
I
h i (5)
We denote the set of possible trial designs,ψ. The optimal trial designψ*is that which maximises the ex-pected profit forecast.
ECNB¼ maxψ∈ΨEPFψ
ψ¼argmax
ψ∈ΨEPFψ
(6)
2.2. Worked example in systemic lupus erythematosus
Systemic lupus erythematosus is an autoimmune disease with multiple organ manifestations. The disease is characterised by a period of reversible disease activity, which has been measured in observation studies using the SLE Disease Activity Index (SLEDAI) (Furie et al., 2011; Navarraet al., 2011). Disease activ-ity and treatment toxicactiv-ity are associated with permanent organ damage, whose burden is measured using the Systemic Lupus International Collaborating Clinics/American College of Rheumatology Damage In-dex (SLICC/ACR DI; Gladman et al., 2000).
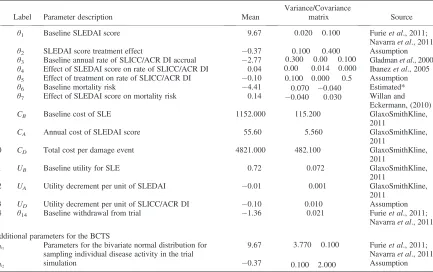
To investigate the expected profit per patient in SLE clinical trials, we have developed a simple exemplar SLE health economic decision model. The parameter inputs of the model θ= {θ1,θ2,…,θ14} are detailed in
Table I. The model computes total expected costs and QALYs over a lifetime horizon.
2.2.1. Disease natural history.The natural history of the disease assumes that a population of patients with SLE will have a mean disease activity score, ADi, measured using the SLEDAI conditional on treatment
allocation.
AD1¼θ1
AD2¼θ1þθ2
(7)
Organ damage is described by the SLICC/ACR DI. The mean rate of organ damage accrualSDiis assumed to be a function of disease activity,ADi, and treatment allocationDi.
SD1 ¼ expðθ3þθ4AD1Þ
SD2¼ expðθ3þθ4AD2þθ5Þ
(8)
disease activity for the treatment duration t. Mean SLEDAI score for treated patients is adjusted for time on treatment so that their lifetime mean SLEDAI score is not underestimated.
MD1¼ 1
expðθ6þθ7AD1Þ
(9)
MD2¼ 1
exp θ6þθ7 MtD
1 AD2þ
MD1t MD1
AD1
(10)
2.2.2. Costs.We assumed a fixed annual cost for a patient with SLE,CB, an annual cost per unit of disease
activity,CA, and a cost per damage event,Cs. Acquisition costs for the new treatment are not included in the
calculation. Administration costs for the new treatment are assumed to be zero.
CD1¼MD1ðCBþCAAD1þCsSD1Þ (11)
[image:7.567.70.503.111.383.2]CD2¼t CBð þCAAD2þCSSD2Þ þðMD2tÞðCBþCAAD1þCSSD1Þ (12)
Table I. Prior parameters for the cost-effectiveness model of a hypothetical new treatment versus standard treatment for SLE
Label Parameter description Mean
Variance/Covariance
matrix Source
1 θ1 Baseline SLEDAI score 9.67 0:020 0:100
0:100 0:400
Furieet al., 2011; Navarraet al., 2011
2 θ2 SLEDAI score treatment effect 0.37 Assumption
3 θ3 Baseline annual rate of SLICC/ACR DI accrual 2.77 0:300 0:00 0:100
0:00 0:014 0:000 0:100 0:000 0:5
Gladmanet al., 2000 4 θ4 Effect of SLEDAI score on rate of SLICC/ACR DI 0.04 Ibanezet al., 2005
5 θ5 Effect of treatment on rate of SLICC/ACR DI 0.10 Assumption
6 θ6 Baseline mortality risk 4.41 0:070 0:040
0:040 0:030
Estimated* 7 θ7 Effect of SLEDAI score on mortality risk 0.14 Willan and
Eckermann, (2010)
8 CB Baseline cost of SLE 1152.000 115.200 GlaxoSmithKline,
2011
9 CA Annual cost of SLEDAI score 55.60 5.560 GlaxoSmithKline, 2011
10 CD Total cost per damage event 4821.000 482.100 GlaxoSmithKline, 2011
11 UB Baseline utility for SLE 0.72 0.072 GlaxoSmithKline,
2011
12 UA Utility decrement per unit of SLEDAI 0.01 0.001 GlaxoSmithKline, 2011
13 UD Utility decrement per unit of SLICC/ACR DI 0.10 0.010 Assumption 14 θ14 Baseline withdrawal from trial 1.36 0.021 Furieet al., 2011;
Navarraet al., 2011
Additional parameters for the BCTS
XA1 Parameters for the bivariate normal distribution for sampling individual disease activity in the trial simulation
9.67 3:770 0:100
0:100 2:000
Furieet al., 2011; Navarraet al., 2011
XA2 0.37 Assumption
2.2.3. QALYs.Total lifetime QALYs were estimated using Eqns 11 and 12 for standard of care and new treatment respectively. The model assumed a baseline utility score for patients with SLE without disease activity, UB. An annual decrement was applied per unit of SLEDAI,UA. A utility decrement was applied
for total cumulative organ damage assuming linear accrual of organ damage over time, US.
QD1 ¼MD1ðUBþUAAD1Þ þUS
SD1MD1
2
(13)
QD2¼t Uð BþUAAD2Þ þUS SD2t
2
þðMD2tÞðUBþUAAD1Þ þUS
SD1ðMD1tÞ
2
(14)
In total, the model had 14 parameter inputs for which the prior distributions are reported in Table I. The global willingness to pay for a QALY is assumed to be £30 000.
2.2.4. Trial simulation.In the illustrative example, we consider nine clinical trial designs of various sam-ple sizes (n= 500, 1000 and 1500) and duration of follow-up (1, 2 and 3 years). For simplicity, we as-sumed that data for the new treatment and its comparator are both collected in a single phase III trial. In real-life applications, multiple phase III trials may be planned, and an indirect comparison may be re-quired if the comparator arm of the trial is not the comparator for the economic evaluation. However, the method can be simply adapted to reflect these characteristics. In each trial, we generated data on the SLEDAI score, SLICC/ACR DI and withdrawal from the trial as a result of adverse events or lack of
ef-ficacy. Mean SLEDAI score was sampled from the bivariate normal distribution.
A1
A2
eN θ1 3:77 0
θ1þθ2; 0 2
(15)
The number of damage events observed per year of follow-up for each patient during the trial was sampled using the Poisson distribution.
S1ePois n;expðθ3þθ4AD1ÞS2ePois nð ;expðθ3þθ4AD2þθ5Þ
(16)
The time to withdrawal from the trial for each patient was sampled from the exponential distribution.
teExpðexpðθ14ÞÞ (17)
2.2.5. Bayesian updating given trial data.We employ Bayesian updating methods to update the prior param-eter distributions of the CE model (Table I) with clinical trial data. If the posterior is a distribution that is of the same family as our prior, then Bayesian updating is relatively straightforward because the distributions are con-jugate. If the prior and posterior are not conjugate, then the standard approach is to estimate the posterior using Markov chain Monte Carlo (MCMC) methods to generate simulated samples from the posterior distribution. However, in this example, we used the Brennan and Kharroubi (B&K) Bayesian approximation formula (Brennan and Kharroubi, 2007a, 2007b) process because the joint prior probability distribution was not conjugate with the trial data, and it has been shown to be substantially faster than using MCMC in WinBUGS. Brennan and Kharroubi (2007a) have developed and tested an approximation formation for the posterior expec-tation of a functionv(θ) withjuncertain parameters (θ=θ1,…,θj) given a sample of dataX.
E vð Þθ
j
XψθI
n o
≅v ^θ þ∑ j
i¼1
α
i v θ
i þαþi v θ
þ
i v ^θ
(18)
From the industry perspective,v(θ) represents functions for value-based price.^θis a vector for the posterior mode of the model parameters that maximise the posterior density function given the dataX. Eachθi andθþi is a
specific point in thejdimensional space at which the functionv(θ) is evaluated. A weighted average of these evaluations is taken with weightsαi andαþi applied. The pointsθi andθþi and weightsαi andαþi depend on
both the prior probability distribution for the model parametersθand on the dataXψθ
Ibut are independent of the
functionv.
2.2.6. Exemplar total profit function.Profit forecast is determined by the annual incidence of SLEk, the current time horizon of the treatmentH, the market share of the new treatments, and the price depreciation rate,r. The point prevalence of SLE and the incidence over an annual period were determined in Birmingham, UK, to
re-flect a population with a broad ethnic mix. The study reports a point estimate of the incidence to be 3.8/ 100 000/year (Johnson et al., 1995). The incidence rate was applied to the current population statistics for the OECD countries. The most recent population statistics were from 2009 and reported a total population of 912 021 760 over 19 years of age (OECD, 2012). From this, we calculated an annual incidence of 34 657 di-agnoses of SLE per year. The market share was assumed to be 42%. These assumptions enable us to estimate the potential sales volumes for the new treatment. The time horizon of the treatment was assumed to be 33 years (Hoyle, 2011). The price deflation rate was assumed to be 4% per year (Hoyle, 2008).
Expenditure on the trial,CTrial, was estimated based on afixed cost of £1 000 000 with a variable cost of
£2000 per patient in thefirst year of observation and £1500 for subsequent years to account for participant re-cruitment costs. The additional costs of monitoring patients in subsequent years are incurred, even if they have withdrawn from the study. We assumed that the minimum price acceptable to the pharmaceutical company was £1000 per year.
2.3. Trial simulation process and estimation of optimal design
We programmed a simulation process to evaluate the ENBS given our prior uncertainty about the efficacy of the treatment. We evaluated 10 000 data samples for each trial design to capture the uncertainty in our prior beliefs about the clinical trial outcomes. The simulation process is described in the succeeding texts. The R code for simulation is supplied as electronic supplementary material.
1. Specify a series of possible trial designsΨ, for example, sample sizen, duration, etc. 2. Draw realisation of each parameter from its prior distribution.
3. Generate a sample of patients in the trial and randomly assign them to treatments 1 and 2. 4. Simulate the clinical trial resultXψθ
5. Select patients for analysis according to trial design. 6. Estimate a value-based priceP* given the sample dataXψθ
I.
7. Repeat steps 5–7 for all design options. 8. Repeat steps 1–8 for 10 000 iterations. 9. Evaluate Eqn 4 for each simulated trial.
[image:10.567.63.505.213.298.2]10. Evaluate the ECNB across all simulated trials for each trial design and identify the trial design that has the optimal value (i.e. highest ECNB).
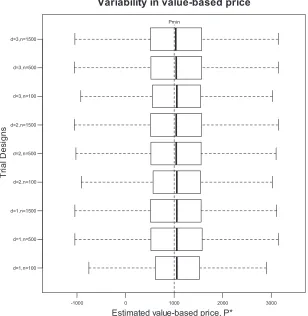
[image:10.567.132.440.340.656.2]Figure 1. Summary of 10 000 trial simulation results for nine proposed designs illustrating the variability in estimated value-based price,P*
Table II. Summary of 10 000 trial simulation results for nine proposed designs reporting the probability of demonstrating a
statistically significant effect size and probability of reimbursement
Probability of significant treatment effect on disease activity measure
SLEDAI
Probability of significant treatment effect on organ damage measure
SLICC/ACR DI
Probability of a significant reduction on SLEDAI AND estimated VBP
P*>Pmin
1 year 2 years 3 years 1 year 2 years 3 years 1 year 2 years 3 years
n= 100 57% 74% 80% 6% 9% 12% 47% 51% 52%
n= 500 85% 89% 91% 15% 20% 23% 52% 52% 51%
n= 1500 90% 92% 93% 23% 25% 32% 52% 52% 51%
3. RESULTS
Table II reports the probability that each trial observed a statistically significant improvement in disease activity and a statistically significant reduction in organ damage. The analysis suggested that increasing sample size increases the probability of observing a statistically significant difference in SLEDAI scores more markedly than increasing the duration of follow-up. A similar result was observed for the probabil-ity of observing a statistically significant difference in SLICC/ACR DI. The probability that the trial identified a statistically significant difference in SLEDAI score and P*>Pminincreased with sample size and duration of follow-up. At 3 years of follow-up there were no incremental benefits to increasing sample size suggesting that there is a ceiling effect to the probability of reimbursement. This is because the prior distribution of treatment benefit demonstrates approximately 49% probability that the treatment is not cost-effective atPmin. Figure 1 illustrates the effect of changes in trial design on the variability in expected value-based price estimates. As the trials increase in size, the 95% confidence intervals of the box plot become wider. This effect is observed because the large datasets have a greater impact on the posterior value-based price and the prior has less impact. Trial designs with more variable estimated value-based price will have higher expected profits because they are more likely to collect sufficient evidence to support higher prices. The graph illustrates our assumed Pmin at £1000 per patient. Value-based price estimates below this point will produce zero sales because the pharmaceutical company would not be reimbursed at Pmin.
Table III reports the profit, sales and cost forecasts for the trial designs. The table illustrates that larger trials are associated with higher profits per patient for trials that get market approval and reimbursement. Increasing sample size from 100 to 1500 has a greater impact on the profit per patient than increasing duration of follow-up from 1 to 3 years.
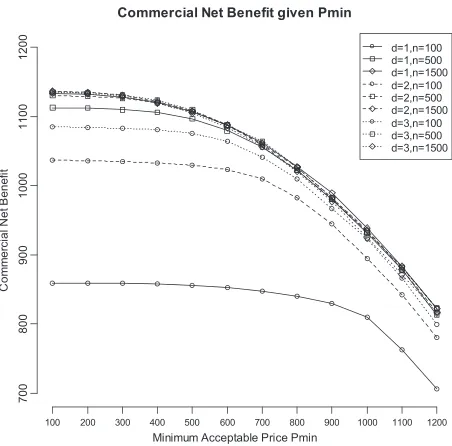
[image:12.567.169.400.445.658.2]We observe a ceiling effect for expected sales volume and profit as trials increase in size and duration of follow-up (Table III). The increase size has no impact on the probability of reimbursement aside from simulation error in the probability of reimbursement. Therefore, increasing the duration of follow-up in a trial of 500 or 1500 patients does not improve the expected profits. When trial costs and production costs are taken into account, we observe that trials with larger sample size n= 1500 and short duration have the
highest commercial net benefit (Figure 2). However, there is very little difference observed between trials of sample size greater than 500 and duration of follow-up of more than 1 year.
We conducted a sensitivity analysis to observe what impact the choice ofPminwould have an impact on the choice of trial design. Figure 3 illustrates how commercial net benefit estimates change for values of
Pmin ranging from £100 to £1200. Overall, commercial net benefit decreases as the minimum price accept-able to the pharmaceutical company increases. The variability in commercial net benefit decreases as Pmin
increases. However, the patterns observed between trial designs are broadly stable over Pmin. Trials with either large sample size (n= 1500) and short follow-up or moderate to large sample size with longer follow-up have very similar commercial net benefit estimates.
Each probabilistic sensitivity analysis evaluation of the CE model took 17 s to be generated. Each sample trial dataset took 0.001 s to be generated. A single evaluation of the B&K approximations using the 14-parameter SLE CE model took 4.33 s to be generated. Thefinal analysis that included 10 000 samples from the prior distribution to inform 90 000 approximations of value-based price using the B&K approximation took 236 h.
4. DISCUSSION
We have described how ENBS methods can be adapted to evaluate the value of trials according to the perspectives of a pharmaceutical company. We have presented a framework that assumes that price is
flexible and conditional on evidence generated from the trial. As attention amongst health economists and decision-makers move towards pricing strategies that incorporate value propositions, this framework will provide a useful tool to formally and objectively evaluate trial designs using the best evidence available to the pharmaceutical company.
[image:13.567.171.397.84.307.2]The results of our case study suggest that shorter trials with a large sample size are associated with greater profit forecasts for the pharmaceutical company. Although there is substantial uncertainty in the long-term effectiveness of treatments in chronic diseases, increasing sample size is a more efficient method of data collection in this illustrative example.
We have adopted a very simple CE model in this illustrative example. No discounting has been applied, and a very simple description of the disease is assumed. We assumed that the comparator for the randomised control trial (RCT) was the same as the comparator for the economic evaluation. However, future adaptations of the method would accommodate alternative assumptions and the inclusion of an indirect comparison to estimate treatment effects for the comparators. We have chosen to use a simple model to illustrate the benefits of the VBP framework for valuing trials. However, a more complex model may be preferred by pharmaceutical companies and reimburse-ment authorities.
More complex CE models would require substantially more computation time than the model presented here. The two most important determinants of computation time are the number of parameters in the CE model and the time it takes to evaluate CE outcomes for a single set of parameter inputs. This is because the B&K approximation requires the CE model to be evaluated 2d +1 times (Brennan and Kharroubi, 2007a). In our example, the model contains only 14 parameters, and the CE model can be evaluated in 14 s. An individual patient simulation would require more parameters and would take longer to evaluate CE outcomes. In this case, it may be infeasible to generate expected profit forecast (EPF) outcomes within a reasonable time frame on a standard desktop computer.
The proposed data collection for a single drug indication was assumed to illustrate the framework of valuing trials using VBP. However, the simplicity of this example does not reflect more complex drug development programmes that include multiple trials or multiple drug indications. The simplifying assumptions can be relaxed and adapted to accommodate more difficult decision problems. There have been several studies reported in the literature where the ENBS methods have been extrapolated to more complex decision problems to include multiple-stage research programmes (Claxton and Thompson, 2001; Willan and Kowgier, 2008; Chen and Willan, 2013), unbalanced data collection from multiple studies (Kharroubi et al., 2011), and imperfect implementation of policy changes (Willan and Eckermann, 2010). Some trial designs may require BCTS to enable more complex trial designs to be evaluated (Nixonet al., 2009). BCTS could also be employed to simulate outcomes from multiple RCTs or RCTs in multiple drug indications. Broadly, the framework would be unchanged, but the process of updating CE model parameters would need to be adapted to accommodate data from multiple sources.
Drug prices are not set globally, and not all national regulators use CE methods in reimbursement decision-making. Although the illustrative example determines price in a single national market, additional assumptions for multiple markets could be integrated into the analysis to reflect multiple market conditions. For example, two or more willingness to pay thresholds could be incorporated into the function to estimate a weighted profit function across multiple markets. However, the method is less easily transferable to a free-market setting. However, if it were possible to specify a profit function linking trial outcomes to price and sales volumes, it would be possible to integrate profits from other markets into the analysis. The proportion of market share could be estimated conditional on the pharmaceutical company’s target price and trial outcomes.
Further research could evaluate the method with a real-life case study. Our worked example is useful to demonstrate the method; however, it did not evaluate the usefulness and test the practicalities of the method. A real-life case study would highlight which simplifying assumptions were priorities to adapt to add more complexity. It would also be useful to evaluate how these methods could be incorporated into the trial design process and whether the information generated would be valued by the relevant decision-makers within the pharmaceutical company.
to trial design in the pharmaceutical industry because it integrates the probability of market access and expected profit given the regulatory constraints.
In conclusion, we have developed an extension to the ENBS framework that considers the perspective of the pharmaceutical company and uses the ideas of VBP to value and rank for alternative phase III trial designs. The method can be applied to any jurisdiction where there is some reasonable assessment of the relationship between scale of treatment effects and new treatment price. We have demonstrated that a VBP framework can be useful to incorporate value-based prices into the analysis of drug development trials to express expected commercial net benefit.
CONFLICT OF INTEREST The authors have no conflict of interest.
ACKNOWLEDGEMENTS
The study comprises work from Penny Breeze’s PhD that was funded by the Economic and Social Research Council.
ETHICS
This research did not involve experimentation on human subjects. No submission to an ethical committee was required.
REFERENCES
Adams CP, Brantner VV. 2006. Estimating the cost of new drug development: is it really 802 million dollars? Health
Affairs (Millwood)25(2): 420–428.
Brennan A, Kharroubi SA. 2007a. Efficient computation of partial expected value of sample information using Bayesian
approximation.Journal of Health Economics26(1): 122–148.
Brennan A, Kharroubi SA. 2007b. Expected value of sample information for Weibull survival data.Health Economics
16(11): 1205–1225.
Chen MH, Willan AR. 2013. Determining optimal sample sizes for multistage adaptive randomized clinical trials from an
industry perspective using value of information methods.Clinical Trials10(1): 54–62.
Claxton K. 1999. The irrelevance of inference: a decision-making approach to the stochastic evaluation of health care
technologies.Journal of Health Economics18(3): 341–364.
Claxton K, Thompson KM. 2001. A dynamic programming approach to the efficient design of clinical trials.Journal of
Health Economics20(5): 797–822.
DiMasi JA. 2002. The value of improving the productivity of the drug development process: faster times and better
decisions.PharmacoEconomics20(Suppl 3): 1–10.
Eckermann S, Willan AR. 2008. The option value of delay in health technology assessment. Medical Decision Making
28(3): 300–305.
Furie R, Petri M, Zamani O, Cervera R, Wallace DJ, Tegzova D, Sanchez-Guerrero J, Schwarting A, Merrill JT, Chatham WW, Stohl W, Ginzler EM, Hough DR, Zhong ZJ, Freimuth W, van Vollenhoven RF. 2011. A phase III, randomized, placebo-controlled study of belimumab, a monoclonal antibody that inhibits B lymphocyte stimulator, in patients with
systemic lupus erythematosus.Arthritis and Rheumatism63(12): 3918–3930.
Gittins J, Pezeshk H. 2000a. A behavioral bayes method for determining the size of a clinical trial. Drug Information
Journal34(2): 355–363.
Gittins J, Pezeshk H. 2000b. How large should a trial be?Journal of the Royal Statistical Society, Series D49(2): 177–187.
Gladman DD, Goldsmith CH, Urowitz MB, Bacon P, Fortin P, Ginzler E, Gordon C, Hanly JG, Isenberg DA, Petri M, Nived O, Snaith M, Sturfelt G. 2000. The Systemic Lupus International Collaborating Clinics/American College of
Rheumatology (SLICC/ACR) Damage Index for Systemic Lupus Erythematosus International Comparison. Journal
GlaxoSmithKline. 2011. Single Technology Appraisal. Belimumab for the treatment of active autoantibody-positive
systemic lupus eythematosus. Specification for manufacturer/sponsor submission of evidence. National Institue for
Health and Clinical Excellence (NICE), Uxbridge, United Kingdom.
Hoyle M. 2008. Future drug prices and cost-effectiveness analyses.PharmacoEconomics26(7): 589–602.
Hoyle M. 2011. Accounting for the drug life cycle and future drug prices in cost-effectiveness analysis.
PharmacoEconomics29(1): 1–15.
Hughes DA. 2011. Value-based pricing: incentive for innovation or zero net benefit?PharmacoEconomics29(9): 731–735.
Ibanez D, Gladman DD, Urowitz MB. 2005. Adjusted mean Systemic Lupus Erythematosus Disease Activity Index-2 K is a
predictor of outcome in SLE.Journal of Rheumatology32(5): 824–827.
Johnson AE, Gordon C, Palmer RG, Bacon PA. 1995. The prevalence and incidence of systemic lupus erythematosus in
Birmingham, England. Relationship to ethnicity and country of birth.Arthritis and Rheumatism38(4): 551–558.
Kharroubi SA, Brennan A, Strong M. 2011. Estimating expected value of sample information for incomplete data models
using Bayesian approximation.Medical Decision Making31(6): 839–852.
McKenna C, Claxton K. 2011. Addressing adoption and research design decisions simultaneously: the role of value of
sample information analysis.Medical Decision Making31(6): 853–865.
Navarra SV, Guzman RM, Gallacher AE, Hall S, Levy RA, Jimenez RE, Li EK, Thomas M, Kim HY, Leon MG, Tanasescu
C, Nasonov E, Lan JL, Pineda L, Zhong ZJ, Freimuth W, Petri MA. 2011. Efficacy and safety of belimumab in patients
with active systemic lupus erythematosus: a randomised, placebo-controlled, phase 3 trial.Lancet377(9767): 721–731.
Nixon RM, O’Hagan A, Oakley J, Madan J, Stevens JW, Bansback N, Brennan A. 2009. The Rheumatoid Arthritis Drug
Development Model: a case study in Bayesian clinical trial simulation.Pharmaceutical Statistics8(4): 371–389.
OECD. 2012. OECD population statistics.
Sussex J, Towse A, Devlin N. 2013. Operationalizing value-based pricing of medicines: a taxonomy of approaches.
PharmacoEconomics31(1): 1–10.
Vernon JA, Goldberg R, Golec J. 2009. Economic evaluation and cost-effectiveness thresholds: signals to firms and
implications for R & D investment and innovation.PharmacoEconomics27(10): 797–806.
Willan AR. 2008. Optimal sample size determinations from an industry perspective based on the expected value of
information.Clinical Trials5(6): 587–594.
Willan AR, Eckermann S. 2010. Optimal clinical trial design using value of information methods with imperfect
implemen-tation.Health Economics19(5): 549–561.
Willan AR, Eckermann S. 2012. Value of information and pricing new healthcare interventions.PharmacoEconomics
30(6): 447–459.
Willan A, Kowgier M. 2008. Determining optimal sample sizes for multi-stage randomized clinical trials using value of
information methods.Clinical Trials5(4): 289–300.
Willan AR, Pinto EM. 2005. The value of information and optimal clinical trial design. Statistics in Medicine24(12):
1791–1806.
SUPPORTING INFORMATION