Journal of Chemical and Pharmaceutical Research, 2015, 7(7):866-874
Research Article
ISSN : 0975-7384
CODEN(USA) : JCPRC5
Effect of substitution of Ca and Mn on structural properties of bismuth ferrite
R. Sharma
Department of Physics, Lovely Professional University, Phagwara
_____________________________________________________________________________________________
ABSTRACT
Multiferrroic Bi1-xCaxFe1-xMnxO3 (x=0.15) is prepared by auto combustion method using glycine as a fuel. The effect
of co-substitution of Ca and Mn on structural properties of bismuth ferrite ceramics was studied. The prepared samples are analyzed by XRD and FTIR studies. The crystallite development in the BCFMO is investigated by X-ray peak broadening methods like Williamson Hall (W-H) plot, Scherrer method and Size -Strain plot method. A well defined perovskite phase with tetragonal system is observed from the XRD data. The results showed that the mean crystallite size of the BCFMO estimated from the different methods are highly inter correlated. The Rietveld refinement of XRD pattern shows that it belong to rhombohedral R3C space group. It also confirms that substitution of Ca2+ and Mn3+ creates oxygen vacancies in the system that in turn suppresses the displacement of Bi3+ ions from its centrosymmetric position and also the distortion. The FTIR studies carried out on these samples shows peaks correspond ing to 554 cm-1 which confirms the formation of metal oxide bonds and hence the formation of BFO.
Keywords: BCFMO (Bi0.85 Ca0.15 Fe0.85 Mn0.15 O3), Perovskites, Debye Scherrer, Williamson-Hall, Scherrer
method.
_____________________________________________________________________________________________
INTRODUCTION
Multiferroic are those materials which show simultaneous presence of ferromagnetism, ferro electricity and ferro elasticity at ambient conditions. They have the potential ability to couple the electric and magnetic polarization, so have taken the attention of scientists nowadays. But, very few materials are reported that shows both ferromagnetic and ferroelectric properties at room temperature. Among those materials, BiFeO3 (BFO) is one which is ferroelectric
below 1103K and is a slightly canted antiferromagnet below 643K [1,2],and it possess a rhombohedrally distorted perovskite structure with space group R3c at room temperature. This space group allows the antiphase octahedral tilting and ionic displacement from the centrosymmetric position along [111]C direction of the parent cubic
perovskite unit cell. The ferroelectricity in this compound is due to the off-centre structural distortions of cations whereas the magnetism is due to local spins. The R3c symmetry allows the existence of weak ferro magnetic moment due to Dzyaloshinky-Moriya interaction but the cycloid spin structure with the periodicity of ~62 nm prevents net magnetization leads to net zero magnetization [3-6]. Recently, it has been reported that by substitution on A- site and/or B-site in BFO, a high ferroelectric and ferromagnetic polarization or large magetoelectric coupling constant at room temperature is observed [7-12].
eliminate impurity phases which leads to the formation of coarser powders and its poor reproducibility. Hence, we have adopted the chemical route of synthesis for uniform particle size and better reproducibility.
The material scientists have aimed to improve the multi ferroic properties of BFO by doping with various elements. So, in this context their exist need to identify dopants that might rectify the issue of stability and synthesis, lead to a canting geometry that gives ferromagnetism, provide a means of controlling the nature and strength of magneto electric coupling, and generate mechanisms for engineering transformation- related micro structures. Doping with Ca (BCFO) has emerge as a successful attempt, basically as the cycloidal magnetic structure is replaced by a canted antiferromagnetic structure that is indeed weakly ferromagnetic. [15-21]
B. Ramchandran et al and D. Khothari et al [22, 23] have reported that substitution of Ca at A-site in BFO has resulted in weak ferromagnetic ordering. The Mn substitution at Fe site of BFO is reported to inhibit the grain growth which resulted in reduced particle size [24] and improve the magnetic as well as electric properties [25, 26]. S. Chauhan et al. had reported the structural phase transition in 15% Mn doped BFO sample due to the distortion in the rhombohedral structure with increasing Mn substitution which resulted in significant enhancement in magnetization [27]. J-Z Huang et al have reported the structural transition and improved ferro electricity in Ca and Mn co-substituted BFO thin films up to 10% substitution concentration[28].
In the present study, we report the synthesis of Ca and Mn co substituted BiFeO3 by auto combustion route using glycine as a fuel. The diffraction patterns shows the formation of perovskite structure and crystallite size is calculated from scherrer formula, scherrer plot, WH plot and SSP method and are found in the nanometer range. Line profile analysis (LPA) refers to the analysis of the shape of the peaks [1].FTIR also shows bonds in the region 400-600 cm-1 which further confirms the formation of perovskite structure.
EXPERIMENTAL SECTION
2.1 Material Synthesis
BiFeO3 nanoparticles have been prepared by autocombustion method using metal nitrates and glycine as a fuel but without using any solvent. Bismuth nitrate (Bi(NO3)3, 5H2O), ferric nitrate (Fe(NO3)3, 9H2O), Manganese nitrate Mn(NO3)2, Calcium nitrate Ca(NO3)2 and glycine (NH2CH2COOH) all were used with purity 99.9% or higher and
without further purification. These compounds were taken in stoichiometric ratios in a glass beaker and heated at 80
0C on a hot plate for combustion of the mixture to form brown color precursor. The precursor was grounded into
powder using mortar and pastel and annealed in air at 500 °C for 2 hours.
2.2 Characterization Tools 2.2.1 XRD Analysis:
X-ray Diffraction pattern for the sample BSFTO was taken using Bruker AXS D8 advance diffractometer. The scanning speed of the specimen is 2 degree/minute.
From the XRD results, it was concluded that this crystal was found to be tetragonal system.
The different methods used to evaluate the crystallite size of the sample are given below.
2.2.1.1 Scherrer method
X-ray diffraction profile is used to measure the average crystallite size of the sample. The lines in the diffraction pattern are of finite breadth but the lines starts broadening due to small size of the particles. The broadening decreases with the increase in crystallite size. The crystallite size for Bi0.85 Ca0.15 Fe0.85 Mn0.15O3 is calculated from
X-ray diffraction profiles of strong reflections with intensity % by measuring the full width at half maximum (FWHM). The Debye Scherrer equation for calculating the crystallite size is given by
D =
for the shape of the particle and is generally taken to have the value 0.9. The results revealed that the crystallite size is less than 100 nm.
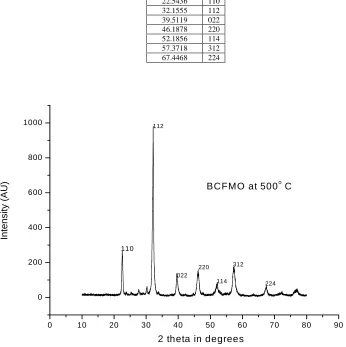
Table 1: The (hkl) indices calculated from the 2θ values of the XRD profile are listed here
2ϴ in degrees hkl
22.5436 110
32.1555 112
39.5119 022
46.1878 220
52.1856 114
57.3718 312
67.4468 224
0 10 20 30 40 50 60 70 80 90
0 200 400 600 800 1000
In
te
n
s
it
y
(
A
U
)
110
112
022 220
114 312
224
BCFMO at 500o C
2 theta in degrees
Fig 1: shows the XRD diffraction profile of the sample BCFMO at temperature of 500oC
XRD data can be analyzed to study the peak broadening with crystallite size. Crystals formed may not be perfect due to their finite size. The disparity or deviations from perfect crystallinity leads to the broadening of the diffraction peaks. The two main factors of peak width analysis are the crystallite size and lattice strain. Hence the 2θ peak positions get shifted. The breadth of the Bragg peak is a combination of both instrument and sample dependent effects as
β2 crystallite size = β2measured – β2instrumental.
Therefore D = Kλ/βcos θ => cos θKλ/D(1/ β) --- (2).
2.2.1.2 Scherrer plot method
-4 -3 - 2 -1 0 1 2 3 4 -0 .5
-0 .4 -0 .3 -0 .2 -0 .1 0 .0 0 .1 0 .2
Y = -0 .0 8 1 5 2 + 0 .0 2 1 3 5 X
b
e
ta
*
C
o
s
(t
h
e
ta
)
4 * S in (th e ta )
Fig2: shows the Scherrer plots of BSFMO at 500oC
2.2.1.3 Wiliamson- Hall (W-H) Plot method.
W-H plots emphasized the strain induced plots. The peak width derived from crystallite size varies as 1/cos θ
whereas strain varies as tan θ. This difference in behavior as a function of 2θ enables to distinguish between the size and strain effects on peak broadening. The Bragg width contribution from crystallite size is inversely proportional to the crystallite size [29]. W-H analysis is a simplified integral breadth method where size-induced and strain-induced broadening are deconvoluted by considering the peak width as a function of 2θ [30]. Addition of Scherrer formula and the strain induced broadening results in
β2 hkl = K λ/D Cos θ + 4ε tan θ ---(3)
where ε represents the strain. W-H plots are drawn with β Cos θ along the Y axis and 4sin θ along the X axis as given in Fig. 3. The slope and Y-intersect of the fitted line represent strain and particle size, respectively.
-4 -3 -2 -1 0 1 2 3 4
-0 .5 -0 .4 -0 .3 -0 .2 -0 .1 0 .0 0 .1 0 .2
Y = -0 .0 8 1 5 2 + 0 .0 2 1 3 5 X
b
e
ta
*
C
o
s
(t
h
e
ta
)
4 * S in (th e ta )
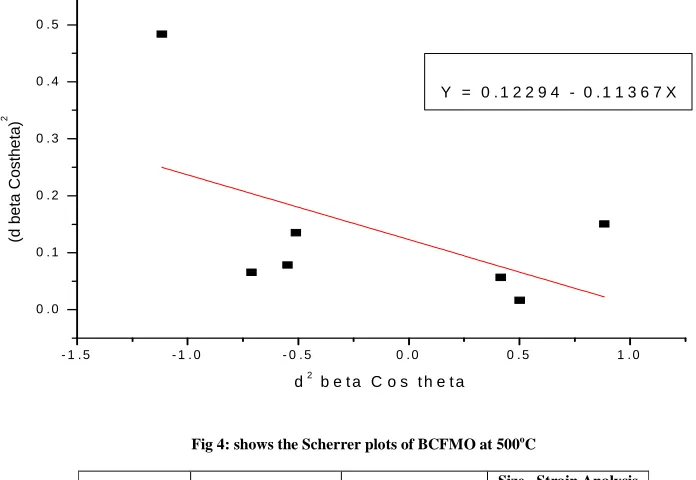
2.2.1.4 Size-Strain Plot Method
The value of d (the inter planar spacing between the atoms) is calculated using the Bragg’s Law, or Wavelength of X ray = 1.5 Å for CuKα. Williamson-Hall plot has explained that line broadening was basically isotropic. Due to micro strain contribution the diffracting domains are also isotropic. Size-strain parameters can be obtained from the”Size-Strain Plot” (SSP). Here it is assumed that the ’strain profile’ is given by Gaussian function and the ’crystallite size’ by Lorentzian function [31]. In the plots given below in Fig. 4, d2 hklβhkl cosθ and (dhklβhkl cosθ)2
were taken on X- axis and Y-axis respectively for all peaks. The crystallite size is calculated from the slope of the linearly fitted data and the root of the Y-intercept gives the strain [31].
- 1 . 5 - 1 . 0 - 0 . 5 0 . 0 0 . 5 1 . 0
0 . 0 0 . 1 0 . 2 0 . 3 0 . 4 0 . 5
Y = 0 . 1 2 2 9 4 - 0 . 1 1 3 6 7 X
(d
b
e
ta
C
o
s
th
e
ta
)
2
[image:5.595.116.464.225.465.2]d2 b e t a C o s t h e t a
Fig 4: shows the Scherrer plots of BCFMO at 500oC
2ϴ in degrees Scherrer Method W-H Plot Method Size –Strain Analysis Method
By equation
(A)
by plot analysis
crystallite
size strain
crystallite
size strain
22.5436 43.03
4.52 7.48 0.0213 12.19 0.0350
32.1555 15.1065
39.5119 8.15917
46.1878 9.75612
52.1856 10.23225
57.3718 3.20195
67.4468 5.24141
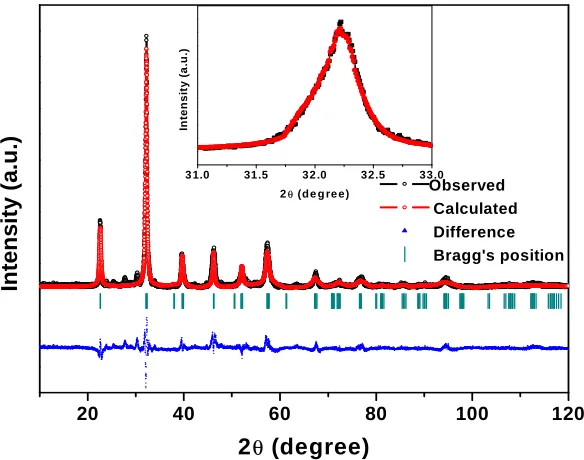
The Rietveld refined XRD pattern of Bi0.85Ca0.15Mn0.15Fe0.85O3is shown in figure5 .The XRD pattern of the present
studied sample is best fitted with the space group R3C, rhombohedral symmetry. The fitted parameters for the fit are
χ2= 1.2, Rwp=2.94%. Some impurity peaks are also visible in the XRD pattern. These peaks can be indexed to
Bi25FeO40. The substitution of Mn3+can be responsible for the generation of these impurity peaks [32].
The calculated lattice parameters for the sample are a=b=5.56846(8) Å; c=13.5586(5) Å. The present studied sample shows a decrement in lattice parameters as compared to undoped BiFeO3 (a=5.5775 Å; c=13.8616 Å) which can be
attributed to the small ionic radii of Ca2+ (1.12 Å) as compared to Bi3+ (1.17 Å) [33]. The XRD peaks show a slight shifting towards higher angle side and this shift also confirm that substitution of Ca2+ and Mn3+generates compressive strain in the system and reduces the unit cell volume.
In undoped BiFeO3, the double peaks are observed around 32º. In the present investigated sample, this splitting has
system, the charge imbalance will be created in the system which will be balanced by the oxidation of Mn3+ and Fe3+ into Mn4+ and Fe4+followed by generation of oxygen vacancies. These oxygen vacancies will suppress the displacement of Bi3+ from its centrosymmetric position and also the distortion.
Fig 5: shows the Rietveld refined XRD pattern of Bi0.85Ca0.15Mn0.15Fe0.85O3
2.2.2 FTIR Analysis
To find out the results of FTIR, of the prepared powdered samples, it is necessary to transform the powdered form of samples into thin pellets using a KBr press. To convert the powdered form of sample into thin pellets, a mixture of the powdered sample and KBr, which is often taken in the ratio 1:10 were grinded with mortar and pestle. This powdered mixture was then pressed to make the thin pellet. The spectra of the samples were obtained in the range 400 to 4000 -1 with IR prestige-21 FTIR (model-8400S).
The strong absorption is shown by the bands in the range of 400-600cm-1. The band at 1380cm-1 arises due to the presence of the trapped nitrates while the bands shows at peak 1630cm-1 corresponds to bending vibrations of H2O[34].
In our case, strong absorptive peaks at 400–600 cm-1 are resulted due to the Fe-O stretching and bending vibration which is characteristic of octahedral FeO6 groups in the perovskite compound. The formation of a perovskite
structure can be confirmed by the presence of metal-oxygen band [35,36] The peaks in the range of 436-547cm-1, 1628cm-1, 2930cm-1 and 3445cm-1 have seen the the FTIR spectra which correspond to ferric oxide, bending vibration of water, bond CH2 stretch is located and stretch vibration of OH bond respectively. It can be concluded
that after completion of the self-combustion reaction, the resulting powder’s main components are metal oxides but a small amount of unreacted organic material also can be found.
20 40 60 80 100 120
3 1.0 31.5 32 .0 32.5 33.0
In
te
n
s
it
y
(
a
.u
.)
2θ (d e g re e)
In
te
n
s
it
y
(
a
.u
.)
2
θ(degree)
0 500 1000 1500 2000 2500 3000 3500 4000 4500 -0.05
0.00 0.05 0.10 0.15 0.20 0.25 0.30 0.35
400 450 500 550 600 650 700 0.00
0.05 0.10 0.15 0.20
T
ra
n
s
m
is
s
io
n
(
%
)
Wavelength (cm-1)
Inset of BCFMO
T
ra
n
s
m
is
s
io
n
(
A
.U
.)
Wavelength (cm-1)
BCFMO
RESULTS AND DISCUSSION
In the present work a systematic and detailed study of the lead free ceramic BCFMO (Bi0.85 Ca0.15 Fe0.85 Mn0.15O3)
was successfully done. The shape f the diffraction peaks are determined using Line Profile Analysis. Using Debye Scherrer’s equation and making use of the width of the XRD peak, the mean crystallite size of the as prepared sample is calculated. The values calculated using the Scherrer formula are compared to the values obtained through Williamson-Hall plot, Scherrer plot and the Size-Strain Plot drawn. The broadening of the diffraction peaks and hence the 2θ peak positions get shifted is the result of the disparity or deviations from perfect crystallinity. Results obtained from different methods are in good agreement. For the size strain plots negative strain is also observed which can be accounted as the lattice shrinkage. The XRD data confirms that the material belongs to tetragonal system. Table 2 shows the hkl values calculated from the XRD profile. The Rietveld analysis of the sample is carried out and it is concluded that the dominant crystal symmetry of the sample is rhombohedral belonging to R3C space group. The lattice parameter of the doped sample is compared with the undoped BiFeO3 and it is found that
they have decreased. The shift of XRD peaks towards higher angle also shows that the substitution of Ca2+ and Mn3+ has induced compressive strain in the system and has reduced its unit cell volume. Also, the Ca2+ and Mn3+ substitution in the BiFeO3 has created oxygen vacancies in the system which will suppress the displacement of Bi3+
from its centro symmetric position and also distortion. This distortion can leads to enhanced magnetic properties of BFO and hence improves its multiferroic character. The FTIR spectra contain peak corresponding to strong absorptive peaks at 400–600 cm-1 which is due to the Fe-O stretching and bending vibration and is characteristic of octahedral FeO6 groups in the perovskite compound.
CONCLUSION
The nano ceramic material BCFMO (Bi0.85 Ca0.15 Fe0.85 Mn0.15O3) is prepared by the auto combustion route. The
method, W-H plot method and Size-Strain plot method are in high inter correlation. The Rietveld analysis of the XRD pattern shows that the rhombohedral crystal symmetry (R3C space group) is dominant in the BCFMO. The substitution of Ca2+ and Mn3+ creates oxygen vacancies in BFO which will suppress the displacement of Bi3+ from its centrosymmetric position and also the distortion. FTIR studies also confirm the formation of metal oxygen band in the region of 400-600 cm-1 which confirms the formation of perovskite structure. Further, magnetic and electrical characterization of the BCFMO could be done to reveal its enhanced multiferroic properties.
REFERENCES
[01] G. Smolenskii, V. Yudin, E. Sher, Y.E. Stolypin, Sov. Phys.-JETP, 1963 16, 622. [02] Y.N. Venevtsev, G. Zhadanov, S. Solov'ev, Sov.Phys.-Crystallography. 1960, 4, 538. [03] C. Ederer, N.A. Spaldin, Phys. Rev. B 2005, 71, 060401-060405.
[04] I. Dzyaloshinsky, J. Phys. Chem. Solids 1958, 4, 241-255. [05] T. Moriya, Phys. Rev. 1960, 120, 91-98.
[06] I. Sosnowska, T. Peterlin-Neumaier, E. Steichele, J. Phys. C 1982, 15, 4835-4846.
[07] A.V. Zalesskii, A.A. Frolov, T.A. Khimich, A.A. Bush, Phys. Solid State 2003, 45, 141-145. [08] V.R. Palkar, D.C. Kundaliya, S.K. Malik, S. Bhattacharya, Phys. Rev. B, 2004, 69, 212102-212105. [09] Q. Xu, H. Zai, D. Wu, Y.K. Tanga, M.X. Xu, J. Alloys Compd. , 2009485, 13-16.
[10] J. Wei, D. Xue, C. Wu, Z. Li, J. Alloys Compd., 2008, 453, 20-23.
[11] Z.X. Cheng, A.H. Li, X.L. Wang, S.X. Dou, K. Ozawa, H. Kimura, S.J. Zhang, T.R.Shrout J. Appl. Phys.,
2008, 103, 07E507-07E507-3.
[12] G. Le Bras, D. Colson, A. Forget, N. Genand-Riondet, R. Tourbot, P. Bonville, Phys. Rev. B, 2009, 80 134417-134423-11
[13] S. Ghosh, S. Dasgupta, A. Sen, H.S. Maiti, J. Am. Ceram. Soc., 2005, 88, 1349-1352.
[14] M.M. Kumar, V. R. palkar, K. Srinivas and S.V. Suryanarayana, , Appl. Phys. Lett., 2000, 76, 2764-2766. (15) Kothari, D.; Reddy, V. R.; Gupta, A.; Sathe, V.; Banerjee, A.; Gupta, S. M.; Awasthi, A. M. Appl. Phys. Lett.,
2007, 91, 202505-1−202505-3.
(16) Khomchenko, V. A.; Troyanchuk, I. O.; Többens, D. M.; Sikolenko, V.; Paixão, J. A. J. Phys.: Condens. Matter
2013, 25, 135902.
(17) Chen, S.; Wang, L.; Xuan, H.; Zheng, Y.; Wang, D.; Wu, J.; Du, Y.; Huang, Z. J. Alloys Compd. 2010, 506, 537−540.
(18) Chen, W.-t.; Williams, A. J.; Ortega-San-Martin, L.; Li, M.; Sinclair, D. C.; Zhou, W.; Attfield, J. P. Chem.
Mater. 2009, 21, 2085−2093.
(19) Troyanchuk, I.; Karpinsky, D.; Bushinskii, M.; Prokhnenko, O.; Kopcevicz, M.; Szymczak, R.; Pietosa, J. J.
Exp. Theor. Phys., 2008, 107, 83−89.
(20) Yang, C.; Liu, C.; Wang, C.; Zhang, W.; Jiang, J. J. Magn. Mater. 2012, 324, 1483−148.
(21) Ramachandran, B.; Dixit, A.; Naik, R.; Lawes, G.; Rao, M. S. R. J. Appl. Phys. 2012, 111, 023910-1−023910-5.
[22] B. Ramachandran, A. Dixit, R. Naik, G. Lawes and M. S. R. Rao, J. Appl. Phys., 2012, 111, 023910-023910-5. [23] D. Kothari, V. R. Reddy, A. Gupta, V. Sathe, A. Banerjee, S. M. Gupta, A. M. Awasthi, Appl. Phys. Lett., 2007, 91, 202505 -202505-3.
[24] A. Ianculescu, F.P. Gheorghiu, P. Postolache, O. Oprea, L.Mitoseriu, J. Alloys Compd., 2010, 504, 420. [25] Z.X. Cheng, X.L. Wang, Y. Du, S.X. Dou, J. Phys. D: Appl. Phys., 2010 43, 242001-242006.
[26] V.R. Palkar, Darshan C. Kundaliya, and S. K. Malik, J. Appl. Phys., 2003, 93, 4337-4339.
[27] S. Chauhan, M. Kumara, S. Chhokera, S. C. Katyal, H. Singh, M. Jewariya, K. L. Yadav Solid State Comm.,
2012 152, 525-529.
[28] J.Z. Huang, Y. Shen, M. Li and C.W. Nan, J. Appl. Phys., 2011, 110 094106-094106-6. [29] Devamani RHP, Rani JM. IJSR 2014; 3(4):2277-8179
[30] Zak AK, Majid WHA, Abrishami ME, Yousefi R. Solid State Sciences 2011; 13:251e256.
[31] Prabhu YT, Rao KV, Kumar VSS, Kumari BS. International Journal of Engineering and Advanced Technology (IJEAT) 2013; 2(4):2249–8958
[32] YannanFeng, Huanchun Wang, Yang Shen, Yuanhua Lin, Cewen Nan, Modern Research in Catalysis, 2013, 2, 1-5