White Rose Research Online URL for this paper:
http://eprints.whiterose.ac.uk/91170/
Version: Accepted Version
Article:
Klaassen, PD, Johnston, KG, Leurini, S et al. (1 more author) (2015) The SiO outflow from
IRAS 17233-3606 at high resolution. Astronomy and Astrophysics, 575. A54. ISSN
0004-6361
https://doi.org/10.1051/0004-6361/201424781
[email protected] https://eprints.whiterose.ac.uk/
Reuse
Unless indicated otherwise, fulltext items are protected by copyright with all rights reserved. The copyright exception in section 29 of the Copyright, Designs and Patents Act 1988 allows the making of a single copy solely for the purpose of non-commercial research or private study within the limits of fair dealing. The publisher or other rights-holder may allow further reproduction and re-use of this version - refer to the White Rose Research Online record for this item. Where records identify the publisher as the copyright holder, users can verify any specific terms of use on the publisher’s website.
Takedown
If you consider content in White Rose Research Online to be in breach of UK law, please notify us by
Astronomy&Astrophysicsmanuscript no. SiO_17233 cESO 2014 December 19, 2014
The SiO outflow from IRAS 17233-3606 at high resolution.
P.D. Klaassen
⋆1,2, K.G. Johnston
3,4, S. Leurini
5, and L.A. Zapata
6 1 Leiden Observatory, Leiden University, PO Box 9513, 2300 RA Leiden, The Netherlands2 UK Astronomy Technology Center, Royal Observatory Edinburgh, Blackford Hill, Edinburgh EH9 3HJ, UK 3 Max Planck Institute for Astronomy, Königstuhl 17, 69117, Heidelberg, Germany
4 Department of Physics and Astronomy, University of Leeds, Leeds, LS2 9JT, UK 5 Max Planck Institut für Radioastronomie, Auf dem Hügel 69, 53121, Bonn, Germany
6 Centro de Radioastronomía y Astrofísica, UNAM, Apdo. Postal 3-72 (Xangari), 58089 Morelia, Michoacán, México
Received August 8, 2014; accepted December 18, 2014
ABSTRACT
Context.Jets and outflows are key ingredients in the formation of stars across the mass spectrum. In clustered regions, understanding powering sources and outflow components poses a significant problem.
Aims.To understand the dynamics in the outflow(s) from a cluster in the process of forming massive stars.
Methods.We use new VLA observations of the molecular gas (SiO, CS, OCS and H2CO ) in the massive star forming region IRAS
17233-3606 which contains a number of HII regions. We compare these observations to previously published molecular data for this source in order to get a holistic view of the outflow dynamics.
Results.We find that the dynamics of the various species can be explained by a single large scale (∼0.15 pc) outflow when compared to the sizes of the HII regions, with the different morphologies of the blue and red outflow components explained with respect to the morphology of the surrounding envelope. We further find that the direction of the velocity gradients seen in OCS and H2CO are
suggestive of a combination of rotation and outflow motions in the warm gas surrounding the HII regions near the base of the large scale outflow.
Conclusions.Our results show that the massive protostars forming within this region appear to be contributing to a single outflow on large scales. This single large scale outflow is traced by a number of different species as the outflow interacts with its surroundings. On the small scales, there appear to be multiple mechanisms contributing to the dynamics which could be a combination of either a small scale outflow or rotation with the dynamics of the large scale outflow.
Key words. Stars: massive, HII regions, ISM: jets and outflows, ISM: molecules, Radio lines: ISM
1. Introduction
Although high mass (M>8 M⊙) stars may form in isolation
(de Wit et al. 2004), most form in clusters with an associated initial mass function (IMF) of lower mass stars. Indeed, it is the clustered nature of high-mass star-formation that is often cited as one of the key hurdles (along with large distances and high ra-diation pressures) in our understanding of the formation of these stars (Zinnecker & Yorke 2007).
In attempts to overcome the hurdles of large distances, many studies focus on the large scale structures (i.e. outflows) and gen-erally attribute the largest outflow to the most massive star in the region. Once this large scale outflow is identified, efforts are sub-sequently concentrated for finding signatures of a rotating disk. In this manner, many smaller scale rotating structures have been found surrounding massive (proto) stars (i.e. Beuther et al. 2009; Klaassen et al. 2009; Beltran et al. 2011)
There has long been speculation about the nature of outflows from massive star forming regions, specifically as to why their energetics seem to scale super-linearly with stellar mass from the low mass regime (i.e. Duarte-Cabral et al. 2013). Some ar-gue that opening angles widen with age or stellar mass (e.g. Shepherd 2005), while others suggest precession may lead to lowering the collimation (e.g. Raga et al. 2009), and there are still further theories suggesting how the competing outflows
from the various accreting protostars interacting with each other produce the large scale wide outflows seen in high mass regions. This is in addition to the mechanisms responsible for explosive events like those seen in Orion BN/KL (Zapata et al. 2009, 2010) IRAS 17233 is a nearby (1kpc, Leurini et al. 2013) high-mass star forming region containing multiple HII regions of var-ious sizes and likely evolutionary states. In this study, we focus on the emission from, and dynamics of the molecular gas asso-ciated with the HII regions in the VLA1 and VLA2 regions as defined by Zapata et al. (2008).
In VLA1, the spectral energy distributions (SEDs) of the continuum sources are consistent with optically thin HII regions (Zapata et al. 2008). In VLA2, the SEDs of the brightest ob-jects (VLA2a,b) indicate Hypercompact (HC) HII regions, while the SEDs of the VLA2c,d could either be interpreted as due to HCHII regions or highly dusty disks.
Previous observations of the molecular gas in this region have concentrated primarily on the CO J=2-1 (i.e Leurini et al. 2009, at 5.4×1.9′′ ) and SiO J=5-4 (e.g Leurini et al. 2013, at
3.2×2.5′′) emission, and have identified three distinct outflows
coming from the VLA1-2 region. The multiple outflows were identified by being spatially distinct, and the emission coming from distinct velocity intervals (Leurini et al. 2008).
interpre-17h26m41s
42s
43s
RA (J2000)
40"
30"
20"
10"
09'00"
-36°08'50"
De
c (
J20
00
)
EHV CO
HV CO
0.00
0.25
0.50
0.75
1.00
1.25
1.50
1.75
2.00
17h26m41s
42s
43s
RA (J2000)
EHV CO
HV CO
[image:3.595.51.557.59.362.2]0.00
0.08
0.16
0.24
0.32
0.40
0.48
0.56
Fig. 1: CS integrated intensity with contours of CO emission. Left: EHV blue shifted CO emission (blue contours) from Leurini et al. (2009) starting at 3σand increasing at intervals of 3σ. The HV velocity blue shifted CO is shown in cyan contours starting at 5σ
and increase at intervals of 5σ. Right EHV red-shifted CO emission (red contours) from Leurini et al. (2009) starting at 3σand increasing at intervals of 3σ. The HV red shifted CO is shown in orange contours starting at 10σand increase at intervals of 10σ. The colour scales show the blue and red shifted CS emission integrated over velocities greater than 4 km s−1(red or blue shifted)
with respect to the LSR velocity, and has units of Jy beam−1km s−1. The thin grey contour shows the 3σlevels of the CS integrated
intensities (4.6×10⁻²and 8.1×10⁻²Jy beam−1km s−1for red and blue respectively). The synthesised beams for the CS (blue, filled)
and CO (black, open) observations are given in the bottom left corner of both panels.The units of the scale bars are Jy beam−1km s−1.
tation of the outflow(s) from this system, as well as the smaller scale dynamics in the VLA1-2 region.
2. Observations
Here we present VLA observations of IRAS 17233-3606 which was observed on 27 May, 2013 in the CnD hybrid configuration with the Q band receiver. There were eight narrowband spectral windows, and eight wideband. The narrowband windows had a spectral resolution of 125 kHz and bandwidth of 32 MHz (256 channels), while the wideband windows had a spectral resolution of 2 MHz and bandwidth of 128 MHz (64 channels). The total execution time of the observations was four hours, with 136 min-utes on source. J1256-0547 was used as the bandpass calibrator and J1626-2951 was used as the gain calibrator. The flux cali-brator was 3C286.
The data were calibrated in CASA (McMullin et al. 2007), self calibrated on the continuum, and natural weighting was used when imaging. The continuum emission was taken from the eight wideband spectral windows, and has an rms noise of 0.37 mJy/beam in a 2.80′′×1.69′′ beam at a position angle of
29.5◦. SiO, CS, H
2CO , and OCS were observed for this source,
and the transitions, observing frequencies, rms noise limits and beam sizes are listed in Table 1. The rms noise limits in these
Table 1: Observed Transitions and beam properties
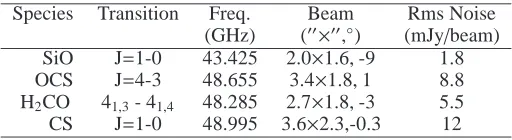
Species Transition Freq. Beam Rms Noise (GHz) (′′×′′,◦) (mJy/beam)
SiO J=1-0 43.425 2.0×1.6, -9 1.8 OCS J=4-3 48.655 3.4×1.8, 1 8.8 H2CO 41,3- 41,4 48.285 2.7×1.8, -3 5.5
CS J=1-0 48.995 3.6×2.3,-0.3 12
Notes. The rms noise limits are for a single (0.78 km s−1) channel, and
the quoted beam angle is the position angle of the major axis.
spectral line cubes are all approximately 2 mJy/beam in each 0.78 km s−1channel.
3. Results
3.1. Large scale outflow traced by CS and SiO
[image:3.595.303.559.513.583.2]P.D. Klaassen et al.: The SiO outflow from IRAS 17233-3606 at high resolution.
better for tracing the higher density gas when CO becomes opti-cally thick. In the ISM, Si is frozen out onto dust grains, but can be liberated through the passage of shocks, allowing it to be ob-served (e.g Gusdorf et al. 2008). Thus, a combination of obser-vations of these three species gives an excellent view of molec-ular outflows and how they interact with their environment.
Of the species directly observed for this study, CS is the most extended. The blue shifted emission to the North-East has an ex-tent of∼12′′, while the red shifted emission to the South-West
has an extent of∼25′′. Our observations are sensitive to struc-tures.60′′, and so it is unlikely we are missing flux in these
ob-servations. No single dish observations of CS J=1-0 exist for this source, so we cannot directly confirm this. However, IRAS17233 was observed in CS J=2-1 by Bronfman et al. (1996). Using the online RADEX calculator (van der Tak et al. 2007), and an am-bient temperature of 30 K, we find good agreement (to within
∼20%) between these two sets of observations and the expected line ratio at this temperature.
The extended emission regions of CS correspond well to the ‘HV’ CO ([-130,-25] and [16,50] km s−1) emission regions
pre-sented in Leurini et al. (2009), and plotted with CS in Figure 1. The velocities of the CS gas here are a factor of 2.5 lower than those of the ‘HV’ gas suggesting these species are respec-tively tracing layers of higher and lower density within the same outflow. It is interesting to note that the two blue ‘EHV’ CO ([-200,-130] and [90,120] km s−1) peaks appear at the ends of
the CS and ‘HV’ CO outflow components. These similarities be-tween the CS and CO emission indicate that these two species are tracing the same outflow, only highlighting the gas at diff er-ent densities and velocities. in Table 2 we preser-ent the outflow dynamics calculated from the CS emission presented here. We note that while CS does appear to trace much of the outflowing material, it is only through the combination of observations of multiple tracers that we are able to piece together the full extent of the outflow. Thus, since the CS does not trace the full outflow, the derived outflow parameters are lower limits to the true mass, and energy of the outflow itself. The outflow dynamics were cal-culated using the same methods described in Peters et al. (2014) or Klaassen et al. (2013) using an ambient temperature of 30K, and a CS abundance of 10−6(Shirley et al. 2003). The age of the
outflow was estimated by dividing the extent of the CS emis-sion by its mean velocity, and then used to calculate the outflow luminosity and mass loss rate.
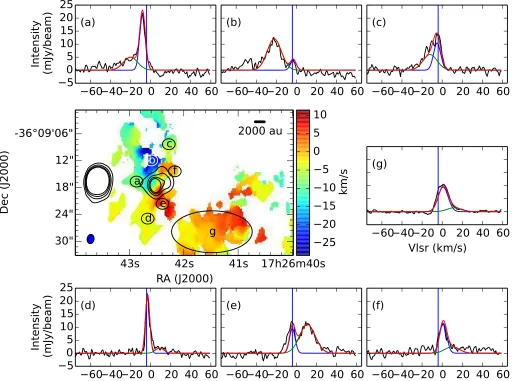
The SiO however, appears to be tracing two distinct shock components. The first moment map of SiO presented in Figure 2 shows highly blue and red shifted emission close to VLA1-2, with lower velocity gas wrapped around it. Examining the spec-tral decomposition shown in Figure 3 highlights these two com-ponents. In both the red and blue shifted lobes, there exists a nar-row (FWHM∼5 km s−1), low velocity (3-5 km s−1from VLSR)
component as well as a broad (FWHM∼ 10 km s−1), high
ve-locity (16 km s−1from V
LSR) component. When analysing these
gaussian components, the peak velocities and gaussian widths were allowed to vary slightly (they were held to within 1 km s−1), while the amplitudes allowed to freely vary.
Using the Gaussian peak velocities and their widths, we cre-ated the integrcre-ated intensity maps presented in Figure 4. This suggests that there are two sets of shocks in this region; high velocity near the outflow core, and lower velocity where the out-flow is interacting with the envelope.
17h26m42s
43s
RA (J2000)
30"
24"
18"
12"
06"
-36°09'00"
De
c (
J20
00
)
2000 au
−25
−20
−15
−10
−5
0
5
10
km
[image:4.595.310.553.57.288.2]/s
Fig. 2: Intensity weighted velocity (first moment) map of the SiO emission coming from the VLA1-2 region. The black contours show the 48 GHz continuum emission at 10, 20, 30 and 40σ(σ =0.37 mJy/beam). The red contours show the 1.3 cm emission starting at 5σand continuing in 1σintervals to 10σ. The red and black contours to the left show the VLA5 HII region. The solid grey and dashed black lines show the directions of the large scale outflow and small scale velocity gradients (respectively).
17h26m42s
43s
RA (J2000)
24"
18"
12"
06"
09'00"
-36°08'54"
De
c (
J20
00
)
High Velocity SiO
±
11-21 km s
−117h26m42s
43s
RA (J2000)
Low Velocity SiO
±
1-6 km s
−1400
800
1200
1600
2000
2400
2800
H
2In
ten
sit
y
Fig. 4: Blue- and red-shifted integrated intensities of the high (left) and low (right) velocity SiO emission components outlined in Figure 3. The SiO emission is superimposed on the H2
emis-sion from the VLA1-2 region (greyscale). In each case, the con-tours of the SiO emission are set at 10, 20, 30 and 40σ. From these images, the spatial distribution of the two components can be seen, with the lower velocity shocks tracing the edges of the outflow cavity, and the high velocity shocks tracing the powered jet/outflow close to the HII regions in the centre of the emission.
3.2. Small scale dynamics
[image:4.595.310.556.404.556.2]Table 2: Lower Limits to Outflow Properties derived from CS emission
Mass Momentum Energy Luminosity Mass Loss Rate (M⊙) (M⊙km s−1) (1045erg) (L⊙) (10−3M⊙yr−1)
Blue 30.104±0.003 305.53±0.05 35.70±0.01 36±2 3.7±0.2 Rd 12.347±0.003 233.79±0.08 45.00±0.02 46±3 1.5±0.1 Total 42.451±0.004 539.32±0.09 80.70±0.02 82±4 5.3±0.2
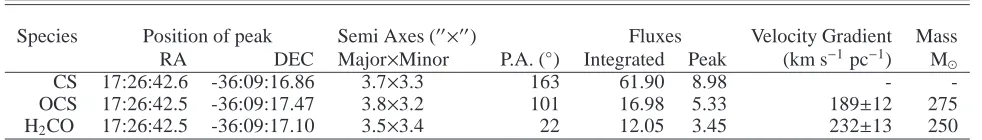
Table 3: Gaussian fits to the peaks of the CS, OCS and H2CO emission, and resultant velocity gradients and dynamical masses.
Species Position of peak Semi Axes (′′×′′) Fluxes Velocity Gradient Mass
RA DEC Major×Minor P.A. (◦) Integrated Peak (km s−1pc−1) M
⊙
CS 17:26:42.6 -36:09:16.86 3.7×3.3 163 61.90 8.98 -
-OCS 17:26:42.5 -36:09:17.47 3.8×3.2 101 16.98 5.33 189±12 275 H2CO 17:26:42.5 -36:09:17.10 3.5×3.4 22 12.05 3.45 232±13 250
Notes. The uncertainties of the axis lengths and position angles are 0.03′′and 3◦respectively, and come from the deconvolved gaussian fits to the
data. The integrated and peak fluxes have units of Jy beam−1km s−1and Jy beam−1, respectively.
Both CS and SiO are strongly peaked in the central region concentrated on VAL1-2. Indeed, to its 50% emission contour, CS appears broadly gaussian, the parameters of which are given in Table 3.
On these smaller scales, all of the molecules observed for this study have velocity gradients along the same direction, tilted by 45◦ from the position angle of the outflow (see the dashed and
solid lines in Figures 2 and 5). We will focus our analysis of these velocity gradients on OCS and H2CO which only sit on these
smaller scales. The conditions required to excite these species are denser and hotter than the other observed tracers making them ideal for understanding these dynamics.
OCS is generally only found when temperatures rise above 200 K (Jiménez-Serra et al. 2012). H2CO is formed on dust
grains, and thus requires warm temperatures to be liberated. Their abundances can also be quite low in comparison to CS and CO. The abundance of OCS is observed to be ∼ 2.2×
10−8 with respect to H
2 (Charnley 1997), and the abundance
of H2CO varies between 10−9 −10−10 between regions (e.g.
Ginard et al. 2012; Noble et al. 2012; Guzmán et al. 2011). The combination of high excitation temperatures and low abundances means that both OCS and H2CO trace the inner (warm) areas
near the HII region.
Both OCS and H2CO emit in roughly Gaussian regions, the
parameters of which are given in Table 3. From these fits, we see that this emission is well resolved by our observations. The velocity gradients calculated from the velocity shifts in the emis-sion (∼8 km s−1) and the sized of the emitting regions are listed
in Table 3, as are the internal masses which would be required to support these velocity gradients if they were due to purely Keplerian rotation.
That these velocity gradients are at 45◦ to the outflow
and not perpendicular as would be expected from a traditional disk/outflow system suggests that there is some other mecha-nism contributing to these dynamics. The nature of this emission is discussed further in Section 4.2.
Using the methods described in Klaassen et al. (2009), we calculated the gas mass from the emission of OCS. To do this, required a number of assumptions. The first, that the OCS is op-tically thin, comes from comparing the OCS intensity to that of O13CS where the O13CS peaks in our observations. The second
is that the temperature of the OCS gas is 300 K, stemming from requiring a minimum temperature near 200 K for the emission to appear. Varying the temperature by 100 K up or down only changes the results at the level of 10%. The third assumption is that the abundance of OCS is 2.2×10⁻⁸(Charnley 1997). From these assumptions, we derived a gas column density, which we multiplied by the emitting area delimited by the semi-major and -minor axes listed in Table 3. Through this analysis, we deter-mine a gas mass of∼690 M⊙in the OCS emitting region.
4. Discussion
4.1. Large scale outflow
Contrary to previously published high resolution observations of this region (e.g. Leurini et al. 2008, 2011, 2013), we suggest that there is only one large scale outflow from the VLA1-2 region of IRAS 17233, and that the various molecules detected in this re-gion are simply tracing its various components. A simple cartoon of the various outflow components is given in Figure 7 to help guide the reader through the following arguments.
Here we first discuss how the various species are tracing a single outflow in the blue-shifted lobe, and then extend our anal-ysis to the more complicated red-shifted lobe.
In this picture, the highest velocity SiO emission is tracing the shocks produced, centrally, by the infall/accretion driven out-flow. The lower velocity SiO is in turn tracing the shocks pro-duced as the outflow hits the relatively high density material at the edges of the outflow cavity.
The ‘HV’ CO component as well as the CS emission are both tracing the bulk of the outflow emission within the well defined outflow cavity (delineated by the lower velocity SiO emission) as shown in Figure 1. At larger distances from the powering sources in VLA1-2, where the CS and ‘HV’ CO emission starts dropping off, the 2.12µm H2emission shown in Figures 4 and 8 begins to
become stronger.
This detection of H2 as the CS and CO emission becomes
[image:5.595.54.545.179.249.2]P.D. Klaassen et al.: The SiO outflow from IRAS 17233-3606 at high resolution.
17h26m40s
41s
42s
43s
RA (J2000)
30"
24"
18"
12"
-36°09'06"
De
c (
J20
00
)
a
b
c
d
e
f
g
2000 au
−25
−20
−15
−10
−5
0
5
10
km
/s
−60−40−20 0 20 40 60
−5
0
5
10
15
20
25
Int
en
sit
y
(m
Jy/
be
am
)
(a)
−60−40−20 0 20 40 60
(b)
−60−40−20 0 20 40 60
(c)
−60−40−20 0 20 40 60
−5
0
5
10
15
20
25
Int
en
sit
y
(m
Jy/
be
am
)
(d)
−60−40−20 0 20 40 60
(e)
−60−40−20 0 20 40 60
(f)
−60−40−20 0 20 40 60
Vlsr (km/s)
[image:6.595.44.561.62.443.2](g)
Fig. 3: The colour scale in the central panel shows the SiO intensity weighted velocity map as in Figure 2. The seven ellipses (labelled a-g) shown in this middle panel correspond to the regions over which the spectra in the correspondingly labelled panels were averaged. The vertical blue line in each spectral panel corresponds to the Vlsrof the source (-3.4 km s−1). The blue and green
curves in these panels correspond to the narrow, low velocity (blue) and broad, high velocity (green) components of the outflow, both red and blue shifted from the rest velocity.
As the outflow continues outward, it encounters more rar-efied gas. As the outflow moves though the lower density ma-terial outside of the shocked envelope, it begins impacting onto this material and entraining it. This explains the two ‘EHV’ CO emission features at the tips of the low velocity SiO shocks. The conditions in the ‘EHV’ region must not be right for the out-flow to create C-shocks (and form SiO), but it is still present and entraining CO.
Further still from VLA1-2 is a bright clump of H2emission
(towards the top of Figures 4 and 8, in greyscale and green, re-spectively). This could be tracing the area where the outflow is hitting the (relatively) static ambient medium. Indeed, the H2at
the head of the outflow has a bowed morphology.
Thus, the blue shifted emission of various molecules to the North-East of VLA1-2 can thus be explained by a single outflow interacting with an environment with changing characteristics.
Interpreting the redshifted emission is not as straight for-ward. However, using the assumption that there is a large scale outflow in this system, the various components of the red-shifted emission can be explained.
The ‘HV’ CO to CS relationship is not quite as clear in the red-shifted outflow lobe. Near the central core of VLA1-2, and along the (narrow) core of the outflow, the two species appear to be tracing the same gas, however the bulk of the ‘HV’ CO emis-sion tends to bend southward from the main outflow direction once it has left the central core.
17h26m42s
43s
RA (J2000)
28"
24"
20"
16"
12"
-36°09'08"
De
c (
J20
00
)
OCS
−8
−7
−6
−5
−4
−3
−2
−1
0
Ve
loc
ity
(k
m/
s)
17h26m42s
43s
28"
24"
20"
16"
12"
-36°09'08"
De
c (
J20
00
)
H
2CO
−8
−7
−6
−5
−4
−3
−2
−1
0
Ve
loc
ity
(k
m/
s)
Fig. 5: Intensity weighted velocity (first moment) maps of the OCS and H2CO emission observed towards VLA 2a, VLA1a and
VLA1b. The contours show the 10, 20, 30, and 40σcontours of the 48 GHz continuum emission. The solid grey line shows the position angle of the outflow as outlined in Figure 2, and the dashed black line shows the direction of the velocity gradi-ents indicated here. The colour scales in each panel are identical, which indicates that the H2CO has a larger velocity gradient than
the OCS, since they emit on roughly the same spatial scales.
medium. This ‘early’ breakout into the ambient medium of the red-shifted outflow lobe explains why there is no double walled outflow cone in the red-shifted material that mirrors the one seen in the low velocity blue-shifted SiO.
In Figure 9 we show the Position Velocity diagram of the CS and SiO emission along the direction of the solid grey line in Fig-ures 2 and 5. We see a butterfly morphology in the SiO emission reminiscent of both the jet and outflow structures seen in CO and SiO (respectively) in the low mass region L1448 by Hirano et al. (2010). Our SiO shows both of these components, in a single tracer. In the SiO emission (colourscale) we see both the low and high velocity components of the SiO emission. Because SiO is a good tracer of shocked gas (see, for instance, Gusdorf et al. 2008), these two SiO components are likely tracing two different shock regions associated with this outflow. The first, high veloc-ity shock region, is showing the energetic outflow coming from the protostars, while the second, low velocity shock region, is showing the interaction of the outflow with the cavity wall. That these various components are symmetric about the VLA1-2 re-gion in terms of red and blue shifted material, suggests we are
[image:7.595.41.548.59.395.2]17h26m42s
43s
RA (J2000)
28"
24"
20"
16"
12"
-36°09'08"
De
c (
J20
00
)
OCS
0.0
0.5
1.0
1.5
2.0
2.5
3.0
3.5
4.0
4.5
Ve
loc
ity
(k
m/
s)
17h26m42s
43s
RA (J2000)
28"
24"
20"
16"
12"
-36°09'08"
H2
CO
0.0
0.4
0.8
1.2
1.6
2.0
2.4
2.8
3.2
Ve
loc
ity
(k
m/
s)
Fig. 6: Integrated intensity (zeroth moment) maps of the OCS and H2CO emission observed towards VLA 2a, VLA1a and
VLA1b (white crosses). In the H2CO plot, the contours show the
10, 20, 30, and 40σcontours of the 48 GHz continuum emis-sion, while in the OCS plot, they show the 3 and 6σcontours of the O13CS emission. The solid grey line shows the position an-gle of the outflow as outlined in Figure 2, and the dashed white line shows the direction of the velocity gradients indicated here.
observing a single outflow and its interaction with its environ-ment.
What is causing this single, large scale, outflow is not com-pletely clear. If there is a single massive forming star responsible for this outflow in either VLA1 or VLA2, we are unable to distin-guish it using our observations. The VLA1-2 region appears to be embedded in a rotating structure spanning a few thousand au, and the powering source for the large scale outflow is embedded within it.
P.D. Klaassen et al.: The SiO outflow from IRAS 17233-3606 at high resolution.
C
a
v
it
y
W
a
ll
C
a
v
it
y
W
a
ll
EH
V
CO
EH
V
C
O
EH
V
CO
EH
V
CO
HV CO
CS
VLA 2
VLA 1
H
2
Envelope
[image:8.595.316.553.57.298.2]High vel.
SiO
Fig. 7: Cartoon of the IRAS17233 outflow, as it appears on the sky. The black stars in the centre of the outflow show the ap-proximate positions of VLA2a, VLA1a and VLA1b, while the smaller (grey) stars show the positions of VLA 2b-d. The cones at the centre of the figure show the high velocity SiO component, while the wide lines within the cavity wall show the low veloc-ity SiO emission component. The regions of EHV and HV CO, as well as general CS emission are labelled, and the envelope through which the outflow is expanding is shown with a grey oval. Note that the ends of the outflow extend further than the envelope, explaining the presence of EHV CO at the ends of the outflowing structure. The presence of an H2emission feature to
the North of the outflow is also depicted here.
4.2. Small scale dynamics: a combination of rotation and outflow
While we cannot rule out that there is a small scale outflow at a 45◦ to the large scale one (OF1 in the nomenclature of
Leurini et al. 2008), here we explore the possibility of the small scale velocity gradient resulting from a combination of rotation and outflow motions.
As shown in Figures 5 and 6, the emitting regions for OCS and H2CO are spatially similar, and both are quite circular
de-spite being well resolved with our VLA beam. The emission peaks are separated by 0.3′′(300 AU), which is significant given
our beam size (∼2”) and signal to noise ratio (∼500) for these species. We note that both peaks lie along the line joining VLA2a
17h26m42s
43s
44s
RA (J2000)
20"
10"
09'00"
-36°08'50"
De
c (
J20
00
)
SiO
H
2
EHV CO
VLA 5
VLA 2
VLA 1
Fig. 8: SiO (red), CO (blue) and H2(green) emission in the blue
shifted outflow lobe from IRAS17233 VLA1-2. The SiO and CO emission are integrated over [-40,0] and [-200,-130] km s−1
re-spectively. The H2is integrated over the entire line. This shows
how the different emission components all contribute to a single outflow. The contours show the 48 GHz continuum emission, with VLA5 to the left, and the VLA1-2 region to the right.
and VLA1b, as well as the axis of the velocity gradient. The ve-locity gradients of the emission from these two species have the same position angle (∼60◦, see Figure 5) and are therefore
prob-ably tracing similar gas components. The position angle (high-lighted by a dashed black line in Figures 2 and 5) is at about a 45◦ angle to the large scale outflow direction (highlighted with
a solid grey line in the same figures). That there is a 45◦ an-gle, instead of the small scale velocity gradients being parallel or perpendicular to the large scale outflow suggests that OCS and H2CO are tracing a combination of velocity structures.
Leurini et al. (2011) suggest that the observed velocity gra-dient seen in their CH3CN (see their Figure 9) was likely due
to the combined effects of two outflows. Beuther et al. (2009), who observed this velocity gradient in ammonia, attributed it to (non-Keplerian) rotation of the envelope from which the cluster is forming.
We propose a common ground between these two explana-tions. We suggest that these species, as well as the CH3CN and
OCS observed by Leurini et al. (2011), are tracing a combina-tion of outflow and rotacombina-tional mocombina-tions. This proposal is based on comparing the observed velocity gradients (including their po-sition angles) to toy radiative transfer models similar to those presented in Wang et al. (2012).
Wang et al. (2012) showed that when both rotation and out-flow motions are included in radiative transfer modelling, the position angle of the velocity gradient shifts depending on the relative velocities of these two components. We applied similar modelling techniques, as described below.
[image:8.595.40.295.57.438.2]-15-10 -5 0 5 10 15
Angular Offset ('')
-50
-40
-30
-20
-10
0
10
Ve
loc
ity
(k
m/
s)
[image:9.595.41.289.61.354.2]0.0000
0.0025
0.0050
0.0075
0.0100
0.0125
0.0150
0.0175
0.0200
0.0225
Fig. 9: SiO (colourscale), CS (white contours) and H2CO (black
contours) position-velocity diagram for a cut along the grey line shown in Figures 2 and 5. The units of the colour scale are Jy/beam, and the contours of the CS and H2CO emission
corre-spond to 10% to 90% of the peak value, in steps of 20%. The SiO emission in particular shows both high and low velocity compo-nents, while the CS traces an arc with both high and low velocity gas. These patterns are best seen in the blue shifted material.
We find that to reproduce the position angle of the H2CO and
OCS velocity gradients requires rotational velocities approxi-mately three times greater than outflow velocities at a charac-teristic radius of 1000 AU (1′′). On these size scales, we cannot separate out purely rotational or outflow motions, however we can take the characteristic SiO velocities discussed in Section 3.1 as a proxy, and calculate rotational dynamics from that. The characteristic velocities of the SiO (5 and 16 km s−1with respect
to the rest velocity of the source) correspond to rotational veloc-ities of 15 and 48 km s−1, which we further assume hold at 1000
AU. If the gas were undergoing Keplerian motions, we would expect internal masses of 250 and 2600 M⊙for the two SiO
com-ponents. The first is a third of the gas mass derived above from the OCS emission, and the second is larger than the gas mass of the entire region. If this velocity were achieved at radii differing from 1000 AU, the mass would increase (for larger radii) or de-crease (for smaller radii) linearly with the radius. To reach the 690 M⊙calculated for the gas mass would require a
character-istic radius of 3000 AU, which is only slightly smaller than the radius of the OCS emission.
5. Conclusions
We have presented molecular line observations of the gas in the massive star forming region IRAS 17233-3606, and find that
de-spite there being multiple HII regions in the VLA1 and VLA2 regions (as defined by Zapata et al. 2008), there is a single large scale (∼0.15 pc) outflow coming from these HII regions. These outflow motions are traced by SiO, CS and previously published CO and H2 emission in this region. Our results show that
de-spite there being multiple sites of massive star formation within VLA1-2, there is likely only one large scale outflow from the system. The large scale SiO emission appears to break down into two components; a small scale highly collimated, high ve-locity emission component, and a larger scale, lower veve-locity component. The first component traces shocks produced by the powered outflow itself, while the second, larger scale component traces the shocks at the edges of the outflow cavity.
The emission from OCS and H2CO are on much smaller
scales, and the velocity gradients seen in their emission could be due to a combination of a rotating envelope around VLA1-2, and material being swept up into the large scale outflow traced by SiO, CS and CO. We find that the implied masses from the small scale velocity gradients (∼ 250 M⊙) are consistent with
form-ing a few massive stars, and are are approximately a third of the mass determined from the integrated intensity of the molecular emission (∼690 M⊙).
Acknowledgements. The authors would like to thank J.C. Mottram for helpful discussions during the preparation of this manuscript, and both the referee and the editor for their comments which helped strengthen our results and conclu-sions. This manuscript makes use of VLA data. The National Radio Astronomy Observatory is a facility of the National Science Foundation operated under co-operative agreement by Associated Universities, Inc.
References
Beltran, M. T., Cesaroni, R., Neri, R., & Codella, C. 2011, Astronomy and As-trophysics, 525, A151
Beuther, H., Walsh, A. J., & Longmore, S. N. 2009, The Astrophysical Journal Supplement Series, 184, 366
Brinch, C. & Hogerheijde, M. R. 2010, Astronomy and Astrophysics, 523, 25 Bronfman, L., Nyman, L. A., & May, J. 1996, Astronomy and Astrophysics
Sup-plement, 115, 81
Charnley, S. B. 1997, The Astrophysical Journal, 481, 396
de Wit, W. J., Testi, L., Palla, F., Vanzi, L., & Zinnecker, H. 2004, Astronomy and Astrophysics, 425, 937
Duarte-Cabral, A., Bontemps, S., Motte, F., et al. 2013, Astronomy and Astro-physics, 558, 125
Ginard, D., González-García, M., Fuente, A., et al. 2012, Astronomy and Astro-physics, 543, A27
Gusdorf, A., Cabrit, S., Flower, D. R., & Pineau des Forêts, G. 2008, Astronomy and Astrophysics, 482, 809
Guzmán, V., Pety, J., Goicoechea, J. R., Gerin, M., & Roueff, E. 2011, Astron-omy and Astrophysics, 534, 49
Hirano, N., Ho, P. P. T., Liu, S.-Y., et al. 2010, The Astrophysical Journal, 717, 58
Jiménez-Serra, I., Zhang, Q., Viti, S., Martin-Pintado, J., & de Wit, W. J. 2012, The Astrophysical Journal, 753, 34
Klaassen, P. D., Juhasz, A., Mathews, G. S., et al. 2013, Astronomy and Astro-physics, 555, A73
Klaassen, P. D., Wilson, C. D., Keto, E. R., & Zhang, Q. 2009, The Astrophysical Journal, 703, 1308
Leurini, S., Codella, C., Gusdorf, A., et al. 2013, Astronomy and Astrophysics, 554, 35
Leurini, S., Codella, C., Zapata, L., et al. 2011, Astronomy and Astrophysics, 530, 12
Leurini, S., Codella, C., Zapata, L. A., et al. 2009, Astronomy and Astrophysics, 507, 1443
Leurini, S., Hieret, C., Thorwirth, S., et al. 2008, Astronomy and Astrophysics, 485, 167
McMullin, J. P., Waters, B., Schiebel, D., Young, W., & Golap, K. 2007, CASA Architecture and Applications
Noble, J. A., Theule, P., Mispelaer, F., et al. 2012, Astronomy and Astrophysics, 543, A5
P.D. Klaassen et al.: The SiO outflow from IRAS 17233-3606 at high resolution.
Raga, A. C., Cantó, J., de Colle, F., et al. 2009, Revista Mexicana de Astronomia y Astrofisica Conference Series, 36, 186
Shepherd, D. 2005, Proceedings of the International Astronomical Union, 1, 237 Shirley, Y. L., Evans, I., Young, K. E., Knez, C., & Jaffe, D. T. 2003, The
Astro-physical Journal Supplement Series, 149, 375
van der Tak, F. F. S., Black, J. H., Schöier, F. L., Jansen, D. J., & van Dishoeck, E. F. 2007, Astronomy and Astrophysics, 468, 627
Wang, K. S., van der Tak, F. F. S., & Hogerheijde, M. R. 2012, Astronomy and Astrophysics, 543, 22
Zapata, L. A., Leurini, S., Menten, K. M., et al. 2008, The Astronomical Journal, 136, 1455
Zapata, L. A., Schmid-Burgk, J., Ho, P. T. P., Rodríguez, L. F., & Menten, K. M. 2009, The Astrophysical Journal Letters, 704, L45
Zapata, L. A., Tang, Y.-W., & Leurini, S. 2010, The Astrophysical Journal, 725, 1091
Zinnecker, H. & Yorke, H. W. 2007, Annual Review of Astronomy and Astro-physics, 45, 481
Appendix A: Description of Toy Radiative Transfer Models
Without attempting to directly model the velocity field of IRAS17233, we used LIME radiative transfer models to deter-mine what combination of outflow and rotational motions could cause a 45◦degree offset between the large scale outflow and the small scale velocity gradients in the molecular gas.
To do this, we simplistically assumed temperature, density and velocity profiles of the form:
T =To
r
rd
!−β
Vr=vro
r
ro
n=no
r
rd
!−α
(sinθ)f+no∗
r
rd
!
Vφ=
q
GM r20au
where r, θ and φ represent the coordinate grid, β = 1,
α = 1.5, f is the flattening parameter of the rotating structure ( f = 5), rd is the distance between VLA2a and VLA1 (2000
au), and r20auis the given radius outwards of 20 au, but fixed at
20 au for smaller radii to avoid a divide by zero. The resultant velocity grids from this modelling are shown in Figure A.1. As shown here, a combination of purely rotational motion along the midplane, and outflow motion perpendicular to it creates a sce-nario where the observed combination of these two effects is a velocity gradient at 45◦to both. The outer edges of the combined motions shows where the density and temperature become low enough that OCS and H2CO are no longer observable.
[image:10.595.324.526.59.646.2]Appendix B: SiO and CS Channel maps
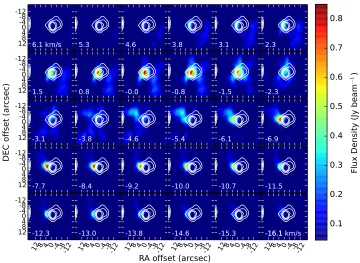
Figures B.1 and B.2 show, respectively, the channel maps of the SiO and CS emission surrounding IRAS17233 VLA2-1. The centre of each panel shows the same 48 GHz continuum con-tours as previous figures for reference. Note that the sizes of each panel are consistent between the two figures, however the start-ing and endstart-ing velocities are slightly shifted to reflect the bulk of the emission for each of the two species.
(a) outflow motions
(b) rotational motions
[image:10.595.36.230.357.413.2](c) combined motions
128
40
-4-8
-12
11.9 km/s 11.1
10.2
9.3
8.5
7.6
128
40
-4-8
-12
6.8
5.9
5.0
4.2
3.3
2.4
128
40
-4-8
-12
1.6
0.7
-0.2
-1.0
-1.9
-2.7
128
40
-4-8
-12
-3.6
-4.5
-5.3
-6.2
-7.1
-7.9
12 8 4 0 -4 -8-12
128
40
-4-8
-12
-8.8
12 8 4 0 -4 -8-12
-9.6
12 8 4 0 -4 -8-12
-10.5
12 8 4 0 -4 -8-12
-11.4
12 8 4 0 -4 -8-12
-12.2
12 8 4 0 -4 -8-12
-13.1
-13.1 km/s
0.006
0.009
0.012
0.015
0.018
0.021
0.024
0.027
RA offset (arcsec)
DE
C o
ffse
t (
arc
se
c)
Flu
x De
nsi
ty
(Jy
be
am
−
[image:11.595.125.490.81.345.2]1
)
Fig. B.1: SiO channel map. The white contours indicate the 48 GHz continuum, consistent with previous figures, and the colourscale shows the SiO emission starting at 3σ
128
40
-4-8
-12
6.1 km/s
5.3
4.6
3.8
3.1
2.3
128
40
-4-8
-12
1.5
0.8
-0.0
-0.8
-1.5
-2.3
128
40
-4-8
-12
-3.1
-3.8
-4.6
-5.4
-6.1
-6.9
128
40
-4-8
-12
-7.7
-8.4
-9.2
-10.0
-10.7
-11.5
12 8 4 0 -4 -8-12
128
40
-4-8
-12
-12.3
12 8 4 0 -4 -8-12
-13.0
12 8 4 0 -4 -8-12
-13.8
12 8 4 0 -4 -8-12
-14.6
12 8 4 0 -4 -8-12
-15.3
12 8 4 0 -4 -8-12
-16.1
-16.1 km/s
0.1
0.2
0.3
0.4
0.5
0.6
0.7
0.8
RA offset (arcsec)
DE
C o
ffse
t (
arc
se
c)
Flu
x De
nsi
ty
(Jy
be
am
−
1