White Rose Research Online URL for this paper:
http://eprints.whiterose.ac.uk/131463/
Version: Published Version
Article:
Grundy, M., Jones, T., Elmi, L. et al. (4 more authors) (2018) Early changes in rpS6
phosphorylation and BH3 profiling predict response to chemotherapy in AML cells. PLoS
ONE, 13 (5). e0196805. ISSN 1932-6203
https://doi.org/10.1371/journal.pone.0196805
© 2018 Grundy et al. This is an open access article distributed under the terms of the
Creative Commons Attribution License, which permits unrestricted use, distribution, and
reproduction in any medium, provided the original author and source are credited.
(http://creativecommons.org/licenses/by/4.0/)
[email protected] https://eprints.whiterose.ac.uk/
Reuse
This article is distributed under the terms of the Creative Commons Attribution (CC BY) licence. This licence allows you to distribute, remix, tweak, and build upon the work, even commercially, as long as you credit the authors for the original work. More information and the full terms of the licence here:
https://creativecommons.org/licenses/
Takedown
If you consider content in White Rose Research Online to be in breach of UK law, please notify us by
Early changes in rpS6 phosphorylation
and BH3 profiling predict response to
chemotherapy in AML cells
Martin Grundy1*, Thomas Jones2, Liban Elmi2, Michael Hall2, Adam Graham2, Nigel Russell1,2, Monica Pallis1
1Clinical Haematology, Nottingham University Hospitals, Nottingham, United Kingdom,2Department of Haematology, Division of Cancer and Stem Cells, University of Nottingham, Nottingham, United Kingdom
Current address: Academic Unit of Molecular Oncology, Department of Oncology and Metabolism, University of Sheffield, Sheffield, United Kingdom
Abstract
Blasts from different patients with acute myeloid leukemia (AML) vary in the agent(s) to which they are most responsive. With a myriad of novel agents to evaluate, there is a lack of predictive biomarkers to precisely assign targeted therapies to individual patients. Primary AML cells often survive poorlyin vitro, thus confounding conventional cytotoxicity assays.
The purpose of this work was to assess the potential of two same-day functional predictive assays in AML cell lines to predict long-term response to chemotherapy. (i) Ribosomal pro-tein S6 (rpS6) is a downstream substrate of PI3K/akt/mTOR/ kinase and MAPK kinase path-ways and its dephosphorylation is also triggered by DNA double strand breaks. Phospho-rpS6 is reliably measurable by flow cytometry and thus has the potential to function as a bio-marker of responsiveness to several therapeutic agents. (ii) A cell’s propensity for apoptosis can be interrogated via a functional assay termed “Dynamic BH3 Profiling” in which mito-chondrial outer membrane permeabilization in drug-treated cells can be driven by pro-apo-ptotic BH3 domain peptides such as PUMA-BH3. The extent to which a particular cell is primed for apoptosis by the drug can be determined by measuring the amount of cyto-chrome C released on addition of BH3 peptide. We demonstrate that phospho-rpS6 expres-sion and PUMA-BH3 peptide-induced cytochrome C release after 4 hours both predict long term chemoresponsiveness to tyrosine kinase inhibitors and DNA double strand break inducers in AML cell lines. We also describe changes in expression levels of the prosurvival BCL-2 family member Mcl-1 and the pro-apoptotic protein BIM after short term drug culture.
Introduction
AML is a heterogeneous clonal disorder of haemopoietic progenitor cells where both failure to differentiate and over proliferation results in accumulation of non-functional cells termed myeloblasts.[1] While nearly 80% of younger AML patients may initially achieve complete remission with current therapy, most will relapse with resistant disease.[2] Clinical outcomes
a1111111111 a1111111111 a1111111111 a1111111111 a1111111111 OPEN ACCESS
Citation:Grundy M, Jones T, Elmi L, Hall M, Graham A, Russell N, et al. (2018) Early changes in rpS6 phosphorylation and BH3 profiling predict response to chemotherapy in AML cells. PLoS ONE 13(5): e0196805.https://doi.org/10.1371/journal. pone.0196805
Editor:Ken Mills, Queen’s University Belfast, UNITED KINGDOM
Received:January 29, 2018
Accepted:April 19, 2018
Published:May 3, 2018
Copyright:©2018 Grundy et al. This is an open access article distributed under the terms of the
Creative Commons Attribution License, which permits unrestricted use, distribution, and reproduction in any medium, provided the original author and source are credited.
Data Availability Statement:All relevant data are within the paper and its Supporting Information files.
in the elderly are even more modest as these patients do not tend to tolerate intensive chemo-therapy regimens and frequently have adverse cytogenetics.[1]
There are many obstacles a chemotherapeutic drug has to circumvent before it can kill a leukaemia cell. Briefly, the drug has to reach its target, initiate the appropriate pro-apoptotic signals and overcome the cell’s anti-apoptotic defences. Despite the abundance of novel agents that have the potential to improve patient outcome, we are still lacking assays that clinicians can be offered to demonstrate which drugs the individual patient will best respond to. Most efforts in assigning therapy involve predicting a patient’s response to an agent based on their cytogenetic profile. The obvious solution might be chemosensitivity assays, but these have been tried, tested and found wanting.[3,4] A confounding issue is that cells can be fragileex vivo, and most AML cells will die spontaneously in culture fairly quickly (median survival at
48 hours = 38% of baseline).[5] Assays have been developed to maintain leukaemia cellsin vitro, but AML samples are so heterogeneous that there is no “one-size-fits all” methodology
for keeping them alive once they have been isolated from the patient. By focusing on same-day assays, with intact cells, we hope to overcome this obstacle.
Ribosomal protein S6 is a downstream substrate of PI3K/akt/mTOR/ p70S6 kinase and MAPK/p90S6 kinase pathways and is also dephosphorylated following DNA double strand breaks.[6–10] RpS6 is a constituent of the 40S ribosomal subunit that is phosphorylated at sev-eral sites including serines 235/236 and 240/244 upon activation by p70S6 and p90S6 kinases. [6] Phosphorylation of rpS6 controls mRNA translation in dividing cells,[11] and its recruit-ment to the 7-methylguanosine cap structure suggests a role in regulating assembly of the translation preinitiation complex.[8] The AKT and/or MAPK signalling pathways are consti-tutively active in the majority of AML cases.[12,13] We have recently determined that rpS6 is hyperphosphorylated in AML patient samples, with phosphorylation being over 20 fold higher than in normal mobilised CD34+ cells.[14] Moreover, rpS6 phosphosrylation in patient sam-ples can be abrogated by AKT and/or ERK inhibitors.[15] Some types of AML therapy, such as DNA damaging agents and receptor kinase inhibitors, might be expected to converge to dephosphorylate rpS6 through their actions on the akt/mTOR, ATM/AMPK/mTOR and/or ERK pathways.[9,16] Phosphorylated rpS6 is therefore a potential biomarker of responsive-ness to several therapeutic agents. Antibodies to rpS6 phosphorylated at serine 235/236 have been optimised for flow cytometry, where they are well-established as biomarkers for mTORC1 activity.[17,18]
The B-Cell Lymphoma-2 (Bcl-2) family of proteins act at the mitochondria and regulate the internal apoptotic pathway. For apoptosis to occur, the proapoptotic effector molecules BAK and BAX must oligomerise and form pores that cause mitochondrial outer membrane permea-bilisation (MOMP) resulting in cytochrome c release. Effector molecule activation can be trig-gered by BH3-only proapoptotic BCL-2 family members such as PUMA, BIM and BID.[19] These pro-apoptotic family members are usually sequestered by BCL-2 family prosurvival members such as MCL-1, BCL-2, and BCL-XLwhich serves to hold apoptosis in check.[20] A
cell’s propensity for apoptosis can be interrogated via a functional assay termed “Dynamic BH3 Profiling”.[21] Dynamic BH3 profiling can predict cellular responses to therapy based on measuring the capacity of drugs to prime mitochondria for apoptosis. The technique involves the addition of permeable pro-apoptotic BH3 peptides to drug primed cells to induce rapid mitochondrial outer membrane permeabilisation. The extent to which a particular cell is primed for apoptosis can be determined by measuring the amount of cytochrome c released. [22] Dynamic BH3 profiling using imatinib (with a 16 hour incubation) was found to predict clinical responsiveness in CML patients.[21]
In this study we assess whether short term (4 hour) rpS6 de-phosphorylation and/or PUMA-BH3 peptide-driven cytochrome c release can predict long-term (48 hour) response to Competing interests:The authors have declared
chemotherapeutic drugs. As primary AML cells are unstablein vitrowe utilize a panel of AML
cell lines in order to obtain robust 48 hour IC50values for reliable comparison with the short
term functional assays. We also investigate whether drug exposure induces rapid changes in expression levels of Bcl-2 protein family members.
Materials and methods
Materials
Drugs and suppliers used in the study were as follows: 17-AAG, rapamycin, sorafenib, U0126 and torin 1 from LC labs (www.lclabs.com); AC220 and vosaroxin from Selleck (supplied by Stratech UK); etoposide from Tocris; gemtuzumab ozogamicin (GO) was a gift from Wyeth, Pearl River USA. C2 ceramide and Calyculin A were from Santa Cruz Biotechnology, Santa Cruz, CA, USA. Ly294006 was from Millipore, Watford, UK. Other drugs and reagents were from Sigma (Poole, Dorset, UK) unless specified.
Cells
OCI-AML3, MOLM-13 and M-07e myeloid leukaemia cell lines were obtained from the Ger-man Collection of Microorganisms and Cell Cultures (DSMZ, Braunschweig, GerGer-many). U937 and KG1a cell lines were from the European Collection of Animal Cell Cultures (Salis-bury, UK). MV4-11 and TF-1a cells were obtained from the American Type Culture Collection (Manassas, VA, USA). HL-60 cells were a gift from Dawn Bradbury (Nottingham University Hospitals, UK), OCI-AML6.2 cells were a gift from Dr. Jo Mountford (University of Glasgow, UK), M0-91 cells were a gift from Joseph Scandura (Cornell Medical College, USA). OCI-AMLDNR cells were developed in our laboratory.[23] HL-60, U937, OCI-AML3, OCI-AML DNR, OCI-AML6.2, MOLM-13, TF-1a, M0-91 and MV4-11 cell lines were maintained in RPMI 1640 medium with 10% foetal calf serum (FCS; First Link, Birmingham, UK), 2mM L-glutamine, 100 U/ml penicillin and 10μg/ml streptomycin. The KG1a and M-07e cell lines were maintained as above with 20% FCS and the M-07e having the addition of 10ng/ml GM-CSF (Novartis, Basel, Switzerland). All cultures were kept at 37˚C in 5% CO2and all
exper-iments were performed with cell lines in log phase. Regular testing to authenticate these cell lines was performed using multiplex short tandem repeat analysis (Powerplex 16; Promega, Southampton, UK). Mycoplasma testing was carried out routinely using the Mycoalert myco-plasma detection kit (Lonza, Rockland, USA) and following the manufacturer’s instructions.
Chemosensitivity assay
Cells were plated in triplicate at 2.5x10⁵/ml with drug or untreated controls in 96 well plates. Plates were incubated for 48 hours at 37˚C in 5% CO2 with the addition of alamar blue (Sero-tec, BUF012A) for the final 4 hours. Fluorescence was recorded using a POLARstar optima plate reader (BMG technologies, UK). Cell lines were deemed sensitive or resistant to each agent using the following criteria (<5 X 10thcentile IC50= sensitive;>5 X 10thcentile IC50=
resistant).
Phospho-S6 ribosomal protein expression
inhibitor U0126 (3μM). Adjustments for baseline rpS6 phosphorylation and expression in untreated cells were made using the calculation %rpS6 dephosphorylation = 100 - 100X (MFI with agent–baseline MFI)/(untreated MFI–baseline MFI), where MFI = mean fluorescence intensity.
Dynamic BH3 profiling
Cells were incubated at 5x10⁵/ml in culture medium for four hours with the indicated drugs. Cytochrome c release (using Alexa-647-conjugated cytochrome c antibody, Becton Dickinson #558709) was measured after a further 60 minute incubation of digitonin-permeabilised cells with PUMA-BH3 peptide as described.[22,24] In preliminary assays, the PUMA-BH3 was optimised to 3μM in all cells except M-091, as this was the concentration of the peptide found to be sufficient to induce mitochondrial outer membrane permeabilisation in drug-primed cells, but not so high that it induced a high degree of mitochondrial outer membrane permea-bilisation without drugs. In M-091, the peptide was used at 0.5μM. Adjustments for peptide-induced cytochrome c release in untreated cells were made in order to establish agent-specific release, using the formula 100X (percent cytochrome c positive with peptide–percent cyto-chrome c positive with drug plus peptide)/(percent cytocyto-chrome c positive with peptide). A mutated PUMA-BH3 peptide (PUMA2A) [22] at 100μM and BIM-BH3 peptide (10μM) were used as controls in all experiments. Data were collected on a FACSCanto II flow cytometer (Becton Dickinson) and analysed with FACS Diva software (Becton Dickinson).
Western blot analysis
MV4-11 cells were treated for four hours with 1μM etoposide, 10 nM AC220 or 1μM torin1. Cell lysates were prepared, separated by sodium dodecyl sulfate polyacrylamide gel electropho-resis, and transferred to nitrocellulose membranes. Detection antibodies included anti- -Actin (N-21, sc-130656), anti-MCL1 (S-19, sc-819) and anti-Bcl-2 (C-2, sc-7382) from Santa Cruz Biotechnology, Santa Cruz, CA, USA, anti-BID (#2002, Cell Signalling Technology, Leiden, Netherlands), anti-BIM (Y36, ab32158), anti-BAD (phospho S136, ab28824) and anti-PUMA (EP512Y, ab33906) from Abcam, Cambridge, UK.
Calculations and statistics
Statistical analysis was carried out using the Statistical Package for Social Sciences, version 23 (SPSS, Chicago, IL, USA). P values of0.05 were considered to represent significance. Area under curve (AUC) receiver-operating characteristic (ROC) predictive analysis was used to evaluate the relationship between sensitivity of cell lines to an agent and rpS6 phosphorylation or cytochrome c release.[25]
Results
Multiple signalling pathways converge on rpS6 phosphorylation
Fig 1. RpS6 dephosphorylation by signalling inhibitors. (A)MV4-11 cells were cultured for 4 hours with 1μM torin1, 5μM U0126, 30μM LY294002, 30μM C2-ceramide or a combination of all 4 inhibitors.(B)Values are a percent of untreated cell phospo-rpS6 as described in the methods. (Mean+/- SD for n = 3–5). The phosphatase inhibitor Calyculin A (3 nM) was used as positive control.
cytotoxic drug-activated signalling lipid ceramide [26–28] was also inhibitory. In contrast, the phosphatase inhibitor calyculin A enhanced S6 phosphorylation.
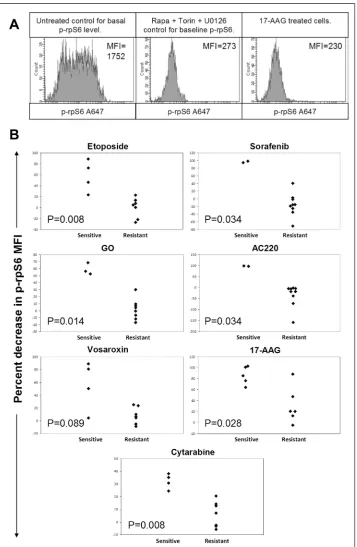
RpS6 dephosphorylation at 4 hours predicts 48 hour drug sensitivity
Data fromFig 1suggests early changes in rpS6 phosphorylation may be used as a predictor of chemotherapeutic response in AML cells. To test this hypothesis, 11 AML cell lines were subjected to 48 hour dose response assays with the following agents: FLT3 inhibitors (AC220 and sorafenib),[29,30] DNA double strand break (DSB) inducers (etoposide, GO and vosaroxin),[31–33] the standard-of-care drug cytarabine and the hsp90 inhibitor 17-AAG.[34]
Using ROC analysis (predictive accuracy test), rpS6 dephosphorylation at 4 hours pre-dicted the 48 hour response to the DSB inducing drugs etoposide and GO, the FLT3 inhibi-tors sorafenib and ACC220 as well as to cytarabine (Fig 2andS1 Table). ROC analysis of 4 hour rpS6 dephosphorylation compared to 48 hour drug sensitivity confirmed that the assay was highly sensitive and specific with AUC values of 1.0 for etoposide, GO, sorafenib, AC220 and cytarabine (S1 Figshows individual ROC curves). An AUC value close to 1 indi-cates excellent predictive capabilities providing evidence that this laboratory test performed after 4 hours does have an ability to predict chemosensitivity at 48 hours. For vosaroxin, the AUC value was 0.82. HL-60 cells, which were sensitive to vosaroxin at 48 hours, did not dephosphorylate rpS6.
17-AAG, which had been included because of clinical interest in novel hsp90 inhibitors, [35] was expected to be particularly effective because hsp90 plays a direct role in maintatining the stability of rpS6.[36] The predictive value for 17-AAG (AUC 0.9) was statistically signifi-cant, albeit with U937 cells showing confoundingly high dephosphorylation.
PUMA-BH3 peptide-induced cytochrome c release after 4 hours drug
treatment predicts 48 hour drug sensitivity
Dynamic BH3 profiling involves exposing mitochondria to BH3 domain derived peptides fol-lowing short term drug exposure to prime mitochondria for changes in MOMP as measured by cytochrome c release. It has been demonstrated that this technique can predict cytotoxicity. [21] PUMA-BH3 peptide can sensitise all the anti-apoptotic BCL-2 family of proteins [37] and was used for our assay. To obtain optimal sensitivity with this technique it is important to establish suitable drug and peptide concentrations so that agent or peptides do not overwhelm the system by inducing too much cytochrome c release individually. As the technique demands outer membrane permeabilisation whilst maintaining mitochondrial integrity, we set up appropriate assay controls and defined their interpretation as>90% induced cytochrome c
release in the presence of a high concentration (10μM) of the activator peptide BIM-BH3 but less than 10% when incubated with the non-specific peptide PUMA2A-BH3. PUMA-BH3 pep-tide-induced cytochrome c release closely predicted the 48 hour IC50for DSB inducing drugs
and FLT3 inhibitors, with AUC values of 1.0 for etoposide, GO, AC220 and sorafenib (Fig 3 andS1 Table). For vosaroxin, the AUC value was 0.95. As with the rpS6 assay, HL-60 cells, which were sensitive to vosaroxin at 48 hours, were insensitive in the short-term assay. BH3 profiling was not predictive for responses to 17-AAG, (AUC value 0.63), or cytarabine (AUC value 0.77). SeeS2 Figfor individual ROC curves.
Fig 2. RpS6 dephosphorylation at 4 hours predicts 48 hour drug sensitivity. (A)MOLM-13 cells were cultured for 4 hours with 100 nM Rapamycin, 1μM torin1 and 3μM U0126 to determine p-rpS6 baseline. RpS6 dephosphorylation after 4 hours culture with 500 nM 17-AAG is also shown. Example histograms are representative of 3 individual experiments.(B)Based on the 48 hour IC50values a drug sensitive/resistant cut off for cell lines was determined. Cell lines were cultured for 4 hours with 1μM etoposide, 50nM sorafenib, 600ng/ml GO, 10nM AC220, 1μM vosaroxin, 500nM 17-AAG and 2μM cytarabine. Values are a percent of untreated cell p-rpS6 as described in the methods. Each point represents a cell line and is the product of three individual experiments.
Changes in expression of apoptotic modulator proteins after four hours
drug exposure
For apoptosis to occur, the effector molecules BAK and BAX oligomerise and form pores that cause MOMP, resulting in cytochrome c release. Effector molecule activation can be triggered by the BH3-only proapoptotic BCL-2 family members BIM, BID and PUMA. Prosurvival members such as MCL-1, BCL-2 and BCL-XLinhibit the BH3-only proteins by sequestration
and hold apoptosis in check. Our dynamic BH3 profiling results clearly demonstrate that drugs are priming cells to PUMA-BH3 peptide after only 4 hours exposure. We investigated what effect the drugs were having on BCL-2 apoptotic protein family members during this time period that might underpin this rapid priming. MV4-11 cells were used as these cells were the most sensitive cell line to the majority of drugs in our panel (S1 Table). These cells do not over-express the anti-apoptotic protein BCL-XL.[24] Of the other BCL-2 family
prosurvi-val members MCL-1 has the shorter half-life (approximately 1 hour) and can be rapidly
Fig 3. PUMA-BH3 peptide-induced cytochrome c release after 4 hours drug treatment predicts 48 hour drug sensitivity. (A)MOLM-13 cells were cultured for 4 hours with 1μM vosaroxin or 50 nM sorafenib followed by 1 hour treatment with PUMA-BH3 peptide or PUMA2A control. Example dot plots are representative of 3 individual experiments.(B)Based on the 48 hour IC50values a drug sensitive/resistant cut off for cell lines was determined as described in the methods. Cell lines were cultured for 4 hours with 1μM etoposide, 50nM sorafenib, 600ng/ml GO, 10nM AC220, 1μM vosaroxin, 500nM 17-AAG or 2μM cytarabine followed by 1 hour incubation with PUMA-BH3 peptide. Values are corrected for cytochrome c release with PUMA2A control peptide as described in the methods. Each point represents a cell line and is the product of three individual experiments.
[image:10.612.158.575.372.628.2]https://doi.org/10.1371/journal.pone.0196805.g003
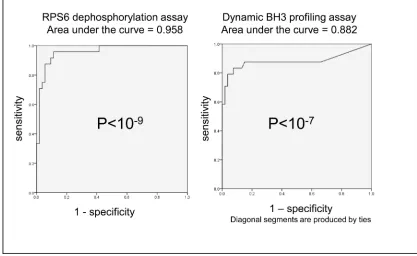
Fig 4. ROC curve analysis confirms highly significant overall sensitivity and specificity for the ability of both rpS6
dephosphorylation and PUMA-BH3 induced cytochrome C release after 4 hours drug treatment to predict 48 hour sensitivity to drugs.Summary ROC curves for percent change in rpS6 phosphorylation and PUMA induced cytochrome c release after 4 hours treatment with 1μM etoposide, 50nM sorafenib, 600ng/ml GO, 10nM AC220, 1μM vosaroxin, 500nM 17-AAG or 2μM cytarabine in 11 AML cells lines. Cell lines were classified as sensitive or resistant according to 48 hours drug response (The standardised definition of sensitivity is described in the methods section). Each data point used to generate the analysis is the mean of three individual experiments.
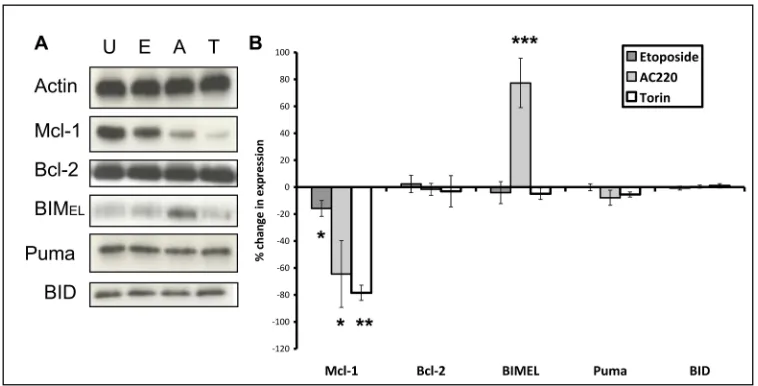
downregulated [38] whilst BCL-2 is a much more stable protein.[37,39] We used etoposide and AC220, as DSB-inducing agents and FLT3 inhibitors are of particular clinical interest in AML: both rpS6 dephosphorylation and dynamic BH3 profiling had been able to predict response to these drugs (S1 Table). We found that etoposide and AC220 significantly deplete MCL-1 in the MV4.11 cells without affecting the expression of BCL-2 (Fig 5). The mTORC1 antagonist and translation inhibitor torin1 [40] was included as a control because inhibition of translation depletes MCL-1.[41] Activation of effector molecules BAK and BAX using confor-mation-specific antibodies as previously described [24] was not observed (data not shown). Of the activator BCL-2 family members BID, BIM and PUMA, BIM expression was significantly increased after 4 hours treatment with AC220 only whilst BID and PUMA were unaffected by either etoposide or AC220 (Fig 5). SeeS3 Figfor uncropped blots.
Discussion
This work is a first step towards ascertaining whether short term functional predictive assays might have clinical application in AML. A history of failure for chemosensitivity assays in clin-ical practice [3] has been discouraging, but the need for the development of such assays is still being strongly asserted,[4,42,43] with the rationale that molecular assays in unstimulated cells cannot recapitulate complex behaviour.
We have demonstrated the potential of two same-day functional flow cytometric assays to predict 48-hour response to chemotherapy in AML cell lines. FLT3 inhibitors are documented to induce rapid changes in signalling pathways [44–46] and we have shown here that rpS6 dephosphorylation is a suitable indicator of this activity. Early (i.e. less than four hours) pro-apoptotic changes invoked by DNA damaging drugs are rarely documented. However, in an exception to the general focus on late changes, Nijhawan and colleagues documented the early loss of MCL-1 after genotoxic stress, and they included etoposide in their analysis.[47] The rapidity of ceramide induction following DNA damage [26,27] and the involvement of cer-amide in phosphatase activation[48] also encouraged us to postulate that we might be able to document responses to DNA-damaging agents after four hours. The cell lines were appropri-ately classified as sensitive or resistant to etoposide and GO. Vosaroxin sensitivity was also pre-dicted by both assays in 10/11 cell lines.
The main obstacle for further development of this work in clinical samples is that primary samples are unstable over timein vitro[5] and therefore cannot be used for proof of principle.
into account apoptosis resistance that might occur separately from or downstream of pRS6 inhibition.
Perturbations of signalling pathways can induce drug resistance mechanisms,[51,52] but the finding that rpS6 dephosphorylation at 4 hours was predictive of cell death at 48 hours implies early, irreversible changes. In the final part of the study we probed for early drug-induced changes in BCL-2 family proteins that might indicate commitment to apoptosis. Apo-ptosis is effected by oligomerisation of BAX and BAK and activated by BCL-2 family members such as BIM, BID and PUMA.[19] The only change we noted in these pro-apoptotic molecules was induction of BIM by AC220 in sensitive MV4-11 cells (Fig 5). We found significant early inhibition of MCL-1 by AC220 in these cells (Fig 5). This might be predicated on early down-regulation of STAT5 signalling: [53] activation of this pathway is documented to maintain MCL-1 expression.[54] However, MCL-1 was only 20% decreased in etoposide-treated cells. Given that elimination of MCL1 is reported to be required for the initiation of apoptosis fol-lowing double strand breaks[47] the delineation of early irreversible pre-apoptotic changes will likely require attention to post-translational changes and binding partners as well as expression levels of MCL-1. MCL-1 is sequentially translocated to mitochondria, phosphory-lated and ubiquitinyphosphory-lated prior to degradation.[55] A possible explanation for the clear-cut predictive value of the assays in the face of resistance mechanisms is the homogeneity of cell lines. A future application of the system might be to elucidate whether sensitive and resistant subsets within patient samples can be defined.
In summary we have described two assays which detect changes occurring in sensitive cells within four hours of drug application and which predict sensitivity and resistance to DNA damaging agents and FLT3 inhibitors in a panel of AML cell lines.
Supporting information
[image:12.612.199.578.76.269.2]S1 Table. Cell line IC50, rpS6 and cytochrome C data.11 cell lines were treated with 7 differ-ent drugs or untreated controls for 48 hours to determine an IC50 (nM) (shown in bold;
Fig 5. Changes in expression of apoptotic modulator proteins after four hours drug exposure. (A)MV4-11 cells were treated for four hours with 1μM etoposide (E), 10 nM AC220 (A) or 1μM torin1 (T). Each blot represents one of three independent experiments.(B)Blots were subjected to densitometry analysis using Image Studio Lite software (version 5.2). Values shown are percent change in expression normalised to loading control (p =<0.05/ p = 0.002/ p = 0.02), analyzed using paired samples t-test, +95% confidence interval. Columns, mean of three experiments; bars, SD.
supscript R = resistant, superscript S = sensitive). Percent rpS6 dephosphorylation (regular font) and percent PUMA induced cytochrome C release (bold italic) was determined in the same cell lines after 4 hours drug treatment. Each value is the product of three individual experiments.
(TIF)
S1 Fig. Individual ROC curves for rpS6 dephosphorylation after 4 hours drug treatment.
ROC curves for percent change in rpS6 phosphorylation after 4 hours treatment with 1μM etoposide, 50nM sorafenib, 600ng/ml GO, 10nM AC220, 1μM vosaroxin, 500nM 17-AAG or 2μM cytarabine in 11 AML cells lines. Each data point used to generate the analysis is the mean of three individual experiments.
(TIF)
S2 Fig. Individual ROC curves for PUMA induced cytochrome c release after 4 hours drug treatment.ROC curves for PUMA induced cytochrome c release after 4 hours treatment with 1μM etoposide, 50nM sorafenib, 600ng/ml GO, 10nM AC220, 1μM vosaroxin, 500nM 17-AAG or 2μM cytarabine in 11 AML cells lines. Each data point used to generate the analy-sis is the mean of three individual experiments.
(TIF)
S3 Fig. Original uncropped western blots.MV4-11 cells were treated for four hours with 1μM etoposide, 10 nM AC220 or 1μM torin1 before probing for the apoptotic modulator pro-teins Mcl-1, Bcl-2, BIM, PUMA and BID.
(TIF)
Author Contributions
Conceptualization:Monica Pallis.
Data curation:Martin Grundy, Thomas Jones, Liban Elmi, Michael Hall, Adam Graham, Monica Pallis.
Formal analysis:Martin Grundy.
Funding acquisition:Martin Grundy, Nigel Russell.
Investigation:Martin Grundy, Thomas Jones, Liban Elmi, Michael Hall, Adam Graham, Monica Pallis.
Methodology:Martin Grundy, Thomas Jones, Monica Pallis.
Project administration:Monica Pallis.
Supervision:Martin Grundy, Nigel Russell, Monica Pallis.
Writing – original draft:Martin Grundy, Monica Pallis.
Writing – review & editing:Martin Grundy, Thomas Jones, Liban Elmi, Michael Hall, Adam Graham, Monica Pallis.
References
1. Estey E. Acute myeloid leukemia: 2016 Update on risk-stratification and management. American journal of hematology. 2016; 91(8):824–46. Epub 2016/07/16.https://doi.org/10.1002/ajh.24439PMID: 27417880.
3. Burstein HJ, Mangu PB, Somerfield MR, Schrag D, Samson D, Holt L, et al. American Society of Clinical Oncology clinical practice guideline update on the use of chemotherapy sensitivity and resistance assays. Journal of clinical oncology : official journal of the American Society of Clinical Oncology. 2011; 29(24):3328–30. Epub 2011/07/27.https://doi.org/10.1200/jco.2011.36.0354PMID:21788567.
4. Friedman AA, Letai A, Fisher DE, Flaherty KT. Precision medicine for cancer with next-generation func-tional diagnostics. Nature reviews Cancer. 2015; 15(12):747–56. Epub 2015/11/06.https://doi.org/10. 1038/nrc4015PMID:26536825; PubMed Central PMCID: PMCPMC4970460.
5. Pallis M, Turzanski J, Grundy M, Seedhouse C, Russell N. Resistance to spontaneous apoptosis in acute myeloid leukaemia blasts is associated with p-glycoprotein expression and function, but not with the presence of FLT3 internal tandem duplications. British journal of haematology. 2003; 120(6):1009– 16. Epub 2003/03/22. PMID:12648071.
6. Holz MK, Blenis J. Identification of S6 kinase 1 as a novel mammalian target of rapamycin (mTOR)-phosphorylating kinase. The Journal of biological chemistry. 2005; 280(28):26089–93. Epub 2005/05/ 21.https://doi.org/10.1074/jbc.M504045200PMID:15905173.
7. Ma L, Chen Z, Erdjument-Bromage H, Tempst P, Pandolfi PP. Phosphorylation and functional inactiva-tion of TSC2 by Erk implicainactiva-tions for tuberous sclerosis and cancer pathogenesis. Cell. 2005; 121 (2):179–93. Epub 2005/04/27.https://doi.org/10.1016/j.cell.2005.02.031PMID:15851026.
8. Roux PP, Shahbazian D, Vu H, Holz MK, Cohen MS, Taunton J, et al. RAS/ERK signaling promotes site-specific ribosomal protein S6 phosphorylation via RSK and stimulates cap-dependent translation. The Journal of biological chemistry. 2007; 282(19):14056–64. Epub 2007/03/16.https://doi.org/10. 1074/jbc.M700906200PMID:17360704; PubMed Central PMCID: PMCPMC3618456.
9. Cam M, Bid HK, Xiao L, Zambetti GP, Houghton PJ, Cam H. p53/TAp63 and AKT regulate mammalian target of rapamycin complex 1 (mTORC1) signaling through two independent parallel pathways in the presence of DNA damage. The Journal of biological chemistry. 2014; 289(7):4083–94. Epub 2013/12/ 25.https://doi.org/10.1074/jbc.M113.530303PMID:24366874; PubMed Central PMCID:
PMCPMC3924274.
10. Li Y, Mitsuhashi S, Ikejo M, Miura N, Kawamura T, Hamakubo T, et al. Relationship between ATM and ribosomal protein S6 revealed by the chemical inhibition of Ser/Thr protein phosphatase type 1. Biosci-ence, biotechnology, and biochemistry. 2012; 76(3):486–94. Epub 2012/03/28.https://doi.org/10.1271/ bbb.110774PMID:22451389.
11. Bandi HR, Ferrari S, Krieg J, Meyer HE, Thomas G. Identification of 40 S ribosomal protein S6 phos-phorylation sites in Swiss mouse 3T3 fibroblasts stimulated with serum. The Journal of biological chem-istry. 1993; 268(6):4530–3. Epub 1993/02/25. PMID:8440735.
12. Fransecky L, Mochmann LH, Baldus CD. Outlook on PI3K/AKT/mTOR inhibition in acute leukemia. Molecular and cellular therapies. 2015; 3:2. Epub 2015/06/10. https://doi.org/10.1186/s40591-015-0040-8PMID:26056603; PubMed Central PMCID: PMCPMC4452048.
13. Milella M, Kornblau SM, Estrov Z, Carter BZ, Lapillonne H, Harris D, et al. Therapeutic targeting of the MEK/MAPK signal transduction module in acute myeloid leukemia. The Journal of clinical investigation. 2001; 108(6):851–9. Epub 2001/09/19.https://doi.org/10.1172/JCI12807PMID:11560954; PubMed Central PMCID: PMCPMC200930.
14. Pallis M, Harvey T, Russell N. Phenotypically Dormant and Immature Leukaemia Cells Display Increased Ribosomal Protein S6 Phosphorylation. PloS one. 2016; 11(3):e0151480. Epub 2016/03/18. https://doi.org/10.1371/journal.pone.0151480PMID:26985829; PubMed Central PMCID:
PMCPMC4795744.
15. Chow S, Minden MD, Hedley DW. Constitutive phosphorylation of the S6 ribosomal protein via mTOR and ERK signaling in the peripheral blasts of acute leukemia patients. Experimental hematology. 2006; 34(9):1183–91. Epub 2006/08/31.https://doi.org/10.1016/j.exphem.2006.05.002PMID:16939811.
16. Gunawardane RN, Nepomuceno RR, Rooks AM, Hunt JP, Ricono JM, Belli B, et al. Transient exposure to quizartinib mediates sustained inhibition of FLT3 signaling while specifically inducing apoptosis in FLT3-activated leukemia cells. Molecular cancer therapeutics. 2013; 12(4):438–47. Epub 2013/02/16. https://doi.org/10.1158/1535-7163.MCT-12-0305PMID:23412931.
17. Dieterlen MT, Bittner HB, Klein S, von Salisch S, Mittag A, Tarnok A, et al. Assay validation of phosphor-ylated S6 ribosomal protein for a pharmacodynamic monitoring of mTOR-inhibitors in peripheral human blood. Cytometry Part B, Clinical cytometry. 2012; 82(3):151–7. Epub 2012/01/04.https://doi.org/10. 1002/cyto.b.21005PMID:22213594.
19. Czabotar PE, Lessene G, Strasser A, Adams JM. Control of apoptosis by the BCL-2 protein family: implications for physiology and therapy. Nature reviews Molecular cell biology. 2014; 15(1):49–63. Epub 2013/12/21.https://doi.org/10.1038/nrm3722PMID:24355989.
20. Chipuk JE, Green DR. How do BCL-2 proteins induce mitochondrial outer membrane permeabilization? Trends in cell biology. 2008; 18(4):157–64. Epub 2008/03/04.https://doi.org/10.1016/j.tcb.2008.01.007 PMID:18314333; PubMed Central PMCID: PMCPMC3242477.
21. Montero J, Sarosiek KA, DeAngelo JD, Maertens O, Ryan J, Ercan D, et al. Drug-induced death signal-ing strategy rapidly predicts cancer response to chemotherapy. Cell. 2015; 160(5):977–89. Epub 2015/ 02/28.https://doi.org/10.1016/j.cell.2015.01.042PMID:25723171; PubMed Central PMCID:
PMCPMC4391197.
22. Ryan J, Letai A. BH3 profiling in whole cells by fluorimeter or FACS. Methods (San Diego, Calif). 2013; 61(2):156–64. Epub 2013/04/24.https://doi.org/10.1016/j.ymeth.2013.04.006PMID:23607990; PubMed Central PMCID: PMCPMC3686919.
23. Grundy M, Seedhouse C, Russell NH, Pallis M. P-glycoprotein and breast cancer resistance protein in acute myeloid leukaemia cells treated with the aurora-B kinase inhibitor barasertib-hQPA. BMC cancer. 2011; 11:254. Epub 2011/06/18.https://doi.org/10.1186/1471-2407-11-254PMID:21679421; PubMed Central PMCID: PMCPMC3146447.
24. Pallis M, Burrows F, Ryan J, Grundy M, Seedhouse C, Abdul-Aziz A, et al. Complementary dynamic BH3 profiles predict co-operativity between the multi-kinase inhibitor TG02 and the BH3 mimetic ABT-199 in acute myeloid leukaemia cells. Oncotarget. 2017; 8(10):16220–32. Epub 2016/04/20.https://doi. org/10.18632/oncotarget.8742PMID:27092880; PubMed Central PMCID: PMCPMC5369958.
25. Zweig MH, Campbell G. Receiver-operating characteristic (ROC) plots: a fundamental evaluation tool in clinical medicine. Clinical chemistry. 1993; 39(4):561–77. Epub 1993/04/01. PMID:8472349.
26. Perry DK, Carton J, Shah AK, Meredith F, Uhlinger DJ, Hannun YA. Serine palmitoyltransferase regu-lates de novo ceramide generation during etoposide-induced apoptosis. The Journal of biological chem-istry. 2000; 275(12):9078–84. Epub 2000/03/18. PMID:10722759.
27. Sawada M, Nakashima S, Banno Y, Yamakawa H, Hayashi K, Takenaka K, et al. Ordering of ceramide formation, caspase activation, and Bax/Bcl-2 expression during etoposide-induced apoptosis in C6 gli-oma cells. Cell death and differentiation. 2000; 7(9):761–72. Epub 2000/10/24.https://doi.org/10.1038/ sj.cdd.4400711PMID:11042671.
28. Tepper AD, de Vries E, van Blitterswijk WJ, Borst J. Ordering of ceramide formation, caspase activa-tion, and mitochondrial changes during CD95- and DNA damage-induced apoptosis. The Journal of clinical investigation. 1999; 103(7):971–8. Epub 1999/04/09.https://doi.org/10.1172/JCI5457PMID: 10194469; PubMed Central PMCID: PMCPMC408258.
29. Lyons JF, Wilhelm S, Hibner B, Bollag G. Discovery of a novel Raf kinase inhibitor. Endocrine-related cancer. 2001; 8(3):219–25. Epub 2001/09/22. PMID:11566613.
30. Zarrinkar PP, Gunawardane RN, Cramer MD, Gardner MF, Brigham D, Belli B, et al. AC220 is a uniquely potent and selective inhibitor of FLT3 for the treatment of acute myeloid leukemia (AML). Blood. 2009; 114(14):2984–92. Epub 2009/08/06.https://doi.org/10.1182/blood-2009-05-222034 PMID:19654408; PubMed Central PMCID: PMCPMC2756206.
31. Hawtin RE, Stockett DE, Wong OK, Lundin C, Helleday T, Fox JA. Homologous recombination repair is essential for repair of vosaroxin-induced DNA double-strand breaks. Oncotarget. 2010; 1(7):606–19. Epub 2011/02/15.https://doi.org/10.18632/oncotarget.101106PMID:21317456; PubMed Central PMCID: PMCPMC3248135.
32. Vock EH, Lutz WK, Hormes P, Hoffmann HD, Vamvakas S. Discrimination between genotoxicity and cytotoxicity in the induction of DNA double-strand breaks in cells treated with etoposide, melphalan, cis-platin, potassium cyanide, Triton X-100, and gamma-irradiation. Mutation research. 1998; 413(1):83– 94. Epub 1998/05/29. PMID:9602861.
33. Yamauchi T, Matsuda Y, Tasaki T, Negoro E, Ikegaya S, Takagi K, et al. Induction of DNA strand breaks is critical to predict the cytotoxicity of gemtuzumab ozogamicin against leukemic cells. Cancer science. 2012; 103(9):1722–9. Epub 2012/05/29.https://doi.org/10.1111/j.1349-7006.2012.02343.x PMID:22632031.
34. Kelland LR, Sharp SY, Rogers PM, Myers TG, Workman P. DT-Diaphorase expression and tumor cell sensitivity to 17-allylamino, 17-demethoxygeldanamycin, an inhibitor of heat shock protein 90. Journal of the National Cancer Institute. 1999; 91(22):1940–9. Epub 1999/11/24. PMID:10564678.
35. Shrestha L, Bolaender A, Patel HJ, Taldone T. Heat Shock Protein (HSP) Drug Discovery and Develop-ment: Targeting Heat Shock Proteins in Disease. Current topics in medicinal chemistry. 2016; 16 (25):2753–64. Epub 2016/04/14. PMID:27072696; PubMed Central PMCID: PMCPMC4995156.
(2):824–33. Epub 2005/11/30.https://doi.org/10.1091/mbc.E05-08-0713PMID:16314389; PubMed Central PMCID: PMCPMC1356592.
37. Rooswinkel RW, van de Kooij B, de Vries E, Paauwe M, Braster R, Verheij M, et al. Antiapoptotic potency of Bcl-2 proteins primarily relies on their stability, not binding selectivity. Blood. 2014; 123 (18):2806–15. Epub 2014/03/14.https://doi.org/10.1182/blood-2013-08-519470PMID:24622325.
38. Yang T, Kozopas KM, Craig RW. The intracellular distribution and pattern of expression of Mcl-1 over-lap with, but are not identical to, those of Bcl-2. The Journal of cell biology. 1995; 128(6):1173–84. Epub 1995/03/01. PMID:7896880; PubMed Central PMCID: PMCPMC2120408.
39. Kitada S, Miyashita T, Tanaka S, Reed JC. Investigations of antisense oligonucleotides targeted against bcl-2 RNAs. Antisense research and development. 1993; 3(2):157–69. Epub 1993/01/01. PMID:8400801.
40. Thoreen CC, Kang SA, Chang JW, Liu Q, Zhang J, Gao Y, et al. An ATP-competitive mammalian target of rapamycin inhibitor reveals rapamycin-resistant functions of mTORC1. The Journal of biological chemistry. 2009; 284(12):8023–32. Epub 2009/01/20.https://doi.org/10.1074/jbc.M900301200PMID: 19150980; PubMed Central PMCID: PMCPMC2658096.
41. Adams KW, Cooper GM. Rapid turnover of mcl-1 couples translation to cell survival and apoptosis. The Journal of biological chemistry. 2007; 282(9):6192–200. Epub 2007/01/04.https://doi.org/10.1074/jbc. M610643200PMID:17200126; PubMed Central PMCID: PMCPMC1831535.
42. Montero J, Letai A. Dynamic BH3 profiling-poking cancer cells with a stick. Molecular & cellular oncol-ogy. 2016; 3(3):e1040144. Epub 2016/06/18.https://doi.org/10.1080/23723556.2015.1040144PMID: 27314085; PubMed Central PMCID: PMCPMC4909438.
43. Yaffe MB. The scientific drunk and the lamppost: massive sequencing efforts in cancer discovery and treatment. Science signaling. 2013; 6(269):pe13. Epub 2013/04/04.https://doi.org/10.1126/scisignal. 2003684PMID:23550209.
44. Levis M, Tse KF, Smith BD, Garrett E, Small D. A FLT3 tyrosine kinase inhibitor is selectively cytotoxic to acute myeloid leukemia blasts harboring FLT3 internal tandem duplication mutations. Blood. 2001; 98(3):885–7. Epub 2001/07/27. PMID:11468194.
45. Spiekermann K, Bagrintseva K, Schwab R, Schmieja K, Hiddemann W. Overexpression and constitu-tive activation of FLT3 induces STAT5 activation in primary acute myeloid leukemia blast cells. Clinical cancer research : an official journal of the American Association for Cancer Research. 2003; 9(6):2140– 50. Epub 2003/06/11. PMID:12796379.
46. Grundy M, Seedhouse C, Shang S, Richardson J, Russell N, Pallis M. The FLT3 internal tandem dupli-cation mutation is a secondary target of the aurora B kinase inhibitor AZD1152-HQPA in acute myeloge-nous leukemia cells. Molecular cancer therapeutics. 2010; 9(3):661–72. Epub 2010/02/18.https://doi. org/10.1158/1535-7163.MCT-09-1144PMID:20159992.
47. Nijhawan D, Fang M, Traer E, Zhong Q, Gao W, Du F, et al. Elimination of Mcl-1 is required for the initia-tion of apoptosis following ultraviolet irradiainitia-tion. Genes & development. 2003; 17(12):1475–86. Epub 2003/06/05.https://doi.org/10.1101/gad.1093903PMID:12783855; PubMed Central PMCID: PMCPMC196078.
48. Oaks J, Ogretmen B. Regulation of PP2A by Sphingolipid Metabolism and Signaling. Frontiers in oncol-ogy. 2014; 4:388. Epub 2015/02/03.https://doi.org/10.3389/fonc.2014.00388PMID:25642418; PubMed Central PMCID: PMCPMC4295541.
49. Pan R, Hogdal LJ, Benito JM, Bucci D, Han L, Borthakur G, et al. Selective BCL-2 inhibition by ABT-199 causes on-target cell death in acute myeloid leukemia. Cancer discovery. 2014; 4(3):362–75. Epub 2013/12/19.https://doi.org/10.1158/2159-8290.CD-13-0609PMID:24346116; PubMed Central PMCID: PMCPMC3975047.
50. Vo TT, Ryan J, Carrasco R, Neuberg D, Rossi DJ, Stone RM, et al. Relative mitochondrial priming of myeloblasts and normal HSCs determines chemotherapeutic success in AML. Cell. 2012; 151(2):344– 55. Epub 2012/10/16.https://doi.org/10.1016/j.cell.2012.08.038PMID:23063124; PubMed Central PMCID: PMCPMC3534747.
51. Lito P, Rosen N, Solit DB. Tumor adaptation and resistance to RAF inhibitors. Nature medicine. 2013; 19(11):1401–9. Epub 2013/11/10.https://doi.org/10.1038/nm.3392PMID:24202393.
52. Bruner JK, Ma HS, Li L, Qin ACR, Rudek MA, Jones RJ, et al. Adaptation to TKI Treatment Reactivates ERK Signaling in Tyrosine Kinase-Driven Leukemias and Other Malignancies. Cancer research. 2017; 77(20):5554–63. Epub 2017/09/20.https://doi.org/10.1158/0008-5472.CAN-16-2593PMID:28923853.
54. Nogami A, Oshikawa G, Okada K, Fukutake S, Umezawa Y, Nagao T, et al. FLT3-ITD confers resis-tance to the PI3K/Akt pathway inhibitors by protecting the mTOR/4EBP1/Mcl-1 pathway through STAT5 activation in acute myeloid leukemia. Oncotarget. 2015; 6(11):9189–205. Epub 2015/04/01. https://doi.org/10.18632/oncotarget.3279PMID:25826077; PubMed Central PMCID:
PMCPMC4496211.