DOI: 10.1534/genetics.107.070631
Population Structure and Its Effects on Patterns of Nucleotide
Polymorphism in Teosinte (Zea mays
ssp.
parviglumis)
David A. Moeller,*
,1Maud I. Tenaillon
†and Peter Tiffin*
,2*Department of Plant Biology, University of Minnesota, St. Paul, Minnesota 55108 and†UMR de Ge´ne´tique Ve´ge´tale, CNRS-INRA-UPS-INA PG, 91190 Gif-sur-Yvette, France
Manuscript received January 7, 2007 Accepted for publication April 19, 2007
ABSTRACT
Surveys of nucleotide diversity in the wild ancestor of maize,Zea maysssp. parviglumis, have revealed genomewide departures from the standard neutral equilibrium (NE) model. Here we investigate the degree to which population structure may account for the excess of rare polymorphisms frequently ob-served in species-wide samples. On the basis of sequence data from five nuclear and two chloroplast loci, we found significant population genetic structure among seven subpopulations from two geographic regions. Comparisons of estimates of population genetic parameters from species-wide samples and subpopulation-specific samples showed that population genetic subdivision influenced observed pat-terns of nucleotide polymorphism. In particular, Tajima’sDwas significantly higher (closer to zero) in subpopulation-specific samples relative to species-wide samples, and therefore more closely corresponded to NE expectations. In spite of these overall patterns, the extent to which levels and patterns of polymor-phism within subpopulations differed from species-wide samples and NE expectations depended strongly on the geographic region ( Jaliscovs. Balsas) from which subpopulations were sampled. This may be due to the demographic history of subpopulations in those regions. Overall, these results suggest that explicitly accounting for population structure may be important for studies examining the genetic basis of ecologi-cally and agronomiecologi-cally important traits as well as for identifying loci that have been the targets of selection.
M
OLECULAR population genetic approaches have been used increasingly to identify genes that have experienced adaptive evolution (e.g., Ford2002; Wrightet al. 2005; Voightet al. 2006). In a few model systems (e.g., Drosophila, humans, Arabidopsis, and maize), putative targets of selection have been identi-fied as loci with extreme values of population genetic parameters relative to distributions of these statistics derived from a large number of loci (e.g., Parschet al. 2001; Yamasakiet al. 2005; Toomajianet al. 2006). This approach does not require researchers to assume an explicit model of a population’s demographic history. An alternative approach for identifying genes that have been subject to selection is to use likelihood to evalu-ate the fit of data to models that include specific de-mographic histories (e.g., Wallet al. 2002; Tenaillonet al. 2004; Wrightet al. 2005). For most studies and for most study species, however, inferences of non-neutral evolution have been made by comparing the properties
of a sample of DNA sequences to that expected under the standard neutral equilibrium (NE) model.
Because many species have complex demographic histories, central assumptions of the NE model—random mating and constant population size—are likely violated, leading to potentially unreliable inferences of non-neutral evolution (Andolfattoand Przeworski2000; Akeyet al. 2002) even when empirically derived distri-butions of statistics have been employed (Teshimaet al. 2006). Violations of NE assumptions appear to be par-ticularly common in plant species due to population subdivision, metapopulation dynamics, and shifts in pat-terns of geographic distribution (Innan and Stephan 2000; Wrightet al. 2003; Nordborget al. 2005; Schmid
et al. 2005). Nevertheless, the effects of population subdivision on patterns of intraspecific nucleotide di-versity remain unclear because most surveys of nucleo-tide diversity in plant species have used species-wide samples, in which one or a few individuals are selected from multiple geographically isolated populations (hereafter referred to as subpopulations) (reviewed in Wrightand Gaut2004).
Geographically structured subpopulations are ex-pected to diverge as a result of neutral evolutionary processes as long as the effective number of migrants per generation is less than one (Wright1951; Nagylaki 1980; Charlesworth et al. 2003). Theoretical studies
Sequence data from this article have been deposited with the EMBL/ GenBank Data Libraries under accession nos. EF539343–EF539725 and EF541188–EF541347.
1Present address: Department of Genetics, Davison Life Sciences
Complex, University of Georgia, Athens, GA 30602.
2Corresponding author: Department of Plant Biology, University of
Minnesota, 1445 Gortner Ave., St. Paul, MN 55108. E-mail: [email protected]
indicate that population structure can also affect pat-terns of sequence variation. For example, population structure may produce excess linkage disequilibrium (LD) (Liand Nei1974; Ohta1982) and skew the fre-quency spectrum of polymorphism such that there is an excess of rare variants (Tajima 1989). These conse-quences of subdivision can mimic the effects of positive selection and therefore confound inferences about the role of adaptation in shaping nucleotide variation.
Population structure can also affect inferences about the evolutionary history of genes that have been shaped by natural selection (Charlesworthet al. 1997). When subpopulations are locally adapted to different environ-mental conditions, the signature of positive selection on ecologically important genes may differ among subpop-ulations. A sample of sequences taken from across these subpopulations with different evolutionary histories (as in species-wide samples) can produce patterns of nu-cleotide variation consistent with expectations under balancing selection, rather than under the positive selection that drove evolution (Nordborg and Innan 2003).
Sampling individuals from a single geographically distinct subpopulation can be problematic for different reasons. Wakeleyand Aliacar(2001) have shown that the frequency distribution of polymorphism in sam-ples drawn from a single subpopulation can be strongly affected by immigration and population extinction/ recolonization. In particular, immigration from differ-entiated subpopulations and metapopulation dynamics can result in a pattern of diversity similar to that ex-pected following an episode of strong selection in a panmictic stable population (see also Wrightand Gaut 2004). Therefore, accurate inferences about whether and how natural selection has shaped sequence varia-tion depend critically on an understanding of the extent and pattern of population structure.
Zea mays ssp.parviglumis(hereafterparviglumis), the closest wild relative of the domesticate, maize (Zea mays ssp.mays), is an important model for investigating the molecular population genetics of natural plant popula-tions. The close relationship ofparviglumisto maize has allowed for a wealth of sequence, genomic, and func-tional information to be applied to this nondomesticated taxon. parviglumis has also been a focus of attention because knowledge of the genomic diversity in parviglu-mis is needed to identify genes that were targets of artificial selection and to understand the demographic consequences of domestication (Doebley et al. 1997; Wanget al. 1999; Doebley2004; Wrightet al. 2005). Multiple surveys of nucleotide variation inparviglumis (reviewed in Wright and Gaut 2005), including a survey of 774 loci (Wrightet al. 2005), have revealed that the majority of loci have negative values of Tajima’s D, indicative of a genomewide excess of rare variants relative to NE expectations. As with most molecular population genetic studies in plants, these surveys have
relied on species-wide samples drawn from multiple geographically distinct subpopulations. Therefore, pop-ulation structure may be the reason for, or contribute to, the apparent excess of rare polymorphisms. It is also possible that there is little population structure within parviglumisand that the excess of rare variants is due to only recent population size changes.
Assessing the extent of population structure in parviglumisis important both for determining the forces that shape diversity within species and for correctly inferring the effects of domestication on genomic diversity. For example, if diversity inparviglumisis highly structured among subpopulations, sampling individuals from across the species’ range may overestimate diver-sity in the progenitor population ofparviglumis, leading to an overestimate of the strength of the genetic bot-tleneck associated with maize domestication (Hilton and Gaut1998; Tenaillonet al. 2004). Similarly, allele frequencies in species-wide samples may not reflect allele frequencies within subpopulations, complicating the identification of targets of selection through the use of genome scans (Teshimaet al. 2006). These potential problems would be particularly pronounced if maize were domesticated from one or a few genetically distinct subpopulations. The phylogenetic relationships among parviglumis subpopulations have been investigated us-ing microsatellite diversity (Fukunagaet al. 2005), but the effects of population structure on levels and pat-terns of nucleotide diversity inparviglumishave not been previously characterized.
In this study, we analyzed sequence variation within and among seven subpopulations ofparviglumisat five nuclear and two chloroplast loci. First, we present evi-dence for significant genetic structure amongparviglumis subpopulations and describe patterns of gene flow among subpopulations. Second, we show that species-wide samples lead to estimates of population genetic parameters (p,u, and Tajima’sD) that are biased relative to NE expectations, consistent with previous studies. Third, through comparison of population genetic pa-rameters estimated from subpopulation-specific samples vs. species-wide samples, we show that the genomewide excess of rare variants found in species-wide samples may be caused, in part, by population structure. Finally, we show that the consequences of subpopulation-specific sampling for estimation of population genetic parame-ters depends on the geographic region from which samples are taken, most likely due to different de-mographic histories.
MATERIALS AND METHODS
individual from seed collected from separate maternal plants in natural populations. Seeds were collected in 2001 by Peter Tiffin, Jesus Sanchez (Universidad de Guadalajara), and Nicholas Lauter (University of Illinois). DNA was extracted from leaf material using DNeasy plant kits (QIAGEN, Valencia, CA). Four populations were from the Mexican state of Jalisco, the westernmost section of the species’ range, and three populations were from the Balsas River region of the Mexican states of Mexico and Michoaca´n (Figure 1; supplemental Table 1 at http://www.genetics.org/supplemental/). These regions comprise two geographically distinct portions of the species’ range and correspond with the two races of parviglumis distinguished by Wilkes(1967).
Five nuclear and two chloroplast loci,.6500 bases, were PCR amplified and sequenced from each of the 84 DNA samples (supplemental Table 2 at http://www.genetics.org/ supplemental/). Three of the nuclear loci include coding regions (adh1andglb1, chromosome 1;waxy, chromosome 9) and have been the subject of previous surveys of nucleotide diversity in smaller, species-wide samples ofparviglumis(Eyre
-Walker et al. 1998; Hilton and Gaut 1998; Zhang et al.
2002), and two of the loci are noncoding anonymous markers in maize:asg65(Asgrow Seed maize clone, chromosome 2) and bnl7 (Brookhaven National Lab maize clone, core bin marker 7.06, probe p-umc168, chromosome 7). The two chlo-roplast loci (trnT-L,trnL-F) are intergenic spacers (Taberlet
et al. 1991). Because teosinte is highly outcrossing, purified PCR products from nuclear genes were cloned into pGEM-T vectors (Promega, Madison, WI) and transformed into com-petent Escherichia coli cells. Plasmids were purified using a Qiaprep 8 Miniprep kit (QIAGEN). For each individual, one cloned DNA fragment was sequenced. To correct for Taq polymerase errors in cloned fragments, we identified individ-uals in the alignments that contained singletons and rese-quenced fragments from these individuals either directly from PCR products or by sequencing four or more clones from a second PCR. Sequences were assembled and aligned manually in BioEdit 7.0.4.1 (Hall1999).
Population structure and patterns of migration:We tested for evidence of population subdivision using an analysis of molecular variance (AMOVA; Excoffieret al. 1992) where
sequence variation was hierarchically partitioned between the two geographic regions ( Jalisco and Balsas; Figure 1), among subpopulations within regions, and among individuals within subpopulations. We also tested for genetic differentiation be-tween pairs of populations usingFST(ARLEQUIN; Schneider et al. 2000) andSnn(Hudson2000). Statistical significance of
covariance components (andF-statistics) from AMOVAs and pairwiseFST’s was determined on the basis of the distribution
of values obtained from 10,000 permutations of the data under panmixis. The statistical significance of pairwiseSnnvalues was
determined by permuting the data 1000 times in DnaSP v 4.0. Although FST is theorectially related to migration rates,
estimating migration from FST is problematic because of
biologically unrealistic assumptions, including equal popu-lation sizes and symmetric migration among popupopu-lations (Whitlockand McCauley1999). Examining pairwiseF
ST’s
can also lead to unreliable inferences about patterns of migration because of interdependence among multiple pop-ulations (Fu et al. 2003). To avoid these problems, we
esti-mated migration rates using the Bayesian version of LAMARC 2.02 (Kuhneret al. 2005), which accounts for the genealogical
relationships among alleles and allows for asymmetrical migration between subpopulations, unequal population sizes, and population size changes (Beerliand Felsenstein1999).
The Bayesian approach may provide better estimates of pa-rameters for sparse data sets, where the maximum-likelihood approach commonly fails to converge (Beerli2006). We
ob-tained asymmetric estimates of migration rates (effective num-ber of migrants per generation) between populations (g ¼ 4Nemi) from the product ofMi¼mi/mandui¼4Nemon the
basis of all five nuclear genes. We also simultaneously ex-amined demographic history by obtaining estimates of the exponential population growth rate parameter,g½whereut¼
upresentexp(gt), for each subpopulation. Default priors were used for recombination and migration; we adjusted priors for
uby specifying a linear density and a lower and upper limit of 0.001 and 0.1; these values encompass the range of estimates from previous studies of these genes in Zea, as well as estimates from this study.
We conducted two runs of LAMARC, each with one 1500-sample initial chain and one 100,000-sample final chain. The analysis was conducted with replication of chains and adaptive heating (Metropolis-coupled Markov chain Monte Carlo), where chains are repeated using different initial genealogies and where each chain is split into multiple searches, allowing for better sampling of parameter space. The results of different runs of LAMARC were very similar and therefore we present one set of results.
Patterns of nucleotide polymorphism: We tested for the effects of population structure on patterns of nucleotide polymorphism by comparing estimates of population genetic parameters (p,u, and Tajima’sD) from species-wide samples and subpopulation-specific samples. Species-wide surveys are typically conducted by sampling one to a few individuals from multiple geographically isolated populations or ecotypes rather than from many individuals per population, as in our data set. Therefore, to simulate a species-wide survey using our data set, we resampled our entire data set by drawing two indi-viduals from each of the seven subpopulations and estimating population genetic parameters. The resulting set of 14 sequences provides an adequate sample size for obtaining accurate es-timates of population genetic parameters (Pluzhnikovand
Donnelly1996). This procedure was repeated for a total of
1000 iterations. Subpopulation-specific estimates ofp,u, and Tajima’sDwere obtained directly from our data using DnaSP v.4.0 (Rozaset al. 2003).
Figure1.—Geographic distribution of the seven
To test whether species-wide and subpopulation-specific estimates of polymorphism differed from NE expectations, we compared our estimates of population genetic parameters to distributions obtained from coalescent simulations. Coalescent simulations were conducted using the standard Wright–Fisher neutral model, which assumes a large, panmictic population of constant size, and allowing for recombination. Simulations included 1000 replicates of 14 sequences drawn from our entire data set of sequences from seven populations (hereafter referred to as NE expectations). Our simulations were condi-tioned on empirical estimates ofuand recombination (4Nc) obtained from our entire data set. The simulations were con-ducted using the program described in Tenaillon et al.
(2004), which is a modified version of the standard method described in Hudson(2002).
Linkage disequilibrium: To examine the consequences of population structure for patterns of linkage disequilibrium, we obtained estimates of the population recombination rate (r), which is inversely proportional to linkage disequilibrium, for each subpopulation at each locus. Analyses were imple-mented in LDhat (http://www.stats.ox.ac.uk/mcvean/LDhat), which estimatesrusing the coalescent method of Hudson
(2001). Because the ability to detect recombination was influenced by levels of nucleotide diversity—i.e., population recombination rate estimates were positively related to levels of nucleotide diversity (F¼22.3;P,0.001;R2¼0.40)—we scaled measures ofrbyu(see Haddrillet al. 2005).
RESULTS
Population structure and patterns of migration:
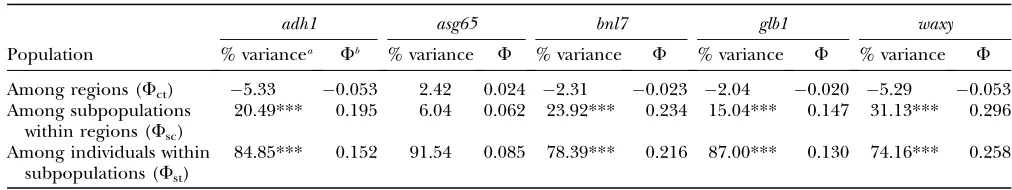
Hierarchical AMOVAs provided no evidence that se-quence variation was partitioned between the two geo-graphic regions; covariance component estimates were close to zero (often slightly negative) for all five nuclear loci (Table 1). Despite a lack of regional structure, vari-ation was significantly partitioned among subpopulvari-ations within geographic regions for all five loci, accounting for 6.0% (asg65) to 31.1% (waxy) of total variation. Individual subpopulations, however, harbored the ma-jority of variation for each locus (74.2–91.5%).
Consistent with the results from AMOVAs, pairwise FST’s revealed strong genetic differentiation within the
Jalisco region, even among closely situated populations (FST range: 0.0079–0.7024; mean: 0.2436; 25 of 30 estimates differed significantly from zero atP,0.05), (supplemental Table 2 at http://www.genetics.org/ supplemental/). By contrast, there was little evidence of differentiation between populations within the Balsas region (FSTrange:0.0703–0.1642; mean: 0.0209; only 3 of 15 estimates differed significantly from zero). Ge-netic differentiation between geographic regions was intermediate between that found within the two regions (FSTrange:0.0316–0.6586; mean: 0.1531). While some between-region population pairs were significantly dif-ferentiated, populations A and G ( Jalisco) showed little or no differentiation from populations EG and Z (Balsas). The absence of differentiation between these popula-tion pairs appears to have contributed to the lack of regional structure indicated by AMOVAs. Patterns of population structure were largely consistent among the five loci, withadh1andasg65showing the weakest and waxy the strongest signal of population genetic sub-division (supplemental Table 2 at http://www.genetics. org/supplemental/). Analyses of population differen-tiation usingSnnproduced results similar to that from
FST(supplemental Table 3 at http://www.genetics.org/ supplemental/).
The coalescent-based analysis implemented in LAMARC suggested that migration between geographic regions was asymmetrical, with gene flow occurring principally from western Jalisco subpopulations (especially A and G) into the three eastern Balsas subpopulations. Rates of migration (4Nm) from population A or G to Balsas pop-ulations ranged from 3.6 to 10.6 and from 0.9 to 5.0 effective migrants/generation, respectively. Rates of migration from any Balsas population into any Jalisco population were generally much ,1.0 and not .2.3. Consistent with the amount of genetic differentiation measured by pairwiseFSTandSnn(supplemental Tables 2 and 3 at http://www.genetics.org/supplemental/), rates of migration were very high among populations within
TABLE 1
Hierarchical analysis of molecular variance for the seven subpopulations from two geographic regions, Jalisco and Balsas
adh1 asg65 bnl7 glb1 waxy
Population % variancea Fb % variance F % variance F % variance F % variance F
Among regions (Fct) 5.33 0.053 2.42 0.024 2.31 0.023 2.04 0.020 5.29 0.053
Among subpopulations within regions (Fsc)
20.49*** 0.195 6.04 0.062 23.92*** 0.234 15.04*** 0.147 31.13*** 0.296
Among individuals within subpopulations (Fst)
84.85*** 0.152 91.54 0.085 78.39*** 0.216 87.00*** 0.130 74.16*** 0.258
***P,0.001.
a
The percentage of total variance explained by each hierarchical grouping, including the probability of having a more extreme variance component andF-statistic than the observed values assessed by permutation tests.
b
Fixation indices describing the correlation of haplotypes for each level of subdivision relative to a higher-level grouping:Fct,
correlation within a region relative to the whole species;Fsc, correlation within populations relative to the region;Fst, correlation
the Balsas region and low among populations within the Jalisco region (Figure 2).
Despite limited sequence variation, the chloroplast loci provided evidence of population subdivision and some suggestion of regional differentiation. Sequences from three Jalisco subpopulations (G, S, and T) were identical and differed from two Balsas populations (SNT and Z) at one SNP (intrnL-F) and a dinucleotide repeat motif (intrnT-L) (Figure 1). One subpopulation in each region, however, harbored haplotypes dominant in the other geographic region (A and EG). Jalisco subpopulation A was fixed for the trnT-L haplotype present in Balsas subpopulations SNT and Z and poly-morphic for thetrnL-Fhaplotype. Individuals from the Balsas population EG shared thetrnL-Fhaplotype and five of six individuals shared thetrnT-Lhaplotype with Jalisco populations (G, S, and T).
Population growth:The LAMARC analysis suggested that all three Balsas subpopulations along with Jalisco subpopulations A and G have expanded in size (Figure 3). Large and positive values of the exponential growth pa-rameter,g½whereut¼upresentexp(gt), indicate population expansion whereas negative values indicate population shrinkage; the scale of g is not symmetrical and thus relatively small positive values (g¼10) may indicate little or no growth while small negative values (g¼ 10) may indicate important population size declines (LAMARC documentation: http://evolution.gs.washington.edu/ lamarc/). For all Balsas subpopulations and Jalisco sub-populations A and G, 95% C.I.’s of the population growth parameter,g, were.100, indicating population growth (Figure 3A). For subpopulations S and T, 95% C.I.’s forgencompassed positive and negative values, pro-viding no evidence for recent population size changes. We also tested for evidence of population growth using Fs(Fu1997) andR2(Ramos-Onsinsand Rozas2002). These analyses also suggested population growth in Balsas subpopulations but no strong support for growth
in any Jalisco subpopulation (supplemental Table 4 at http://www.genetics.org/supplemental/).
Tests for deviations from NE expectations:We tested for deviations from NE expectations by comparing our empirical estimates of population genetic parameters (from species-wide and subpopulation-specific samples)
Figure 2.—Asymmetric migration rates
tween pairs of subpopulations within and be-tween the two geographic regions (indicated by boxes) estimated using the Bayesian version of LAMARC. Arrows indicate the direction of migra-tion inferred from the analysis. Migramigra-tion rates less than one are not shown.
Figure3.—Comparison of population growth and the
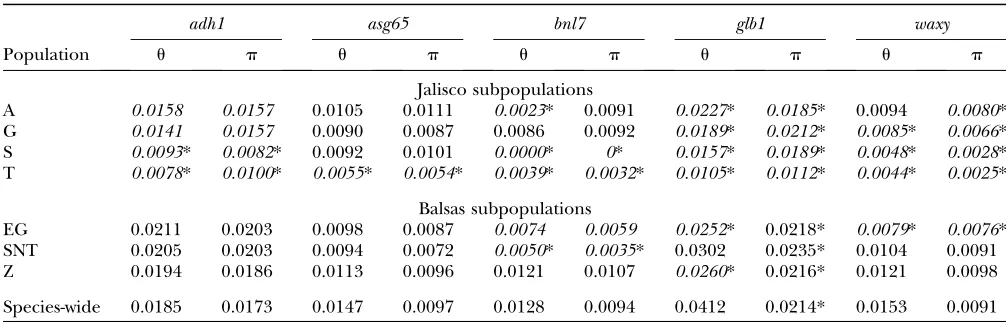
to expected distributions obtained from coalescent simula-tions. Overall, both species-wide and subpopulation-specific samples had lower levels of diversity than NE expect-ations from coalescent simulexpect-ations (Table 2; supplemen-tal Table 5 at http://www.genetics.org/supplemensupplemen-tal/); however, only species-wide samples had consistently lower (more negative) Tajima’sDvalues than coalescent distributions (Table 3; supplemental Table 6 at http:// www.genetics.org/supplemental/). The distributions of species-wide u and p, obtained from resampling the entire data set, had significantly lower means and vari-ances than the distributions of these statistics obtained from coalescent simulations (NE expectations) (Figure 4; supplemental Table 6 at http://www.genetics.org/ supplemental/). Subpopulation-specific estimates ofu
andpwere highly variable but tended to be lower than NE expectations, particularly for Jalisco populations (u: 0–0.0302;p: 0–0.0235; Figure 4; Table 2). The dif-ference between the empirical estimates and NE ex-pectations suggests that nonequilibrium demographic processes or population structure have influenced levels of diversity.
Under mutation-drift equilibrium, both u and p
estimate 4Nm, and Tajima’sDis not expected to deviate significantly from zero. Similar to previous surveys of nucleotide diversity inparviglumis, estimates ofDfrom our species-wide sample were consistently negative (D¼ 1.568 to0.213; Table 3) and the meanDvalue for the five genes (0.984) was significantly less than zero (t¼ 4.36;P ¼0.0121). Although none of the species-wide estimates deviated significantly from zero under the conservative assumption of no recombination, three of five values (forasg65,glb1,waxy) were less than the lower bound of the 95% C.I. obtained from our coalescent simulations conducted with recombination (Figure 4; supplemental Table 6 at http://www.genetics.org/ supplemental/). These results indicate that species-wide
samples contain an excess of rare variants relative to NE expectations. Subpopulation-specific estimates of Tajima’s D varied widely and included both negative and pos-itive values (D¼ 1.989–1.567; Table 3). However, we did not observe a strong and consistent skew to D estimates as in species-wide samples. Of 19Destimates from Jalisco subpopulations, 5 fell outside of the co-alescent 95% C.I. (3 lower and 2 higher than expected) and 4 of 15Destimates from Balsas subpopulations fell below the coalescent 95% C.I. (Figure 4; Table 3). Overall, subpopulation-specific estimates showed a less consistent deviation from NE expectations compared to species-wide samples.
Tests for differences between subpopulation-specific and species-wide samples: We tested whether the empirical sampling approach influenced estimates of
TABLE 2
Nucleotide polymorphism, measured byuandp, for subpopulation-specific and species-wide samples of five nuclear genes
adh1 asg65 bnl7 glb1 waxy
Population u p u p u p u p u p
Jalisco subpopulations
A 0.0158 0.0157 0.0105 0.0111 0.0023* 0.0091 0.0227* 0.0185* 0.0094 0.0080* G 0.0141 0.0157 0.0090 0.0087 0.0086 0.0092 0.0189* 0.0212* 0.0085* 0.0066* S 0.0093* 0.0082* 0.0092 0.0101 0.0000* 0* 0.0157* 0.0189* 0.0048* 0.0028* T 0.0078* 0.0100* 0.0055* 0.0054* 0.0039* 0.0032* 0.0105* 0.0112* 0.0044* 0.0025*
Balsas subpopulations
EG 0.0211 0.0203 0.0098 0.0087 0.0074 0.0059 0.0252* 0.0218* 0.0079* 0.0076* SNT 0.0205 0.0203 0.0094 0.0072 0.0050* 0.0035* 0.0302 0.0235* 0.0104 0.0091 Z 0.0194 0.0186 0.0113 0.0096 0.0121 0.0107 0.0260* 0.0216* 0.0121 0.0098
Species-wide 0.0185 0.0173 0.0147 0.0097 0.0128 0.0094 0.0412 0.0214* 0.0153 0.0091
Population-specific estimates shown in italics differed significantly from the resampled distribution using species-wide sampling. Asterisks denote values that differ significantly from the coalescent distributions (P, 0.05). For all significant differences, population-specific estimates were less than resampled and coalescent distributions.
TABLE 3
Tajima’sDfor subpopulation-specific and species-wide samples of five nuclear genes
Population adh1 asg65 bnl7 glb1 waxy
Jalisco subpopulations
A 0.032 0.232 0.729 0.728* 0.352 G 0.479 0.120 0.301 0.519 0.710 S 0.592 0.454 — 0.955* 1.811*
T 1.567* 0.089 0.789 0.341 1.989*
Balsas subpopulations
EG 0.236 0.724 1.242 0.874* 0.047 SNT 0.041 1.145 1.316 1.135* 0.442 Z 0.221 0.706 0.524 0.702* 0.858*
Species-wide 0.213 1.114 0.830 1.568* 1.202*
poplation genetic parameters by comparing each of our subpopulation-specific estimates to resampled distribu-tions of species-wide samples. Overall, we found that estimates of nucleotide diversity from subpopulation-specific samples tended to be lower than species-wide samples, with 20 of 35 estimates falling below the 95% C.I.’s for species-wide samples (Figure 4; Table 2). How-ever, this difference was driven mainly by subpopula-tions from Jalisco; Balsas subpopulasubpopula-tions have levels of nucleotide diversity similar to those of species-wide sam-ples. Subpopulation-specific estimates ofufell below the 95% C.I.’s from species-wide resampled distributions for 15 of 20 estimates from Jalisco subpopulations but only for 5 of 15 estimates from Balsas subpopulations (Figure 4; Table 2). When directly comparing estimates from the two regions, we found that the mean of the population estimates of u was significantly lower for Jalisco than Balsas populations for the two most variable loci,adh1 (Wilcoxon sign rank test;u:P¼0.05;p:P,0.05;n¼7) andglb1(u:P¼0.05;p:P¼0.05;n¼7). The same trend was observed foruin the other three nuclear loci, but the differences between geographic regions were not significant. Levels of nucleotide variation measured us-ingpshowed similar patterns to those foru(Figure 4; Table 2).
The frequency spectrum of polymorphism, as mea-sured by Tajima’sD, tended to be higher (closer to zero) in subpopulation-specific estimates than that found in species-wide samples (meanD: subpopulation specific¼
0.37, species-wide¼ 0.99), with 14 of 35 estimates falling outside of the 95% C.I.’s for species-wide samples (Figure 4, Table 3). As with estimates of diversity, we found that the frequency spectrum of individual Jalisco subpopulations often deviated from that of species-wide samples, whereas spectra from Balsas subpopulations closely resembled those from species-wide samples. Estimates of Dfrom Jalisco populations ranged widely from1.989 to 1.567 with a mean near zero (mean¼ 0.09) with approximately half of the values less than zero and half greater than zero (Figure 4; Table 3). Of 19, 11 fell outside of the resampled 95% C.I., with approximately half of the significant values less than the lower bound and half greater than the upper bound. In contrast to Jalisco, estimates ofDfor Balsas subpopula-tions were strongly skewed to negative values (range: 1.32–0.05), with only 3 of 15 values falling below the resampled 95% C.I. A direct comparison of D values between the two geographic regions showed that the mean and variance in Tajima’sDwas greater for Jalisco than for Balsas subpopulations (Welch’s ANOVA: F¼ 6.433;P¼0.017; Levene’s test for unequal variance:F¼ 4.476;P¼0.042;n¼7).
Linkage disequilibrium: We examined LD within subpopulations and in species-wide samples using estimates of the population recombination rate scaled by nucleotide diversity (r/u). Overall, subpopulation-specific estimates tended to exhibit higher LD (lowerr/u) than species-wide samples across the five nuclear loci
Figure 4.—Distributions
(supplemental Table 6 at http://www.genetics.org/ supplemental/). Despite this overall pattern, we found regional differences in subpopulation-specific estimates of LD. Figure 3B shows composite likelihood scores for
r/u for each subpopulation along with the range of locus-specific estimates. Linkage disequilibrium was relatively high in Jalisco subpopulations, whereas Balsas subpopulations (especially SNT and Z) exhibited lower levels of LD, which were comparable to species-wide estimates (Figure 3B; supplemental Table 6 at http:// www.genetics.org/supplemental/). Although the range of values for Balsas subpopulations overlaps with those of Jalisco subpopulations, the composite maximum-likelihood estimates across the five loci are well above the range of values observed for all four Jalisco sub-populations. This pattern of population and regional variation in LD remains the same even whenr is not scaled byu.
DISCUSSION
A basic assumption of most statistical tests in molec-ular population genetics is that sequences are randomly sampled from a panmictic population of constant size. Violating these assumptions can bias estimates of nu-cleotide diversity and lead to erroneous evidence for positive or balancing selection. Although it is well known that genetic variation in many plant species is structured among subpopulations and that the distribution and abundance of species has shifted repeatedly over time, the vast majority of surveys of sequence variation in plant species have relied on species-wide sampling strategies. InZea maysssp. parviglumis, species-wide sampling has revealed genomewide departures from a neutral equi-librium model, as manifest by an excess of uncommon polymorphic variants (Zhang et al. 2002; Tenaillon
et al. 2004; Moeller and Tiffin 2005; Wright et al. 2005). Similarly in this study, comparisons of resampled distributions of our entire data set to coalescent dis-tributions indicated that species-wide samples strongly deviated from NE expectations. Our analyses of patterns of nucleotide polymorphism in a geographically explicit context suggest that the excess of uncommon poly-morphisms in species-wide samples is due in part to population subdivision.
Population structure and patterns of migration:Both nuclear and chloroplast loci indicated that nucleotide polymorphism was structured among populations, but without clear geographic patterning. Although subpo-pulations were sampled from two disjunct regions, we found little evidence for differentiation between these regions. For nuclear loci, each of the subpopulations contained the majority of nuclear diversity (80%) and the remainder was harbored among subpopulations within geographic regions. For chloroplast loci, popula-tion subdivision was strong, with haplotypes commonly
fixed within populations, and there was some suggestion of differentiation between regions although not com-plete. This partitioning of sequence variation among subpopulations can have important effects on statisti-cal tests of the NE model, even when the majority of polymorphism is harbored within populations. In partic-ular, species-wide samples may often contain an excess of rare variants because multiple subpopulations each con-tain singleton polymorphisms (Hammer et al. 2003). Thus, as an increasing number of subpopulations is pooled for analysis, the frequency spectrum of poly-morphism is likely to show a greater skew away from NE expectations and make the identification of loci under selection increasingly difficult.
Beyond the partitioning of sequence variation among populations, the specific pattern of gene flow among subpopulations can influence levels and patterns of poly-morphism found within subpopulations. Our coalescent-based analyses indicated that migration has occurred primarily from two western Jalisco populations (A and G) into eastern Balsas populations, but not the reverse. These results are surprising in light of evidence suggest-ing that Jalisco populations are derived from Balsas populations (Fukunaga et al. 2005) and that coloni-zation of Jalisco may have occurred from refugia in the Balsas Valley following the most recent glacial maximum (Buckler et al. 2006). It is important to note that inferences about migration from LAMARC are made under the assumption that migration structure has been stable and that populations have persisted for a long time period (Kuhner2006). Given that these assump-tions may be unrealistic forparviglumis, it is possible that asymmetric migration estimates instead reflect shared ancestry (recent founding of populations A and G from Balsas populations) rather than asymmetrical patterns of gene flow.
Subpopulation-specific patterns of nucleotide poly-morphism: To test whether genomewide departures from NE expectations found in species-wide samples may be due to population structure, we compared levels and patterns of polymorphism within individual sub-populations to those from species-wide samples. Over-all, we found that subpopulation-specific estimates ofu
show consistent deviations from NE expectations, we found high variance among estimates, including strongly positive and negative values. This high variance is con-sistent with predictions from theoretical studies that have examined the influence of evolutionary and de-mographic processes on sequence variation within sub-populations (Wakeleyand Aliacar2001; Wrightand Gaut2005).
Similar to the patterns that we identified in parviglu-mis, molecular population genetic studies in humans have suggested that sampling across multiple subpopu-lations influences estimates of the extent and pattern of nucleotide polymorphism. Specifically, studies of X-linked and autosomal loci that sampled a few individ-uals from a geographically diverse set of populations reported more negative values of Tajima’sDcompared to studies that sampled more intensively from a few populations (Ptakand Przeworski2002). For loci on the Y chromosome, Hammeret al. (2003) found a neg-ative correlation between Tajima’s Dand the number of populations pooled for analysis. In both cases, the global sampling approach recovered more rare alleles present in only one or a few subpopulations. Thus, when nucleotide variation is structured among subpopula-tions, sampling strategy clearly influences the estima-tion of populaestima-tion genetic parameters and inferences about natural selection and demographic history. The inconsistency in sampling strategy among studies will also limit the ability of researchers to compare loci within genomes and examine patterns across genomes.
Regional variation in patterns of nucleotide poly-morphism:Although sampling sequences from individ-ual subpopulations tended to produce, on average, less consistent skew to the frequency spectrum of poly-morphism, our data suggest that this result may depend upon the geographic region from which subpopulations were sampled. In particular, differences in demographic history between the Jalisco and Balsas regions may account for our observed differences in diversity, the frequency spectrum of polymorphism, and linkage disequilibrium.
Jalisco populations had relatively low levels of nucle-otide variation, highly variable Tajima’sD’s, and higher linkage disequilibrium, all of which may reflect the action of random genetic drift during a population bottleneck. This scenario appears to be plausible in light of evidence suggesting that Jalisco populations have been recently founded from glacial refugia in the Balsas Valley (Buckler et al. 2006). In addition to reducing overall variation, a population bottleneck is expected to cause a shift in the frequency spectrum of segregating polymorphisms because rare variants are lost from pop-ulations at a higher rate than common variants. De-pending on the composition of the ancestral population and the timing of the bottleneck, episodes of drift can result in an excess of either high- or low-frequency variants (Charlesworth et al. 2003). This pattern was
evident in the Jalisco region where subpopulation-specific frequency spectra were often strongly skewed, as in-dicated by positive and negativeDvalues. On the basis of our analysis, we cannot rule out the possibility that low rates of gene flow among differentiated Jalisco sub-populations contribute to the high variance in Dand high levels of linkage disequilibrium; however, it does not appear that patterns of gene flow lead to a consis-tent direction of skew in the frequency spectra within subpopulations.
Unlike Jalisco populations, Balsas subpoplations tended to have high levels of nucleotide variation, con-sistently negative Tajima’sD’s, and low linkage disequi-librium, all of which were comparable to species-wide estimates. Given that Balsas populations exhibited little genetic differentiation from one another and that esti-mates of population genetic parameters from individual subpopulations did not differ significantly from that of species-wide samples, it seems unlikely that population structure can account for these results. Instead, our tests for population size changes from LAMARC and from two other statistical tests (Fs and R2) suggest recent population growth, which could be responsible for the excess of rare variants in Balsas subpopulations. These results, along with comparatively low linkage disequilib-rium, also argue against recent bottlenecks or admix-ture as causes of skewed frequency spectra.
Species-wide samples of diversity from Arabidopsis thaliana(Schmidet al. 2005),Populus tremula(Ingvarsson 2005), and nondomesticated Helianthus annuus (Liu and Burke2006) are also characterized by an excess of rare variants. InA. thaliana, this skew has been suggested to be the result of population expansion (Innanand Stephan2000; Kuittinenand Aguade´2000). More re-cent analyses have shown that the skew in the frequency spectrum may be more pronounced for nonsynony-mous compared to synonynonsynony-mous sites, suggesting that both demographic events and purifying selection con-tribute to the excess of rare variants (Nordborget al. 2005). Our results similarly indicate that rare variants were significantly more common for nonsynonymous sites relative to synonymous sites and that this pattern did not differ between the geographic regions (supplemental Figure 1 at http://www.genetics.org/supplemental/). Although purifying selection may contribute to a pat-tern of polymorphism, it does not appear to explain differences in frequency spectra between the Jalisco and Balsas regions.
Conclusions:We found that the importance of popu-lation structure to nucleotide diversity withinparviglumis is dependent upon the geographic region that is sam-pled. In contrast to the Jalisco region, Balsas subpopu-lations harbored an excess of rare variants, similar to species-wide samples. Given that maize appears to have been domesticated fromparviglumispopulations grow-ing in the Balsas region (Doebley 1990; Matsuoka
estimates of levels and patterns of diversity in the progenitor population of maize. Species-wide samples are also likely to be appropriate for characterizing the effects of domestication on nucleotide diversity (e.g., Hiltonand Gaut1998; Tenaillonet al. 2004) and the effects of artificial selection on individual genes (Wang
et al. 1999; Whitt et al. 2002; Yamasakiet al. 2005), as well as for conducting genomewide scans to identify genes that evolved in response to artificial selection during domestication (Vigourouxet al. 2002; Wright
et al. 2005).
Although species-wide samples may be useful for understanding aspects of maize domestication, surveys sampling multiple subpopulations may provide a more complete view of the processes shaping sequence vari-ation. In addition to population subdivision and neutral evolutionary processes alone, patterns of sequence vari-ation may be influenced by geographically variable selec-tion. In the case of adaptive differentiation, a signature of selection at the molecular level may be undetectable when sampling across populations with different evolu-tionary histories. Local adaptation is remarkably com-mon in plants (reviewed in Linhartand Grant1996), and patterns of selection frequently differ among pop-ulations and over environmental gradients (Endler1977, 1986), suggesting that a geographic perspective on mo-lecular population genetic studies may be necessary for understanding the role of demographic and selective factors in shaping nucleotide diversity.
We thank Andy Muncaski and Nicholas Lauter for their help collectingparviglumisseeds, N. Lauter and Jesus Sanchez for gener-ously providing us with seeds, Jesse Stringer for help in collecting sequence data, Eric Rynes for help implementing and interpreting the LAMARC analyses, and three anonymous reviewers for valuable com-ments on the manuscript. Financial support for this work was provided by National Science Foundation grant DEB 0235027 to P.T.
LITERATURE CITED
Akey, J. M., G. Zhang, K. Zhang, L. Jin and M. D. Shriver,
2002 Interrogating a high-density SNP map for signatures of natural selection. Genome Res.12:1805–1814.
Andolfatto, P., and M. Przeworski, 2000 A genome-wide
depar-ture from the standard neutral model in natural populations of Drosophila. Genetics156:257–268.
Beerli, P., 2006 Comparison of Bayesian and maximum-likelihood
inference of population genetic parameters. Bioinformatics22:
341–345.
Beerli, P., and J. Felsenstein, 1999 Maximum-likelihood
estima-tion of migraestima-tion rates and effective populaestima-tion numbers in two populations using a coalescent approach. Genetics 152:
763–773.
Buckler, E. S., IV, M. M. Goodman, T. P. Holtsford, J. F. Doebley,
and J. SanchezG., 2006 Phylogeography of the wild subspecies
ofZea mays. Maydica51:123–134.
Charlesworth, B., M. Nordborg and D. Charlesworth,
1997 The effects of local selection, balanced polymorphism and background selection on equilibrium patterns of genetic di-versity in subdivided populations. Genet. Res.70:155–174. Charlesworth, B., D. Charlesworth and N. H. Barton,
2003 The effects of genetic and geographic structure on neu-tral variation. Annu. Rev. Ecol. Syst.34:99–125.
Doebley, J., 1990 Molecular evidence and the evolution of maize.
Econ. Bot.44(3, Suppl.): 6–27.
Doebley, J., 2004 The genetics of maize evolution. Annu. Rev.
Genet.38:37–59.
Doebley, J., A. Stecand L. Hubbard, 1997 The evolution of apical
dominance in maize. Nature386:485–488.
Endler, J. A., 1977 Geographic Variation, Speciation, and Clines. Princeton
University Press, Princeton, NJ.
Endler, J. A., 1986 Natural Selection in the Wild. Princeton University
Press, Princeton, NJ.
Excoffier, L., P. E. Smouseand J. M. Quattro, 1992 Analysis of
molecular variance inferred from metric distances among DNA haplotypes: application to human mitochondrial DNA restriction data. Genetics131:479–491.
Eyre-Walker, A., R. L. Gaut, H. Hilton, D. L. Feldmanand B. S.
Gaut, 1998 Investigation of the bottleneck leading to the
do-mestication of maize. Proc. Natl. Acad. Sci. USA95:4441–4446. Ford, M. J., 2002 Applications of selective neutrality tests to
molec-ular ecology. Mol. Ecol.11:1245–1262.
Fu, R. W., A. E. Gelfandand K. E. Holsinger, 2003 Exact moment
calculations for genetic models with migration, mutation, and drift. Theor. Popul. Biol.63:231–243.
Fu, Y.-X., 1997 Statistical tests of neutrality of mutations against
pop-ulation growth, hitchhiking and background selection. Genetics
147:915–925.
Fukunaga, K., J. Hill, Y. Vigouroux, Y. Matsuoka, G. J. Sanchez
et al. 2005 Genetic diversity and population structure of teo-sinte. Genetics160:2241–2254.
Haddrill, P. R., K. R. Thornton, B. Charlesworth and P.
Andolfattto, 2005 Multilocus patterns of nucleotide
variabil-ity and the demographic and selection history of Drosophila me-lanogaster populations. Genome Res.15:790–799.
Hall, T. A., 1999 BioEdit: a user-friendly biological sequence
align-ment editor and program for windows 95/98/NT. Nucleic Acids Symp. Ser.41:95–98.
Hammer, M. F., F. Blackmer, D. Garrigan, M. W. Nachmanand J. A.
Wilder, 2003 Human population structure and its effects on
sampling Y chromosome sequence variation. Genetics 164:
1495–1509.
Hilton, H., and B. S. Gaut, 1998 Speciation and domestication in
maize and its wild relatives: evidence from theglobulin-1gene. Ge-netics150:863–872.
Hudson, R. R., 2000 A new statistic for detecting genetic
differen-tiation. Genetics155:2011–2014.
Hudson, R. R., 2001 Two-locus sampling distributions and their
ap-plication. Genetics159:1805–1817.
Hudson, R. R., 2002 Generating samples under a Wright-Fisher
neutral model of genetic variation. Bioinformatics18:337–338. Ingvarsson, P. K., 2005 Nucleotide polymorphism and linkage
dis-equilibrium within and among natural populations of European aspen (Populus tremulaL., Salicaceae). Genetics169:945–953. Innan, H., and W. Stephan, 2000 The coalescent in an
exponen-tially growing metapopulation and its application toArabidopsis thaliana. Genetics155:2015–2019.
Kuhner, M. K., 2006 LAMARC 2.0: maximum likelihood and Bayesian
estimation of population parameters. Bioinformatics22:768–770. Kuhner, M. K., J. Yamato, P. Beerli, L. P. Smith, E. Ryneset al.,
2005 LAMARC. University of Washington, Seattle.
Kuittinen, H., and M. Aguade´, 2000 Nucleotide variation at the
CHALCONE ISOMERASElocus inArabidopsis thaliana. Genetics
155:863–872.
Li, W. H., and M. Nei, 1974 Stable linkage disequilibrium without
epis-tasis in subdivided populations. Theor. Popul. Biol.6:173–183. Linhart, Y. B., and M. C. Grant, 1996 Evolutionary significance of
local genetic differentiation in plants. Annu. Rev. Ecol. Syst.27:
237–277.
Liu, A., and J. M. Burke, 2006 Patterns of nucleotide diversity in
wild and cultivated sunflower. Genetics173:321–330.
Matsuoka, Y., Y. Vigouroux, M. M. Goodman, J. SanchezG., E. S.
Buckleret al. 2002 A single domestication for maize shown by
multilocus microsatellite genotyping. Proc. Natl. Acad. Sci. USA
99:6080–6084.
Moeller, D. A., and P. Tiffin, 2005 Genetic diversity and the
evo-lutionary history of plant immunity genes in two species of
Nagylaki, T., 1980 The strong migration limit in geographically
structured populations. J. Math. Biol.9:101–114.
Nordborg, M., and H. Innan, 2003 The genealogy of sequences
containing multiple sites subject to strong selection in a subdi-vided population. Genetics163:1201–1213.
Nordborg, M., T. T. Hu, Y. Ishino, J. Jhaveri, C. Toomajianet al.,
2005 The pattern of polymorphism in Arabidopsis thaliana. PLoS Biol.3:1289–1299.
Ohta, T., 1982 Linkage disequilibrium due to random genetic drift
in finite subdivided populations. Proc. Natl. Acad. Sci. USA79:
1940–1944.
Parsch, J., C. D. Meiklejohnand D. L. Hartl, 2001 Patterns of
DNA sequence variation suggest the recent action of positive se-lection in the janus-ocnus region ofDrosophila simulans. Genetics
159:647–657.
Pluzhnikov, A., and P. Donnelly, 1996 Optimal sequencing
strat-egies for surveying molecular genetic diversity. Genetics 144:
1247–1267.
Ptak, S. E., and M. Przeworski, 2002 Evidence for population
growth in humans is confounded by fine-scale population struc-ture. Trends Genet.18:559–563.
Ramos-Onsins, S. E., and J. Rozas, 2002 Statistical properties of
new neutrality tests against population growth. Mol. Biol. Evol.
19:2092–2100.
Rozas, J., J. C. Sanchez-DelBarrio, X. Messeguerand R. Rozas,
2003 DnaSP, DNA polymorphism analyses by the coalescent and other methods. Bioinformatics19:2496–2497.
Schmid, K. J., S. Ramos-Onsins, H. Ringys-Beckstein, B. Weisshaar
and T. Mitchell-Olds, 2005 A multilocus sequence survey in
Arabidopsis thalianareveals a genome-wide departure from a neutral model of DNA sequence polymorphism. Genetics 169: 1601– 1615.
Schneider, S., D. Roessli and L. Excoffier, 2000 Arlequin ver
2.000: a software package for population genetics data analysis. University of Geneva, Geneva.
Taberlet, P., L. Gielly, G. Pautouand J. Bouvet, 1991 Universal
primers for amplification of three non-coding regions of chloro-plast DNA. Plant Mol. Biol.17:1105–1109.
Tajima, F., 1989 Statistical method for testing the neutral mutation
hypothesis by DNA polymorphism. Genetics123:585–595. Tenaillon, M. I., J. U’Ren, O. Tenaillon, and B. S. Gaut, 2004
Se-lection versus demography: a multi-locus investigation of the do-mestication process in maize. Mol. Biol. Evol.21:1214–1225. Teshima, K. M., G. Coopand M. Przeworski, 2006 How reliable are
empirical genomic scans for selective sweeps? Genome Res.16:
702–712.
Toomajian, C., T. T. Hu, M. J. Aranzana, C. Lister, C. L. Tanget al.,
2006 A nonparametric test reveals selection for rapid flowering in theArabidopsisgenome. PLoS Biol.4:732–738.
Vigouroux, Y., M. McMullen, C. T. Hittinger, K. Houchins, L.
Schulzet al., 2002 Identifying genes of agronomic importance
in maize by screening microsatellites for evidence of selection during domestication. Proc. Natl. Acad. Sci. USA99:9650–9655. Voight, B. F., S. Kudaravalli, X. Wenand J. K. Pritchard, 2006 A
map of recent positive selection in the human genome. PLoS Biol.4:446–458.
Wakeley, J., and N. Aliacar, 2001 Gene genealogies in a
metapo-pulation. Genetics159:893–905.
Wall, J. D., P. Andolfattoand M. Przeworski, 2002 Testing
mod-els of selection and demography inDrosophila simulans. Genetics
162:203–216.
Wang, R.-L., A. Stec, J. Hey, L. Lukensand J. Doebley, 1999 The
lim-its of selection during maize domestication. Nature398:236–239. Whitlock, M. C., and D. D. McCauley, 1999 Indirect measures of
gene flow and migration: Fst not equal to 1/(4Nm11). Heredity
82:117–125.
Whitt, S. R., L. M. Wilson, M. I. Tenaillon, B. S. Gautand E. S.
Buckler, 2002 Genetic diversity and selection in the maize
starch pathway. Proc. Natl. Acad. Sci. USA99:12959–12962. Wilkes, H. G., 1967 Teosinte: The Closest Relative of Maize. Bussey
In-stitute, Harvard University, Cambridge, MA.
Wright, S., 1951 The genetical structure of populations. Ann. Eugen.
15:323–354.
Wright, S. I., and B. S. Gaut, 2005 Molecular population genetics
and the search for adaptive evolution in plants. Mol. Biol. Evol.
22:506–519.
Wright, S.I., B. Laugaand D. Charlesworth, 2003 Subdivision
and haplotype structure in natural populations ofArabidopsis lyr-ata. Mol. Ecol.12:1247–1263.
Wright, S. I., I. V. Bi, S. G. Schroeder, M. Yamasaki, J. F. Doebley
et al., 2005 The effects of artificial selection on the maize ge-nome. Science308:1310–1314.
Yamasaki, M., M. I. Tenaillon, I. V. Bi, S. G. Schroeder, H. Sanchez
-Villedaet al., 2005 A large-scale screen for artificial selection in
maize identifies candidate agronomic loci for domestication and crop improvement. Plant Cell17:2859–2872.
Zhang, L., A. S. Peek, D. Dunamsand B. S. Gaut, 2002 Population
genetics of duplicated disease-defense genes,hm1andhm2, in maize (Zea mays ssp.mays L.) and its wild ancestor (Zea mays
ssp.parviglumis). Genetics162:851–860.