This is a repository copy of
Modelling determinants of extinction across two Mesozoic
hyperthermal events
.
White Rose Research Online URL for this paper:
http://eprints.whiterose.ac.uk/137021/
Version: Accepted Version
Article:
Dunhill, AM orcid.org/0000-0002-8680-9163, Foster, WJ, Azaele, S
orcid.org/0000-0002-5153-4833 et al. (2 more authors) (2018) Modelling determinants of
extinction across two Mesozoic hyperthermal events. Proceedings of the Royal Society B:
Biological Sciences, 285 (1889). 20180404. ISSN 0962-8452
https://doi.org/10.1098/rspb.2018.0404
© 2018 The Author(s). Published by the Royal Society. All rights reserved. This is an
author produced version of a paper published in Proceedings of the Royal Society B:
Biological Sciences. Uploaded in accordance with the publisher's self-archiving policy.
[email protected] https://eprints.whiterose.ac.uk/ Reuse
Items deposited in White Rose Research Online are protected by copyright, with all rights reserved unless indicated otherwise. They may be downloaded and/or printed for private study, or other acts as permitted by national copyright laws. The publisher or other rights holders may allow further reproduction and re-use of the full text version. This is indicated by the licence information on the White Rose Research Online record for the item.
Takedown
If you consider content in White Rose Research Online to be in breach of UK law, please notify us by
Modelling determinants of extinction across two Mesozoic
1
hyperthermal events
2
Alexander M. Dunhill
1, William J. Foster
2, Sandro Azaele
3, James Sciberras
4and
3
Richard J. Twitchett
54
1School of Earth and Environment, University of Leeds, Leeds LS2 9JT, UK
5
2Museum für Naturkunde, Leibniz-Institut für Evolutions- und Biodiversitätsforschung, Berlin,
6
Deutschland
7
3School of Mathematics, University of Leeds, Leeds LS2 9JT, UK
8
4OnCorps, Exeter House, Lower Station Approach, Temple Means, Bristol, BS1 6QS, UK
9
5Department of Earth Sciences, Natural History Museum, London, SW7 5BD, UK
10
11
Author for correspondence: Alexander M. Dunhill
12
e-mail: [email protected]
13
The Late Triassic and early Toarcian extinction events are both associated with
15
greenhouse warming events triggered by massive volcanism. These Mesozoic
16
hyperthermals were responsible for the mass extinction of marine organisms and resulted
17
in significant ecological upheaval. It has, however, been suggested that these events
18
merely involved intensification of background extinction rates rather than significant
19
shifts in the macroevolutionary regime and extinction selectivity. Here, we apply a
20
multivariate modelling approach to a vast global database of marine organisms to test
21
whether extinction selectivity varied through the Late Triassic and Early Jurassic. We
22
show that these hyperthermals do represent shifts in the macroevolutionary regime and
23
record different extinction selectivity compared to background intervals of the Late
24
Triassic and Early Jurassic. The Late Triassic mass extinction represents a more
25
profound change in selectivity than the early Toarcian extinction but both events show a
26
common pattern of selecting against pelagic predators and benthic photosymbiotic and
27
suspension-feeding organisms, suggesting that these groups of organisms may be
28
particularly vulnerable during episodes of global warming. In particular, the Late
29
Triassic extinction represents a macroevolutionary regime change that is characterised
30
by (i) the change in extinction selectivity between Triassic background intervals and the
31
extinction event itself; and (ii) the differences in extinction selectivity between the Late
32
Triassic and Early Jurassic as a whole.
33
34
Key words: mass extinction, palaeoecology, modelling, Mesozoic, hyperthermal
35
1. Introduction
37
The Late Triassic to Early Jurassic interval contains two major extinction events: the Late
38
Triassic mass extinction (LTE; c.201Ma) [1] and the early Toarcian extinction (EToE;
39
c.187Ma) [2]. The LTE is recognised as the second largest marine biodiversity loss [3] and
40
third biggest ecological crisis of the Phanerozoic [4], resulting in a global reef crisis [5], the
41
most severe extinction of scleractinian corals [6, 7], significant extinctions amongst
42
ammonoids [8], bivalves [9] and marine vertebrates [10], and the final demise of the conodonts
43
[11]. By comparison, the EToE was smaller in magnitude, but records a similar pattern of
44
selective losses, with an associated reef crisis [5], high levels of extinction amongst bivalves
45
[12] and ammonoids [13], and the collapse of both benthic and pelagic marine ecosystems [7,
46
8]. Both of these events are associated with, and likely caused by, elevated atmospheric CO
247
levels and global warming [14-21]; i.e. they are hyperthermals. In each case, eruptions of Large
48
Igneous Provinces (LIPs) probably caused the rise in CO
2[18, 20-25], with proposed extinction
49
drivers including rapid warming [14-17, 20, 26], ocean anoxia [16, 17, 26], and ocean
50
acidification [27-29] as a direct result of the volcanic greenhouse gas emissions.
51
Several biological and ecological traits appear to have been selected against during the
52
LTE, such as possessing a heavily calcified skeleton [27], inhabiting reef and/or inshore
53
environments [30, 31], and residing at tropical latitudes [31, 32]. The greatest reduction in both
54
taxonomic and functional richness occurred amongst sessile suspension-feeding guilds,
55
particularly those dwelling in tropical reefs in the Panthalassa Ocean [31]. Despite this
56
evidence for apparent selectivity during the LTE hyperthermal, it has been claimed that there
57
was little change in
“
macroevolutionary regime
”
[30] compared to the rest of the Late Triassic
58
and Early Jurassic, and that the LTE simply reflects intensification of the high rates of
59
background extinction already experienced through the Late Triassic [30, 33, 34]. There has
60
been less research on selectivity during the EToE hyperthermal, although there is some
evidence for loss of reef taxa [5], selection against endemic taxa [12], the motile benthos [35],
62
infaunal organisms [12, 17, 35, 36], as well as higher levels of extinction in the restricted basins
63
of northwest Tethys, northeast Panthalassa [35], and the Boreal Ocean [2, 36] as well as in the
64
southern hemisphere [37]. Whether this represents a macroevolutionary regime shift compared
65
to Jurassic background extinction is unknown.
66
Here, we provide the first multivariate analysis of ecological selectivity during the Late
67
Triassic and Early Jurassic, in order to determine whether there are any substantial differences
68
between the LTE and EToE hyperthermal events and the periods of normal background
69
extinction, and hence whether a shift in macroevolutionary regime occurred. A
70
macroevolutionary regime shift is recognised when the suite of traits that promote extinction
71
or survivorship are different, and particularly when the direction of selectivity changes so that
72
traits that conferred survivorship during background times become an extinction risk [38]. We
73
apply a generalised linear modelling (GLM) methodology to the largest and most
74
comprehensive global database yet analysed in order to assess the relative importance of a
75
number of intrinsic and extrinsic ecological variables as determinants of extinction in marine
76
ecosystems. We aim to test the following hypotheses: (i) do certain ecological variables (e.g.
77
latitudinal distribution, habitat preference, feeding mode and calcification) correlate with
78
higher extinction risk during the LTE and EToE hyperthermal events; (ii) are similar trends
79
recorded in both past hyperthermals despite differences in starting conditions and magnitude;
80
and (iii) are similar trends recorded during background times, or do the LTE and EToE
81
hyperthermals represent significantly different extinction selectivity?
82
83
2. Methods
84
We utilised a database of fossil occurrences of Middle Triassic to Middle Jurassic
(Ladinian-85
Aalenian) marine animal genera collated from the Paleobiology Database (PaleoDB) [39, 40].
The total dataset comprises 55,428 occurrences of 2,621 genera, which is more than double the
87
number that was available for previous analyses, e.g. [30, 32]. Each genus was then classified
88
according to a number of extrinsic (i.e. abiotic) and intrinsic (i.e. biotic) ecological variables:
89
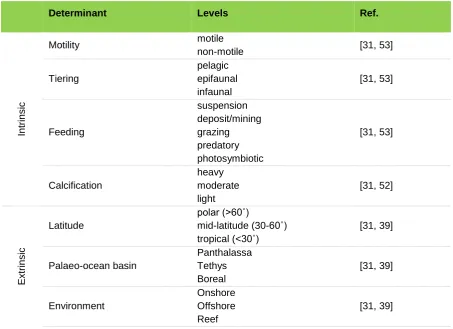
(Table 1; see [31] for detailed download, vetting, and classification information). Proportional
90
generic extinction rates were calculated and plotted at the stage level for guilds of fossil
91
organisms defined by each ecological variable (Table 1). In order to account for biases brought
92
about by uneven sampling across space and through time, we applied a subsampling protocol
93
to standardize proportional extinction on the basis of the number of fossil occurrences. All
94
variables were subsampled to n = 250 per stage, for 1000 iterations apart from feeding, which
95
was subsampled to n = 75, due to the increased number of variable arguments and thus reduced
96
sample sizes after splitting occurrences via feeding mode. Lightly calcified taxa, polar latitude,
97
boreal ocean and reef taxa all fall short of the subsampling requirement for at least one of the
98
time bins and are, therefore, not plotted in the univariate time series. However, when
99
amalgamated with the other variables for the multivariate analyses, they provide sample sizes
100
that are sufficient for the GLM analyses.
101
Multiple ecological variables are not independent of one another in terms of
102
proportional extinction through time, therefore it is essential to test their effects on extinction
103
within a multivariate framework. For example, pelagic taxa within the database are
104
predominantly predatory and fast-moving as the majority of pelagic taxa are vertebrates or
105
cephalopods. Therefore, it is impossible to determine which, if any, of these three variables is
106
influencing extinction rates in a univariate analysis. We applied GLMs with a binomial
107
distribution and a logit link function (i.e. multiple logistic regression models) to test the effects
108
of multiple ecological variables on proportional generic extinction through the study interval
109
[41]. The major extinction episodes of the LTE (Rhaetian/Hettangian) and EToE
110
(Pliensbachian/Toarcian) were analysed separately and compared to the other stage boundaries
which, together, are treated as representing the background intervals of the Triassic and
112
Jurassic. However, because the binomial models were strongly underdispersed, we then used
113
quasibinomial models and estimated the dispersion parameter from the data [42].
114
Underdispersal, where the variance is less than the nominal mean [43], can lead to
over-115
conservatism and thus can result in type II errors. We applied the GLMs to two datasets: (i)
116
including all the ecological variables, and (ii) a separate dataset compiled without the
117
depositional setting variable, because reliable depositional setting data only exist for around
118
50% of the fossil occurrences in the entire data set. A number of model runs were carried out
119
with different variable combinations for each of the four broad time intervals: Triassic
120
background (Ladinian-Carnian, Carnian-Norian, Norian-Rhaetian); LTE
(Rhaetian-121
Hettangian); Jurassic background (Hettangian-Sinemurian, Sinemurian-Pliensbachian,
122
Toarcian-Aalenian); and EToE (Pliensbachian-Toarcian). Model selection was carried out by
123
using the drop1() command in R, which drops one explanatory variable in turn and each time
124
applies an analysis of deviance test (F-test) [41]. The data for the GLMs were not subsampled,
125
but any ecological guilds with consistently low sample sizes (<10 occurrences per bin) were
126
omitted from the analyses. All analyses were carried in R v.3.4.3 [44].
127
128
3. Results
129
(a) Univariate time series analysis
130
The data show clear differences in extinction magnitude and selectivity between the
131
hyperthermals and background intervals (Figure 1). For many, but not all variables (e.g.
132
infaunal taxa at EToE, moderate calcifiers at LTE, mid-latitude taxa at LTE), extinction
133
magnitude is greater during the hyperthermals than during their respective background times,
134
as expected, and the pattern of relative selectivity remains the same (e.g. Figure 1A, B). During
135
the LTE, however, feeding, calcification, latitude and ocean basin all record different patterns
of selectivity compared to the Triassic background (Figures 1C-F). Photosymbiotic taxa
137
suffered a substantially greater extinction during the LTE than during Triassic background
138
periods, overtaking suspension- and deposit-feeders in relative extinction risk (Figure 1C).
139
Likewise, heavily calcified taxa and those that live in the tropics and Panthalassa record the
140
greatest extinction magnitudes during the LTE hyperthermal, which represents a marked shift
141
in selectivity compared to the Triassic background (Fig. 1D-F). In contrast, the only similar
142
shift in selectivity during the EToE, compared to the Jurassic background, occurs with latitude,
143
with mid-latitude taxa showing greater extinction risk than tropical taxa during the
144
hyperthermal (Figure 1E). With a few exceptions, remaining variables all increase during the
145
EToE event, suggesting the event mainly represents an intensification of Jurassic background
146
extinction rates.
147
Unexpectedly, there also appear to be clear differences in background extinction
148
magnitude and selectivity between the Triassic and Jurassic. Background extinction appears
149
much higher during the Triassic than the Jurassic, with extinction magnitude in some guilds
150
being higher during the Triassic background intervals than during the EToE (Figure 1).
151
152
(b) Generalised linear modelling
153
Multivariate analyses demonstrate clear differences between background and mass extinction
154
intervals (see Table 2 for GLM results). In general, the suite of ecological variables (see Table
155
1) analysed in this study explain far less of the recorded extinction during background times
156
compared to the two hyperthermal events. During the Triassic background interval,
157
depositional setting is the only significant predictor of extinction, and only in the single model
158
that considers just the set of extrinsic factors. This is due to reef taxa having significantly lower
159
extinction risk than taxa that live in other settings. During the Jurassic background interval,
160
when all ecological variables are considered, motility, palaeo-ocean basin, and depositional
setting are all significant predictors of extinction, with pelagic taxa and taxa residing in the
162
Tethys Ocean having higher extinction and reef dwellers having lower extinction. The best
163
fitting model identifies only palaeo-ocean (i.e. Tethys) and depositional setting (reefs) as being
164
significant predictors of extinction. The only other model run that identifies a significant
165
predictor of extinction is the one that considers just the extrinsic ecological variables. In that
166
case, palaeo-oceanic basin is again identified as having a significant bearing on extinction, due
167
to the higher extinction in Tethys. In contrast to the background times, during the LTE and
168
EToE events, many more model runs identify significant ecological predictors of extinction.
169
Furthermore, those variables that are identified as being significant are different to the ones
170
identified during the background times.
171
During the LTE, feeding or latitude are the only variables identified as being significant
172
predictors of extinction. Latitude alone significantly predicts extinction when (a) all ecological
173
variables are considered and (b) when only extrinsic factors are considered, using the smaller
174
dataset that includes depositional setting. In each case, taxa residing at tropical latitudes show
175
significantly higher extinction than those inhabiting higher latitudes. In contrast, feeding is
176
identified as a significant predictor of extinction in two other model runs, but only using the
177
expanded dataset that excludes depositional setting. In both cases, where (a) all variables or (b)
178
just the intrinsic ones are considered, excluding depositional setting, the best-fitting models
179
identify predatory, photosymbiotic and suspension-feeding habits as being significant positive
180
predictors of extinction.
181
For the EToE event, significant predictors of extinction are only identified in model
182
runs that utilise the expanded dataset that excludes depositional setting. When all variables,
183
apart from depositional setting, are considered, five factors (motility, feeding, latitude,
palaeo-184
ocean basin and calcification) all appear to significantly predict extinction. Model selection
185
reveals that the best-fitting model identifies just feeding and palaeo-ocean basin, with
photosymbiotic taxa and taxa residing in the Boreal Ocean predicting significantly higher
187
extinction than other categories within those variables. When considering just the extrinsic
188
ecological variables, no variable predicts extinction. However, when we use the expanded data
189
set with no depositional environment data, palaeo-ocean basin significantly predicts extinction
190
with Boreal taxa having higher extinction and, after model selection, Panthalassa taxa show
191
lower extinction than both Boreal and Tethys taxa. When considering only the intrinsic
192
ecological variables, no variable predicts extinction until we use the expanded data set with no
193
depositional environment variable, after which, feeding significantly predicts extinction, with
194
photosymbiotic taxa showing higher extinction than other feeding guilds.
195
196
4. Discussion
197
There are marked changes in extinction selectivity between periods of normal background and
198
the two hyperthermals (Figure 1; Table 2). Extinction magnitude is higher in most ecological
199
guilds during the LTE and, although the EToE generally displays higher levels of extinction
200
than Jurassic background intervals, for some guilds Triassic background extinction is higher
201
than it is during the EToE (Figure 1). Not only do the LTE and EToE events represent an
202
increase in extinction intensity above respective Triassic and Jurassic background rates but,
203
more importantly, and contrary to previous claims [30], there are stark differences in extinction
204
selectivity between times of both background and mass extinction, and between Triassic and
205
Jurassic intervals in general. It is also evident that background extinction was higher in the Late
206
Triassic, prior to the LTE hyperthermal, than it was during the Early Jurassic, in the aftermath
207
of the mass extinction [30, 33] (Figure 1).
208
A tropical extinction peak characterises the LTE, whereas mid-latitude taxa display
209
higher extinction during the EToE and during background times. Although the LTE data are
210
consistent with expectations that an episode of global warming should result in extinction being
concentrated in the tropics [32, 45], the EToE data suggest that high tropical extinction may
212
not be ubiquitous to all hyperthermal events. Additionally, higher tropical extinction across the
213
LTE is only significant in the models where the data are also partitioned by depositional setting,
214
suggesting that some of the tropical extinction signal is rooted in a particular depositional
215
setting, most probably tropical reefs. Although extinction is higher in the mid-latitudes through
216
the EToE [31], latitude does not significantly predict extinction, suggesting that the higher rates
217
of extinction in the mid-latitudes during the EToE may be governed by other factors such as
218
ocean basin or that the warming was not as intense as during the LTE [2].
219
The peak in extinction in Panthalassa during the LTE is not replicated in the Tethys
220
Ocean, despite the Tethys showing higher background extinction rates. However, modelling
221
does not show palaeo-ocean as a significant predictor of extinction across the LTE, suggesting
222
that this peak is a result of other factors, such as the high proportion of tropical data in
Rhaetian-223
Hettangian Panthalassa. In contrast, Panthalassa displays significantly lower extinction than
224
the Tethys and Boreal oceans during the EToE. The EToE appears to be characterised by raised
225
extinction rates in the Tethyan and Boreal Oceans. This might be expected given the higher
226
prevalence of restricted basins, particularly in north-western Tethys, when considering the
227
repeated dysoxic conditions in the Early Jurassic, of which the EToE is the most severe [2, 26].
228
However, this pattern persists in light of evidence for prolonged anoxia and extinction in some
229
Panthalassa basins [35]. It is also likely that the mid to high palaeolatitude of the Boreal and
230
north-western Tethys basins of Europe are driving the mid-latitudinal peak in extinction
231
intensity through the EToE.
232
Although difficult to show because of very small sample sizes, the reef crises at the
233
LTE and EToE are evident in the data by the crashes in reef taxa abundances [31] and diversity
234
[7, 31]. The reef crises are also highlighted by the high levels of extinction witnessed amongst
235
photosymbiotic taxa and suspension feeders across the LTE, and photosymbiotic taxa across
the EToE. In contrast to the extinction events, background extinction for reef taxa and
237
photosymbiotic feeders was lower than those taxa residing in other depositional settings and
238
feeding via different strategies. This highlights a major change in extinction selectivity during
239
both the LTE and EToE and permits the rejection of the idea that the LTE is merely an
240
intensification of background extinction seen during the Late Triassic [30].
241
Tiering does not appear to have an influence on extinction selectivity across the LTE,
242
despite there being an increase in extinction magnitude across all guilds. However, the impact
243
of the mass extinction on level-bottom communities was particularly short-lived with full
244
recovery occurring by the upper Hettangian [46-48]. Therefore, the temporary disappearance
245
of the deep infaunal and erect benthic tiers in the earliest Hettangian recorded by previous
246
studies [46, 48], would not be detected here because of the coarser nature of the stage-level
247
time bins. There is some evidence of increased extinction risk to pelagic taxa during intervals
248
of background and mass extinction, possibly related to high turnover of ammonoids and
249
vertebrates, which also drives the consistently high levels of extinction in predatory taxa [13,
250
49]. We see a similar pattern in terms of motility, with no apparent selectivity across the LTE
251
or during periods of background extinction. There is some weak evidence for selectivity against
252
non-motile taxa across the EToE, although this is not significant in the best-fitting model. The
253
lack of any selectivity against non-motile and epifaunal taxa across the LTE suggests that the
254
mass extinction did not result in an indirect intensification of the Mesozoic Marine Revolution
255
(MMR) as previously suggested [31] and these previously detected high levels of extinction
256
amongst
non-motile
epifauna
are
a
result
of
elevated
extinction
amongst
257
photosymbiotic/suspension feeding guilds in reef environments, which are predominantly
non-258
motile and epifaunal. Our analyses do detect higher levels of background extinction amongst
259
non-motile and epifaunal taxa during the Late Triassic compared to the Early Jurassic.
260
Crucially, however, motility and tiering do not predict extinction in the Late Triassic
background interval. Therefore, we cannot find solid evidence of selectivity against non-motile
262
epifauna during a time period (Carnian-Norian) that has been identified as key to the MMR
263
[50]. The cause of higher Triassic background extinction versus Jurassic background extinction
264
is likely a result of the high faunal turnover associated with the Carnian Pluvial Event [51],
265
rather than the MMR.
266
There is a peak in extinction amongst heavily calcified taxa during the LTE whereas
267
during background periods and the EToE heavy calcifiers display lower extinction than
268
moderate calcifiers. Although this may support the hypotheses that hypercapnia [52] and/or
269
ocean acidification may have played a role in extinction during the LTE [5, 27], our modelling
270
results show no evidence that calcification was a significant predictor of extinction during
271
either the LTE or the EToE hyperthermal. The multivariate analyses show no evidence of
272
selectivity against heavy calcifiers during the LTE and only very weak evidence at the EToE,
273
although this result is non-significant in the best-fitting model. Our analyses support previous
274
studies that found no strong link between calcification grade and extinction selectivity [30].
275
Therefore, it seems unlikely that hypercapnia or ocean acidification were the main or sole
276
drivers of extinction during the LTE and EToE hyperthermals.
277
The LTE and, albeit to a lesser extent, the EToE are both characterised by marked shifts
278
in extinction selectivity away from the macroevolutionary regimes of the Late Triassic and
279
Early Jurassic background intervals. Background extinction rates in the Late Triassic were
280
higher than those of the Early Jurassic [30, 33], but the LTE was not merely an intensification
281
of those background rates as has been previously suggested [30]. Extinction selectivity changed
282
dramatically across the LTE with the initiation of strong selection against tropical taxa with
283
photosymbiotic, suspension or predatory feeding strategies. This pattern is consistent with a
284
warming-driven tropical reef crisis. We find little evidence to support previous ideas that
285
palaeo-ocean basin [31] or calcification [27] were important determinants of extinction at the
LTE. Despite differences in starting conditions, species involved, and magnitudes of global
287
warming and environmental change, the LTE and EToE show some common patterns of
288
selectivity. Both events record strong extinction selectivity against pelagic predatory guilds
289
and against benthic photosymbiotic and suspension feeding organisms, suggesting that these
290
groups of marine organisms may be particularly vulnerable during episodes of global warming.
291
The effects of the LTE were most severe in the tropics whilst the EToE was felt more severely
292
at higher latitudes, which may reflect differences in magnitude of environmental change or
293
starting conditions, such as palaeogeography. However, the EToE shares some common
294
selectivity patterns with periods of Jurassic background extinction, i.e. high extinction in the
295
Tethys Ocean, suggesting that the EToE may have represented an intensification of Jurassic
296
background extinction, albeit with a switch to selecting against reef inhabiting photosymbiotic
297
taxa. The LTE shows a clear change in extinction selectivity and thus macroevolutionary
298
regime which is characterised not only by a shift in extinction selectivity from Triassic
299
background intervals across the LTE but also by the difference in extinction selectivity between
300
the Late Triassic and Early Jurassic as a whole.
301
302
Data accessibility. The data set used in the statistical analyses and the statistical results are
303
available in the Dryad Digital Repository: doi:10.5061/dryad.6t461hq).
304
Author’s contributions.
A.M.D., W.J.F. and R.J.T. conceived the study. A.M.D. and W.J.F.
305
collected the data. S.A and J.S. wrote analytical code and advised on analytical methods.
306
A.M.D. analysed the data. A.M.D. led the writing of the manuscript and W.J.F., S.A. and
307
R.J.T. contributed to the writing and editing of the manuscript and preparation of figures.
308
Competing interests. We declare we have no competing interests.
Funding. Funding for this work was provided by a Leverhulme Early Career Fellowship
310
(ECF-2015-044) and Natural Environmental Research Council research grant
311
(NE/P013724/1) to AMD.
312
Acknowledgements. The authors thank Xiaoya Ma, Matthew Clapham and four anonymous
313
reviewers for helpful editorial and analytical reviews that have greatly improved this
314
manuscript. The authors also thank the numerous authors of the original studies that provide
315
the source data on which this study is based, and the many data enterers of the Paleobiology
316
Database for the provision of fossil occurrence data, particularly: Matthew Clapham,
317
Wolfgang Kiessling, Franz Fürsich, Martin Aberhan, Andy Rees, József Pálfy, Matthew
318
Carrano, David Bottjer, Alistair McGowan, Arnold Miller, Luc Villier, Roger Benson, John
319
Alroy, and Richard Butler. This is Paleobiology Database publication ###.
320
321
References
322
[1] Lindström, S., van de Schootbrugge, B., Hansen, K.H., Pedersen, G.K., Alsen, P.,
323
Thibault, N., Dybkjær, K., Bjerrum, C.J. & Nielsen, L.H. 2017 A new correlation of
324
Triassic
–
Jurassic boundary successions in NW Europe, Nevada and Peru, and the
325
Central Atlantic Magmatic Province: A time-line for the end-Triassic mass extinction.
326
Palaeogeography, Palaeoclimatology, Palaeoecology 478, 80-102.
327
(doi:https://doi.org/10.1016/j.palaeo.2016.12.025).
328
[2] Little, C.T. & Benton, M.J. 1995 Early Jurassic mass extinction: A global long-term
329
event. Geology 23, 495-498.
330
[3] Alroy, J. 2010 The shifting balance of diversity among major marine animal groups.
331
Science 329, 1191-1194.
[4] McGhee, G.R., Sheehan, P.M., Bottjer, D.J. & Droser, M.L. 2004 Ecological ranking of
333
Phanerozoic biodiversity crises: ecological and taxonomic severities are decoupled.
334
Palaeogeography, Palaeoclimatology, Palaeoecology 211, 289-297.
335
[5] Kiessling, W. & Simpson, C. 2011 On the potential for ocean acidification to be a general
336
cause of ancient reef crises. Global Change Biology 17, 56-67.
(doi:10.1111/j.1365-337
2486.2010.02204.x).
338
[6] Flügel, E. 2002 Triassic reef patterns. SEPM Special Publication 72, 391-463.
339
[7] Martindale, R.C., Berelson, W.M., Corsetti, F.A., Bottjer, D.J. & West, A.J. 2012
340
Constraining carbonate chemistry at a potential ocean acidification event (the
341
Triassic-Jurassic boundary) using the presence of corals and coral reefs in the fossil
342
record. Palaeogeography Palaeoclimatology Palaeoecology 350, 114-123.
343
(doi:10.1016/j.palaeo.2012.06.020).
344
[8] House, M.R. 1989 Ammonoid extinction events. Philosophical Transactions of the Royal
345
Society of London. B, Biological Sciences 325, 307-326.
346
(doi:10.1098/rstb.1989.0091).
347
[9] Ros, S. & Echevarría, J. 2012 Ecological signature of the end-Triassic biotic crisis: what
348
do bivalves have to say? Historical Biology 24, 489-503.
349
(doi:10.1080/08912963.2011.625568).
350
[10] Benson, R.B.J., Butler, R.J., Lindgren, J. & Smith, A.S. 2010 Mesozoic marine tetrapod
351
diversity: mass extinctions and temporal heterogeneity in geological megabiases
352
affecting vertebrates. Proceedings of the Royal Society B 277, 829-834.
353
[11] Bond, D.P.G. & Grasby, S.E. 2017 On the causes of mass extinctions. Palaeogeography,
354
Palaeoclimatology, Palaeoecology 478, 3-29.
355
(doi:https://doi.org/10.1016/j.palaeo.2016.11.005).
[12] Aberhan, M. & Baumiller, T.K. 2003 Selective extinction among Early Jurassic
357
bivalves: A consequence of anoxia. Geology 31, 1077-1080. (doi:10.1130/G19938.1).
358
[13] Dera, G., Neige, P., Dommergues, J.-L., Fara, E., Laffont, R. & Pellenard, P. 2010
High-359
resolution dynamics of Early Jurassic marine extinctions: the case of Pliensbachian
–
360
Toarcian ammonites (Cephalopoda). Journal of the Geological Society 167, 21-33.
361
(doi:10.1144/0016-76492009-068).
362
[14] McElwain, J.C., Beerling, D.J. & Woodward, F.I. 1999 Fossil plants and global warming
363
at the Triassic-Jurassic Boundary. Science 285, 1386-1390.
364
[15] McElwain, J.C., Wade-Murphy, J. & Hesselbo, S.P. 2005 Changes in carbon dioxide
365
during an oceanic anoxic event linked to intrusion into Gondwana coals. Nature 435,
366
479-482.
367
(doi:http://www.nature.com/nature/journal/v435/n7041/suppinfo/nature03618_S1.htm
368
l).
369
[16] Danise, S., Twitchett, R.J. & Little, C.T.S. 2015 Environmental controls on Jurassic
370
marine ecosystems during global warming. Geology 43, 263-266.
371
(doi:10.1130/g36390.1).
372
[17] Danise, S., Twitchett, R.J., Little, C.T.S. & Clémence, M.-E. 2013 The Impact of Global
373
Warming and Anoxia on Marine Benthic Community Dynamics: an Example from
374
the Toarcian (Early Jurassic). PLoS ONE 8, e56255.
375
(doi:10.1371/journal.pone.0056255).
376
[18] Schaller, M.F., Wright, J.D. & Kent, D.V. 2011 Atmospheric PCO
2Perturbations
377
Associated with the Central Atlantic Magmatic Province. Science 331, 1404-1409.
378
(doi:10.1126/science.1199011).
[19] Blackburn, T.J., Olsen, P.E., Bowring, S.A., McLean, N.M., Kent, D.V., Puffer, J.,
380
McHone, G., Rasbury, E.T. & Et-Touhami, M. 2013 Zircon U-Pb Geochronology
381
Links the End-Triassic Extinction with the Central Atlantic Magmatic Province.
382
Science 340, 941-945. (doi:10.1126/science.1234204).
383
[20] Whiteside, J., Olsen, P.E., Eglinton, T., Brookfield, M.E. & Sambrotto, R.N. 2010
384
Compound-specific carbon isotopes from Earth's largest flood basalt eruptions
385
directly linked to the end-Triassic mass extinction. PNAS 107, 6721-6725.
386
[21] Ruhl, M., Bonis, N.R., Reichart, G.-J., Damsté, J.S.S. & Kürschner, W.M. 2011
387
Atmospheric Carbon Injection Linked to End-Triassic Mass Extinction. Science 333,
388
430-434. (doi:10.1126/science.1204255).
389
[22] Burgess, S.D., Bowring, S.A., Fleming, T.H. & Elliot, D.H. 2015 High-precision
390
geochronology links the Ferrar large igneous province with early-Jurassic ocean
391
anoxia and biotic crisis. Earth and Planetary Science Letters 415, 90-99.
392
(doi:https://doi.org/10.1016/j.epsl.2015.01.037).
393
[23] Davies, J.H.F.L., Marzoli, A., Bertrand, H., Youbi, N., Ernesto, M. & Schaltegger, U.
394
2017 End-Triassic mass extinction started by intrusive CAMP activity. Nature
395
Communications 8, 15596. (doi:10.1038/ncomms15596
396
https://www.nature.com/articles/ncomms15596#supplementary-information).
397
[24] Corso, J.D., Marzoli, A., Tateo, F., Jenkyns, H.C., Bertrand, H., Youbi, N., Mahmoudi,
398
A., Font, E., Buratti, N. & Cirilli, S. 2014 The dawn of CAMP volcanism and its
399
bearing on the end-Triassic carbon cycle disruption. Journal of the Geological Society
400
171, 153-164. (doi:10.1144/jgs2013-063).
[25] Heimdal, T.H., Svensen, H.H., Ramezani, J., Iyer, K., Pereira, E., Rodrigues, R., Jones,
402
M.T. & Callegaro, S. 2018 Large-scale sill emplacement in Brazil as a trigger for the
403
end-Triassic crisis. Sci Rep 8, 141. (doi:10.1038/s41598-017-18629-8).
404
[26] Caruthers, A.H., Smith, P.L. & Gröcke, D.R. 2014 The Pliensbachian
–
Toarcian (Early
405
Jurassic) extinction: A North American perspective. Geological Society of America
406
Special Papers 505, 225-243. (doi:10.1130/2014.2505(11)).
407
[27] Hautmann, M., Benton, M.J. & Tomasovych, A. 2008 Catastrophic ocean acidification
408
at the Triassic-Jurassic boundary. N. Jb. Geol. Palaont. Abh. 249, 119-127.
409
[28] Trecalli, A., Spangenberg, J., Adatte, T., Föllmi, K.B. & Parente, M. 2012 Carbonate
410
platform evidence of ocean acidification at the onset of the early Toarcian oceanic
411
anoxic event. Earth and Planetary Science Letters 357, 214-225.
412
(doi:https://doi.org/10.1016/j.epsl.2012.09.043).
413
[29] Hautmann, M. 2004 Effect of end-Triassic CO
2maximum on carbonate sedimentation
414
and marine mass extinction. Facies 50, 257-261. (doi:10.1007/s10347-004-0020-y).
415
[30] Kiessling, W., Aberhan, M., Brenneis, B. & Wagner, P.J. 2007 Extinction trajectories of
416
benthic organisms across the Triassic
–
Jurassic boundary. Palaeogeography,
417
Palaeoclimatology, Palaeoecology 244, 201-222. (doi:10.1016/j.palaeo.2006.06.029).
418
[31] Dunhill, A.M., Foster, W.J., Sciberras, J. & Twitchett, R.J. 2018 Impact of the Late
419
Triassic mass extinction on functional diversity and composition of marine
420
ecosystems. Palaeontology 61, 133-148. (doi:10.1111/pala.12332).
421
[32] Kiessling, W. & Aberhan, M. 2007 Environmental determinants of marine benthic
422
biodiversity dynamics through Triassic-Jurassic time. Paleobiology 33, 414-434.
423
[33] Bambach, R.K. 2006 Phanerozoic biodiversity and mass extinctions. Annual Review of
424
Earth and Planetary Sciences 34, 127-155.
[34] Bambach, R.K., Knoll, A.H. & Wang, S.C. 2004 Origination, extinction, and mass
426
depletions of marine diversity. Paleobiology 30, 522-542.
(doi:10.1666/0094-427
8373(2004)030<0522:OEAMDO>2.0.CO;2).
428
[35] Martindale, R.C. & Aberhan, M. 2017 Response of macrobenthic communities to the
429
Toarcian Oceanic Anoxic Event in northeastern Panthalassa (Ya Ha Tinda, Alberta,
430
Canada). Palaeogeography, Palaeoclimatology, Palaeoecology 478, 103-120.
431
(doi:http://dx.doi.org/10.1016/j.palaeo.2017.01.009).
432
[36] Harries, P.J. & Little, C.T.S. 1999 The early Toarcian (Early Jurassic) and the
433
Cenomanian
–
Turonian (Late Cretaceous) mass extinctions: similarities and contrasts.
434
Palaeogeography, Palaeoclimatology, Palaeoecology 154, 39-66.
435
(doi:https://doi.org/10.1016/S0031-0182(99)00086-3).
436
[37] Al-Suwaidi, A.H., Angelozzi, G.N., Baudin, F., Damborenea, S.E., Hesselbo, S.P.,
437
Jenkyns, H.C., Manceñido, M.O. & Riccardi, A.C. 2010 First record of the Early
438
Toarcian Oceanic Anoxic Event from the Southern Hemisphere, Neuquén Basin,
439
Argentina. Journal of the Geological Society 167, 633-636.
(doi:10.1144/0016-440
76492010-025).
441
[38] Jablonski, D. 1986 Background and Mass Extinctions: The Alternation of
442
Macroevolutionary Regimes. Science 231, 129-133.
443
(doi:10.1126/science.231.4734.129).
444
[39] Clapham, M.E., Kiessling, W., Fürsich, F., Aberhan, M., Rees, A., Pálfy, J., Carrano,
445
M.T., Bottjer, D.B., McGowan, A.J., Miller, A.I., et al. 2016 Taxonomic occurrences
446
of Triassic to Jurassic marine animals. Palaeobiology Database, accessed 13 April
447
2016, http://paleobiodb.org
[40] Dunhill, A.M., Sciberras, J., Foster, W.J. & Twitchett, R.J. 2018 Data from: Functional
449
diversity of marine ecosystems across the Late Triassic mass extinction. Dryad Data
450
Repositary. https://doi.org//10.5061/dryad.bg30k
451
[41] Zuur, A.F., Ieno, E.N., Walker, N., J., Saveliev, A.A. & Smith, G.M. 2009 Mixed Effects
452
Models and Extensions in Ecology with R. New York, Springer.
453
[42] McCullagh, P. & Nelder, J. 1989 Generalized linear models. (p. 511. New York,
454
Chapman and Hall.
455
[43] Hilbe, J.M. 2011 Negative binomial regression, Cambridge University Press.
456
[44] R Development Core Team. 2017. R: A language and environment for statistical
457
computing. v 3.4.3. The R Foundation for Statistical Computing, Vienna, Austria.
458
ISBN 3-900051-07-0, URL http://www.R-project.org/.
459
[45] Van de Schootbrugge, B. & Wignall, P.B. 2016 A tale of two extinctions: converging
460
end-Permian and end-Triassic scenarios. Geological Magazine 153, 332-354.
461
(doi:10.1017/s0016756815000643).
462
[46] Barras, C.G. & Twitchett, R.J. 2007 Response of the marine infauna to Triassic-Jurassic
463
environmental change: Ichnological data from southern England. Palaeogeography,
464
Palaeoclimatology, Palaeoecology 244, 223-241.
465
[47] Hautmann, M., Stiller, F., Huawei, C. & Jingeng, S. 2008 Extinction-Recovery Pattern
466
of Level-Bottom Faunas Across the Triassic-Jurassic Boundary in Tibet: Implications
467
for Potential Killing Mechanisms. PALAIOS 23, 711-718.
468
(doi:10.2110/palo.2008.p08-005r).
469
[48] Mander, L., Twitchett, R.J. & Benton, M.J. 2008 Palaeoecology of the Late Triassic
470
extinction event in the SW UK. Journal of the Geological Society, London 165,
319-471
332.
[49] Thorne, P.M., Ruta, M. & Benton, M.J. 2011 Resetting the evolution of marine reptiles
473
at the Triassic-Jurassic boundary. Proceedings of the National Academy of Sciences
474
108, 8339-8344. (doi:10.1073/pnas.1018959108).
475
[50] Tackett, L.S. & Bottjer, D.J. 2016 Paleoecological succession of Norian (Late Triassic)
476
benthic fauna in eastern Panthalassa (Luning and Gabbs formations, west-central
477
Nevada). PALAIOS, 190-202. (doi:10.2110/palo.2015.070).
478
[51] Dal Corso, J., Gianolla, P., Newton, R.J., Franceschi, M., Roghi, G., Caggiati, M.,
479
Raucsik, B., Budai, T., Haas, J. & Preto, N. 2015 Carbon isotope records reveal
480
synchronicity between carbon cycle perturbation and the “Carnian Pluvial Event” in
481
the Tethys realm (Late Triassic). Global and Planetary Change 127, 79-90.
482
(doi:http://dx.doi.org/10.1016/j.gloplacha.2015.01.013).
483
[52] Knoll, A.H., Bambach, R.K., Payne, J.L., Pruss, S. & Fischer, W.W. 2007
484
Paleophysiology and end-Permian mass extinction. Earth and Planetary Science
485
Letters 256, 295-313. (doi:https://doi.org/10.1016/j.epsl.2007.02.018).
486
[53] Bambach, R.K., Bush, A.M. & Erwin, D.H. 2007 Autecology and the filling of
487
ecospace: Key metazoan radiations. Palaeontology 50, 1-22.
(doi:10.1111/j.1475-488
4983.2006.00611.x).
489
491
Table 1. Summary of intrinsic and extrinsic ecological determinants of extinction.
Determinant Levels Ref.
Int
ri
ns
ic
Motility motile
non-motile [31, 53]
Tiering
pelagic epifaunal infaunal
[31, 53]
Feeding
suspension deposit/mining grazing predatory photosymbiotic
[31, 53]
Calcification
heavy moderate light
[31, 52]
E
x
tr
ins
ic
Latitude
polar (>60˚)
mid-latitude (30-60˚) tropical (<30˚)
[31, 39]
Palaeo-ocean basin
Panthalassa Tethys Boreal
[31, 39]
Environment
Onshore Offshore Reef
[31, 39]
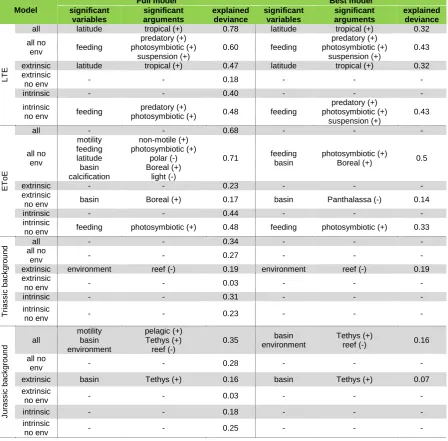
Table 2. Summary of full and best fitting GLMs for predicting extinction through hyperthermal mass extinctions and periods of background extinction. LTE = Late Triassic mass extinction;
EToE = early Toarcian extinction. “Full model” includes all variables (see electronic
supplementary material for model definitions). “Best model” is the best fitting model following model selection procedure described in methods section. “Significant variables” identifies
variables identified as significantly determining extinction; “significant arguments” identifies which arguments of a particular variables show significantly higher (+) or significantly lower (-) extinction than other arguments of that variables. “Explained deviance” = (null deviance -residual deviance)/null deviance; provides estimate of goodness-of-fit of model to extinction variable. Where no variables are listed, no variables significantly determine extinction.
Model
Full model Best model
significant variables significant arguments explained deviance significant variables significant arguments explained deviance L TE
all latitude tropical (+) 0.78 latitude tropical (+) 0.32 all no
env feeding
predatory (+) photosymbiotic (+)
suspension (+)
0.60 feeding
predatory (+) photosymbiotic (+)
suspension (+)
0.43 extrinsic latitude tropical (+) 0.47 latitude tropical (+) 0.32 extrinsic
no env - - 0.18 - - -
intrinsic - - 0.40 - - -
intrinsic
no env feeding
predatory (+)
photosymbiotic (+) 0.48 feeding
predatory (+) photosymbiotic (+) suspension (+) 0.43 E ToE
all - - 0.68 - - -
all no env motility feeding latitude basin calcification non-motile (+) photosymbiotic (+) polar (-) Boreal (+) light (-)
0.71 feeding basin
photosymbiotic (+)
Boreal (+) 0.5
extrinsic - - 0.23 - - -
extrinsic
no env basin Boreal (+) 0.17 basin Panthalassa (-) 0.14
intrinsic - - 0.44 - - -
intrinsic
no env feeding photosymbiotic (+) 0.48 feeding photosymbiotic (+) 0.33
Tr ias s ic b a c k g ro u n
d all no all - - 0.34 - - -
env - - 0.27 - - -
extrinsic environment reef (-) 0.19 environment reef (-) 0.19 extrinsic
no env - - 0.03 - - -
intrinsic - - 0.31 - - -
intrinsic
no env - - 0.23 - - -
J u ra s s ic b a c k g ro u n d all motility basin environment pelagic (+) Tethys (+) reef (-)
0.35 basin environment
Tethys (+)
reef (-) 0.16 all no
env - - 0.28 - - -
extrinsic basin Tethys (+) 0.16 basin Tethys (+) 0.07 extrinsic
no env - - 0.03 - - -
intrinsic - - 0.18 - - -
intrinsic
no env - - 0.25 - - -
493
Figure legends
495
Figure 1. Boxplots across all subsamples of proportional generic extinction per ecological
496
variable through Late Triassic background periods (Triassic), the Late Triassic mass extinction
497
(LTE), the early Toarcian extinction (EToE), and Early Jurassic background periods (Jurassic)
498
by (A) motility; (B) tiering; (C) feeding; (D) calcification; (E) latitude; (F) ocean basin; (G)
499
depositional setting. Proportional generic extinction is calculated from a subsample of n=250
500
across 1,000 iterations except for feeding which is calculated from a subsample of n=75 across
501
1,000 iterations. The solid black lines inside the boxes represent the medians, the top and
502
bottom edges of the boxes correspond to the first and third quartiles, and whiskers represent
503
the lowest and highest subsampled values within 1.5 times the interquartile range. Points
504
outside the whiskers are outliers.
p
ro
p
o
rt
io
n
a
l
g
e
n
e
ri
c
e
x
ti
n
c
ti
o
n
0
.2
0
.4
0
.6
0
.8
1
.0
Triassic
LTE
EToE Jurassic
motile
nonmotile
hyperthermals
p
ro
p
o
rt
io
n
a
l
g
e
n
e
ri
c
e
x
ti
n
c
ti
o
n
0
.0
0
.2
0
.4
0
.6
0
.8
1
.0
Triassic
LTE
EToE Jurassic
epifaunal
infaunal
pelagic
hyperthermals
p
ro
p
o
rt
io
n
a
l
g
e
n
e
ri
c
e
x
ti
n
c
ti
o
n
0
.0
0
.2
0
.4
0
.6
0
.8
1
.0
Triassic
LTE
EToE
Jurassic
predatory
suspension
deposit
photosymbiotic
grazing
hyperthermals
p
ro
p
o
rt
io
n
a
l
g
e
n
e
ri
c
e
x
ti
n
c
ti
o
n
0
.2
0
.4
0
.6
0
.8
1
.0
Triassic
LTE
EToE Jurassic
heavy
moderate
hyperthermals
p
ro
p
o
rt
io
n
a
l
g
e
n
e
ri
c
e
x
ti
n
c
ti
o
n
0
.3
0
.4
0
.5
0
.6
0
.7
0
.8
0
.9
1
.0
Triassic
LTE
EToE Jurassic
mid−latitude
tropical
hyperthermals
p
ro
p
o
rt
io
n
a
l
g
e
n
e
ri
c
e
x
ti
n
c
ti
o
n
0
.3
0
.4
0
.5
0
.6
0
.7
0
.8
0
.9
1
.0
Triassic
LTE
EToE Jurassic
Panthalassa
Tethys
hyperthermals
p
ro
p
o
rt
io
n
a
l
g
e
n
e
ri
c
e
x
ti
n
c
ti
o
n
0
.3
0
.4
0
.5
0
.6
0
.7
0
.8
0
.9
1
.0
Triassic
LTE
EToE Jurassic
Supplementary Material
Modelling determinants of extinction across two Mesozoic
hyperthermal events
Alexander M. Dunhill
1, William J. Foster
2, Sandro Azaele
3, James Sciberras
4and
Richard J. Twitchett
51School of Earth and Environment, University of Leeds, Leeds LS2 9JT, UK
2Museum für Naturkunde, Leibniz-Institut für Evolutions- und Biodiversitätsforschung, Berlin,
Deutschland3School of Mathematics, University of Leeds, Leeds LS2 9JT, UK
4Department of Biology and Biochemistry, University of Bath, Claverton Down, BA2 7AY, UK 5Department of Earth Sciences, Natural History Museum, London, SW7 5BD, UK
Supplementary methods
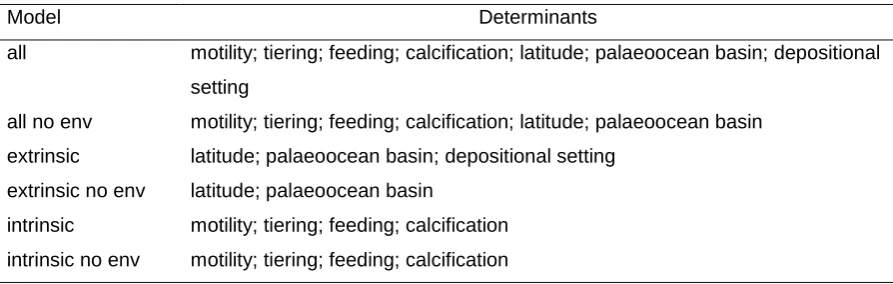
Table S1: List of variables in each GLM. “no env” refers to models run without depositional environmental setting data which is only present for around 50% of the data set. Therefore, the removal of the depositional environmental setting doubles the sample size.
Model Determinants
all motility; tiering; feeding; calcification; latitude; palaeoocean basin; depositional setting
all no env motility; tiering; feeding; calcification; latitude; palaeoocean basin extrinsic latitude; palaeoocean basin; depositional setting
extrinsic no env latitude; palaeoocean basin
Supplementary results
GLM outputs
LTE
Model = all
> GLM_LTE_A1ii <- glm(extinction ~ fMOTILITY + fTIERING + fFEEDING +
+ fLATITUDE + fBASIN + fENVIRONMENT +
+ fCALCIFICATION,
+ family = quasibinomial, data = LTE)
> summary(GLM_LTE_A1ii)
Call:
glm(formula = extinction ~ fMOTILITY + fTIERING + fFEEDING +
fLATITUDE + fBASIN + fENVIRONMENT + fCALCIFICATION, family =
quasibinomial,
data = LTE)
Deviance Residuals:
Min 1Q Median 3Q Max
-0.52039 -0.07450 0.00003 0.15316 0.55019
Coefficients: (1 not defined because of singularities)
Estimate Std. Error t value Pr(>|t|)
(Intercept) 2.6340 1.5901 1.656 0.1320
fMOTILITYnonmotile -0.6121 0.7194 -0.851 0.4170
fTIERINGinfaunal -1.0261 0.6461 -1.588 0.1468
fTIERINGpelagic -2.2947 1.8030 -1.273 0.2350
fFEEDINGphotosymbiotic 1.6102 2.0644 0.780 0.4554
fFEEDINGpredatory NA NA NA NA
fFEEDINGsuspension 0.7476 0.8971 0.833 0.4262
fLATITUDET 2.9924 1.1182 2.676 0.0254 *
fBASINTethys -0.9580 0.9703 -0.987 0.3493
fENVIRONMENTOffshore 1.1036 0.7170 1.539 0.1581
fENVIRONMENTReef 16.1132 3723.9890 0.004 0.9966
fCALCIFICATIONmoderate -1.7223 1.0296 -1.673 0.1287
---
(Dispersion parameter for quasibinomial family taken to be 0.1443989)
Null deviance: 6.1229 on 19 degrees of freedom
Residual deviance: 1.3575 on 9 degrees of freedom
AIC: NA
Number of Fisher Scoring iterations: 19
> # find best model
>
> drop1(GLM_LTE_A1ii, test = "F")
Single term deletions
Model:
extinction ~ fMOTILITY + fTIERING + fFEEDING + fLATITUDE + fBASIN +
fENVIRONMENT + fCALCIFICATION
Df Deviance F value Pr(>F)
<none> 1.3576
fMOTILITY 1 1.4633 0.7010 0.424115
fTIERING 1 1.7343 2.4975 0.148485
fFEEDING 2 1.4873 0.4300 0.663196
fLATITUDE 1 3.1510 11.8898 0.007296 **
fBASIN 1 1.5097 1.0090 0.341381
fENVIRONMENT 2 1.7986 1.4619 0.281992
fCALCIFICATION 1 1.8601 3.3320 0.101236
---
Signif. codes: 0 ‘***’ 0.001 ‘**’ 0.01 ‘*’ 0.05 ‘.’ 0.1 ‘ ’ 1 >
> # best model
>
> GLM_LTE_A1iii <- glm(extinction ~ fLATITUDE,
+ family = quasibinomial, data = LTE)
>
> summary(GLM_LTE_A1iii)
Call:
glm(formula = extinction ~ fLATITUDE, family = quasibinomial,
data = LTE)
Deviance Residuals:
Min 1Q Median 3Q Max