This is a repository copy of Mild extraction methods using aqueous glucose solution for
the analysis of natural dyes in textile artefacts dyed with Dyer’s madder (Rubia tinctorum
L.).
White Rose Research Online URL for this paper:
http://eprints.whiterose.ac.uk/111112/
Version: Accepted Version
Article:
Ford, L, Henderson, RL, Rayner, CM et al. (1 more author) (2017) Mild extraction methods
using aqueous glucose solution for the analysis of natural dyes in textile artefacts dyed
with Dyer’s madder (Rubia tinctorum L.). Journal of Chromatography A, 1487. pp. 36-46.
ISSN 0021-9673
https://doi.org/10.1016/j.chroma.2017.01.053
© 2017 Elsevier B.V. This manuscript version is made available under the CC-BY-NC-ND
4.0 license http://creativecommons.org/licenses/by-nc-nd/4.0/
[email protected] https://eprints.whiterose.ac.uk/ Reuse
Unless indicated otherwise, fulltext items are protected by copyright with all rights reserved. The copyright exception in section 29 of the Copyright, Designs and Patents Act 1988 allows the making of a single copy solely for the purpose of non-commercial research or private study within the limits of fair dealing. The publisher or other rights-holder may allow further reproduction and re-use of this version - refer to the White Rose Research Online record for this item. Where records identify the publisher as the copyright holder, users can verify any specific terms of use on the publisher’s website.
Takedown
If you consider content in White Rose Research Online to be in breach of UK law, please notify us by
Mild extraction methods using aqueous glucose solution for the analysis of natural
1
dyes in textile artefacts dyed with
Dyer’s
madder (Rubia tinctorum L.)
2
Lauren Forda,b, Robert L. Hendersona,b, Christopher M. Raynerb, Richard S. Blackburna*
3
aSchool of Design, University of Leeds, Leeds, LS2 9JT, UK
4
bSchool of Chemistry, University of Leeds, Leeds, LS2 9JT, UK
5
*E-mail: [email protected]; Tel: + 44 113 343 3757; Fax: + 44 113 343 3704 6
7
Abstract
8
Madder (Rubia tinctorum L.) has been widely used as a red dye throughout history. Acid-sensitive colorants present in 9
madder, such as glycosides (lucidin primeveroside, ruberythric acid, galiosin) and sensitive aglycons (lucidin), are 10
degraded in the textile back extraction process; in previous literature these sensitive molecules are either absent or present 11
in only low concentrations due to the use of acid in typical textile back extraction processes. Anthraquinone aglycons 12
alizarin and purpurin are usually identified in analysis following harsh back extraction methods, such those using solvent 13
mixtures with concentrated hydrochloric acid at high temperatures. Use of softer extraction techniques potentially allows 14
for dye components present in madder to be extracted without degradation, which can potentially provide more 15
information about the original dye profile, which varies significantly between madder varieties, species and dyeing 16
technique. Herein, a softer extraction method involving aqueous glucose solution was developed and compared to other 17
back extraction techniques on wool dyed with root extract from different varieties of Rubia tinctorum. Efficiencies of the 18
extraction methods were analysed by HPLC coupled with diode array detection. Acidic literature methods were evaluated 19
and they generally caused hydrolysis and degradation of the dye components, with alizarin, lucidin, and purpurin being 20
the main compounds extracted. In contrast, extraction in aqueous glucose solution provides a highly effective method for 21
extraction of madder dyed wool and is shown to efficiently extract lucidin primeveroside and ruberythric acid without 22
causing hydrolysis and also extract aglycons that are present due to hydrolysis during processing of the plant material. 23
Glucose solution is a favourable extraction medium due to its ability to form extensive hydrogen bonding with glycosides 24
present in madder, and displace them from the fibre. This new glucose method offers an efficient process that preserves 25
these sensitive molecules and is a step-change in analysis of madder dyed textiles as it can provide further information 26
about historical dye preparation and dyeing processes that current methods cannot. The method also efficiently extracts 27
glycosides in artificially aged samples, making it applicable for museum textile artefacts. 28
29
Keywords
30
Madder; Rubia tinctorum; dyes; textiles; extraction; reactivity; HPLC analysis. 31
1. Introduction
33
Natural colorants are complex mixtures of many different molecules and plant dyes are often a mixture of aglycons of the 34
parent colorant moiety and their glycosidic counterparts. The nature of the glycosides and the ratio of the abundance of 35
these molecules can provide significant information about which plant species was used to dye the fibres or the technique 36
used for the dye process. In the context of historical textiles, this information is of paramount importance for conservation 37
and restoration purposes, as well as the generation of information on the ethnographic origins of the artefacts. 38
Colorants obtained from the roots of Dyers’ madder (Rubia tinctorum L.), are grouped collectively in the Colour 39
Index as C. I. Natural Red 8, and have been used as a red dyestuff for centuries. Dioscorides wrote about madder’s 40
usefulness in dyeing red and the dyestuff was well known to the dyers of Egypt, Greek and Roman eras [3]; however, 41
only in the 16th Century did dyeing recipes start to be readily available in literature [4]. Over 35 anthraquinonoid
42
compounds have been reported to be extractable from madder roots [5], however, many of these compounds are artefacts 43
of inherent reactivity during analytical extraction methods and are suspected as not being not present in planta; for 44
example, anthraquinones that contain a 2-methoxymethyl- or a 2-ethoxyethyl group are formed during extraction with 45
hot methanol or ethanol, respectively [5,6]. 46
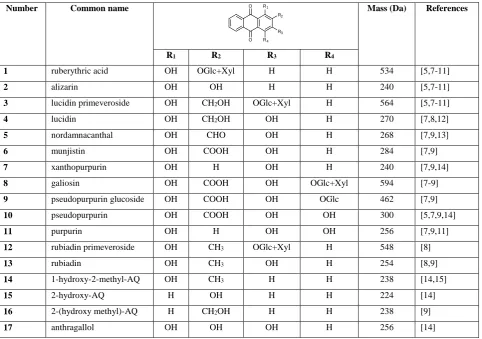
[image:3.595.59.542.384.723.2]47
Table 1. Anthraquinone derivatives observed in the roots of Rubia tinctorum L.
48
Number Common name Mass (Da) References
R1 R2 R3 R4
1 ruberythric acid OH OGlc+Xyl H H 534 [5,7-11]
2 alizarin OH OH H H 240 [5,7-11]
3 lucidin primeveroside OH CH2OH OGlc+Xyl H 564 [5,7-11]
4 lucidin OH CH2OH OH H 270 [7,8,12]
5 nordamnacanthal OH CHO OH H 268 [7,9,13]
6 munjistin OH COOH OH H 284 [7,9]
7 xanthopurpurin OH H OH H 240 [7,9,14]
8 galiosin OH COOH OH OGlc+Xyl 594 [7-9]
9 pseudopurpurin glucoside OH COOH OH OGlc 462 [7,9]
10 pseudopurpurin OH COOH OH OH 300 [5,7,9,14]
11 purpurin OH H OH OH 256 [7,9,11]
12 rubiadin primeveroside OH CH3 OGlc+Xyl H 548 [8]
13 rubiadin OH CH3 OH H 254 [8,9]
14 1-hydroxy-2-methyl-AQ OH CH3 H H 238 [14,15]
15 2-hydroxy-AQ H OH H H 224 [14]
16 2-(hydroxy methyl)-AQ H CH2OH H H 238 [9]
17 anthragallol OH OH OH H 256 [14]
Glc, glucose; Xyl, xylose; OGlc+Xyl, O-primeveroside, O-(6-O- -D-xylopyranosyl-D-glucosyl); AQ, anthraquinone.
49
Table 1 summarises the compounds that have been reported as being extracted from Rubia tinctorum roots 50
(excluding products of reaction with the extraction solvent); however, many of these compounds may not be present, or 51
R2
R3
O
O R1
present in low concentrations, in planta and may actually be a result of reaction during harvesting, drying, or processing 52
of the madder root before it is used for dyeing. When extracting and analysing colorants from textile artefacts as much 53
information should be preserved as possible in order to gain better insight on how they were dyed and the plant species 54
from which the dye originated, hence, it is important to limit the damage to the colorant molecule in the extraction process. 55
HPLC-DAD has become an important tool in analysing samples of historical interest due to the complex mixtures of 56
colorants involved when dyeing with natural dyes [16,17]. However, extraction of artefacts is not straightforward as the 57
dyes are strongly bound to the substrate via a mordant metal (typically Al3+); the most common literature extraction
58
procedure uses a 37% hydrochloric acid: methanol: water (2:1:1, v/v/v) mixture [18-23], as the strong acid enables 59
displacement of the dye molecules from their mordant metal complex [24]. However, such conditions may also induce 60
chemical reaction, and hence it is vital that a fundamental understanding of the reactivity of such natural dyes is developed 61
alongside the analysis of the components within the mixture. 62
Only relatively recently has there been significant evidence confirming the primary anthraquinone components 63
in Rubia tinctorum roots as the glycosides ruberythric acid (1) and lucidin primeveroside (3) [5,7-11]; the majority of 64
literature has pointed to alizarin (2) as the major anthraquinone present, and whilst it does occur in the plant, it is in much 65
lower concentrations than its glycoside [8,9,11]. Anthraquinone glycosides can be hydrolysed to their aglycon 66
counterparts (Figure 1); this may occur in the roots of the plant catalysed by endogenous enzymes, but could also be 67
during chemical processing, especially under acidic conditions. Ruberythric acid was first isolated from madder 68
(unspecified Asian species) by Rochleder in 1851 [25]; Schunck later demonstrated that the glycoside could be hydrolysed 69
to alizarin in planta catalysed by one of the first enzymes ever studied, which he isolated and called “erythrozyme” [26]. 70
Hill & Richter [27] demonstrated that boiling madder roots in water destroyed (denatured) the hydrolytic enzymes and 71
the glycosides could be readily extracted. Rubiadin primeveroside (12) occurs in very low concentrations in Rubia 72
tinctorum roots (<2%) [8], and is most likely the origin of trace amounts of rubiadin (13) detected in Rubia tinctorum 73
samples [8,9], as a result of hydrolysis (1213). Galiosin (8) and pseudopurpurin glucoside (9) occur in low
74
concentrations in Rubia tinctorum roots [7-9], and are both most probably the origin of low amounts of pseudopurpurin 75
(10) in Rubia tinctorum samples [5,7,9,14], also as a result of hydrolysis (8910).
76
Under the strongly acidic conditions used in many literature methods [28], it is suggested herein that acidic 77
conditions used in extraction and analysis of dyes in previous studies may have led to observations that alizarin was the 78
primary component [18-23], it being the product of ruberythric acid hydrolysis (12), most likely via the glucoside,
79
although isolation of the glucoside has not been reported. Even when ‘milder’ acids, such as 0.5 M citric acid [29] and 2 80
M trifluoroacetic acid (TFA) [30], have been used in the extraction of artefacts, alizarin has been the main compound 81
detected. More recently, dimethylformamide (DMF) and dimethyl sulfoxide (DMSO) have been employed to remove 82
dyes from artefacts [29,31], but neither solvent has been demonstrated as able to remove mordanted dyes nor have they 83
shown an ability to remove anthraquinone glycosides intact; it is also likely that DMSO can oxidise lucidin to 84
nordamnacanthal through a Kornblum/Swern type oxidation [32], hence DMSO is not an appropriate solvent for use in 85
madder extraction. 86
88
Figure 1. Possible inter-relationships between anthraquinone compounds found in Rubia tinctorum based on chemical or
89
biochemical interconversion. 90
91
The stability of different anthraquinone glycosides varies. Hill & Richter [27] demonstrated that galiosin (8) is 92
very unstable and is readily hydrolysed to pseudopurpurin (10), which is as a result of glycoside substitution at the -93
hydroxy in the 1-position; ruberythric acid (1) and rubiadin primeveroside (12) have glycoside substitution at the -94
hydroxy in the 2-position, making them significantly more stable to hydrolysis; the presence of a carboxylic acid moiety 95
within galiosin at the 2-position may also catalyse hydrolysis. After alizarin, the major compound identified as being 96
present in Rubia tinctorum in literature is purpurin (11) [18-23]; however, it is suggested that purpurin is formed through 97
decarboxylation of pseudopurpurin during the drying of the roots [33]. 98
Interestingly, despite high concentrations of lucidin primeveroside (3) in Rubia tinctorum roots [8,9,11], the 99
aglycon lucidin (4) is rarely detected (and then only in low and trace concentrations in planta and in textile artefacts [7-100
9,12]) even when acidic conditions are used that would promote hydrolysis (34); it is suspected that the reactive nature
of lucidin means that it is readily converted to other compounds. As Figure 1 shows, lucidin (4) can be oxidised to 102
nordamnacanthal (5), and studies have suggested this is catalysed by endogenous oxidase enzymes in the plant [5,34,35]. 103
Despite munjistin (6) being observed in Rubia tinctorum roots [7,9] and several other Rubia species [9,27,36,37], a 104
glycoside, munjistin glucoside, has only ever been detected in Japanese madder (Rubia akane Nakai) [9], suggesting that 105
munjistin is formed in planta through some other mechanism. It is possible that nordamnacanthal (5) can be further 106
oxidised to form munjistin; in contrast, Hill & Richter [27] proposed that munjistin (6) was formed by natural reduction 107
of pseudopurpurin (10), although this seems less likely. Xanthopurpurin (7) is formed through decarboxylation of 108
munjistin (6); xanthopurpurin may also be formed directly from lucidin (4) through an acid (or base)-catalysed loss of 109
formaldehyde through a retro-aldol type process (Figure 1). 110
Different madder varieties and species and different origins have different chromatographic profiles in planta, 111
hence, the most effective artefact extraction technique would be the one that preserves the colorants in the dyeings in the 112
form as applied. As most existing methods cause some form of acid-catalysed degradation to colorant moieties, it is vital 113
to future development of analytical techniques to examine historical textiles, that milder and effective extraction 114
techniques are developed to enable better-informed identification of the original dyestuff and to provide more information 115
about the botanic, geographic and ethnographic origins of the dyes. This should be considered alongside known or 116
anticipated reactivity of the molecules within the dye mixture. Mild extraction methods may also provide information 117
about the dyeing process, for example, in 1860, Fabre patented [38] a process to produce “garancine”, which involved 118
intentionally breaking down the glycosides in madder by treatment with sulfuric acid before dyeing to obtain more free 119
anthraquinones, which was believed to increase the efficiency of extraction of the dye components from the madder root. 120
This paper compares four different textile extraction techniques for identification of colorants present in different 121
varieties of Rubia tinctorum: HCl/methanol/water [18]; aqueous citric acid solution [29]; aqueous TFA solution [29,30]; 122
and a novel extraction method using an aqueous glucose solution. 123
124
2. Materials and methods
125
2.1. Materials and solvents
126
Natural cream wool, heavy weight with plain even weave was purchased from Whaley’s, Bradford. Three madder root 127
types were purchased from George Weil & Sons: ‘Iranian madder’, grown in Shiraz, Iran received as ground and dried 128
material; ‘Turkish madder’, sourced from a wholesaler received as dried roots; and ‘English madder’, grown by Dr. David 129
Hill at Bristol University received as dried roots. Alizarin and purpurin standards were purchased from Sigma-Aldrich. 130
A mixture of the glycosides lucidin primeveroside and ruberythric acid was purchased from Apin Chemicals. All solvents 131
used were of HPLC grade and purchased from Sigma-Aldrich. HPLC grade water was obtained by distillation on site. 132
133
2.2 General Procedures and Instrumentation
134
Nuclear magnetic resonance (NMR) spectra recorded for H1 NMR at 300.13 MHz and 500.21 MHz and 13C at 75.45 MHz
135
on a Bruker DPX300 and DRX500 spectrometer. Chemical shifts are given in parts per million (ppm) downfield of 136
tetramethylsilane (singlet at 0 ppm) for proton resonances. The proton coupling constants are corrected and given in Hz 137
High resolution electrospray (ESI+) mass spectrometry was performed on a Bruker MaXis Impact spectrometer, m/z 139
values are reported in Daltons to four decimal places. Liquid Chromatography with Mass Spectrometry (LC-MS) was 140
carried out for analysis synthetic references. LC analyses were carried out at room temperature on a Phenomenex 141
Hyperclone C18 column, 5 m particle size, 250 x 4.6 mm I.D. column equipped with a pre-column. Chromatography
142
was carried out using two solvents: (A) water and 0.1% formic acid solution and (B) acetonitrile and 0.1% formic acid 143
solution. A linear gradient programme was applied: of 0-3 minutes 0-100% increase of solvent B. The flow rate during 144
the experiment was 1.0 ml min-1. Injections were made by a Basic Marathon autosampler equipped with a 20 l loop. The
145
method was carried out on an Agilent 1200 LC using a Bruker HCT Ultra Ion Trap for the MS detection and a Diode 146
Array Detector. The ESI (electrospray ionisation) parameters in the negative ion mode were as follows: spray voltage 147
4000 V (applied to the spray tip needle), dry gas 10 dm3 min-1, dry temperature 365 °C, capillary 60 nA, nebulizer 65 psi,
148
nebulising gas N2. UV/visible spectrophotometry was carried out using a Jasco V-530 UV/visible/NIR spectrophotometer
149
at 2 nm intervals. Spectral properties and wavelength of maximum absorbance ( max) were evaluated. Infrared spectra
150
were recorded on a Bruker Alpha Platinum ATR. Samples were analysed in the solid phase and absorption maxima ( max)
151
are given in wave numbers (cm-1) to the nearest whole wavenumber.
152
153
2.3 Synthesis of references for chemical components of dye mixtures
154
2.3.1 Xanthopurpurin 155
This method was based on that of Murti et al. [39]. Anhydrous aluminium chloride (4.8 g, 40 mmol) and sodium chloride 156
(1.2 g, 20 mmol) were heated to 150 C until molten. To this, a mixture of phthalic anhydride (1.84 g, 8 mmol) and 157
resorcinol (0.80 g, 8 mmol) was added slowly. The temperature was then slowly increased to 165 C and maintained for 158
4 hours. The reaction mixture was then cooled to 0 C and 2M aqueous hydrochloric acid solution was added and stirred 159
for 15 minutes. The reaction mixture was then heated to reflux for 30 minutes, after which it was cooled to room 160
temperature and extracted with ethyl acetate (3 × 30 ml). The ethyl acetate extracts were then washed successively with 161
saturated sodium bicarbonate solution (30 ml), dried with magnesium sulphate and evaporated to dryness. Product was 162
collected as a yellow/orange amorphous solid (28 mg, 1.2% yield). 163
164
1H NMR (500 MHz, DMSO): 12.76 (s, 1H, OH), 11.32 (s, 1H, OH), 8.23 (dd, J= 7.5, 1.7 Hz, 1H, H4), 8.18 (dd, J= 7.5,
165
1.7 Hz, 1H, H1), 7.95 (app td, J= 1.7, 7.6 Hz, 1H, H3), 7.92 (app td, J= 1.7, 7.6 Hz, 1H, H2), 7.15 (d, J= 2.3 Hz, 1H, H5), 166
6.62 (d, J= 2.3 Hz, 1H, H6). 13C NMR (101 MHz, MeOD) 158.2, 157.8, 157.4, 157.0, 134.0, 133.8, 126.6, 126.2, 118.9,
167
116.0, 113.2, 110.4, 108.1, 107.5. HRMS: m/z (ESI-) calculated for C14H8O4 [M-H]- :239.0423; found [M-H]- :239.0354.
168
HPLC retention time and mass data of negative ion can be found in Table 2. IR (ATR), (cm-1): 3360, 1633, 1598, 1451,
169
1258. Melting point: 261-264 °C. max (log ) in MeOH:412 nm (4.15).
170
171
2.3.2. Lucidin 173
This method was based on that of Murti et al. [39]. Xanthopurpurin (20 mg, 0.08 mmol) was dissolved in 5% aqueous 174
sodium hydroxide solution (0.5 ml). Aqueous formaldehyde 37% (30 l, 0.4 mmol, 5 equivalents) was then added and 175
stirred at room temperature for 3 hours and the reaction was monitored by LC-MS. Once completion was observed the 176
solution was precipitated with 10% aqueous hydrochloric acid solution (~1 ml) until a yellow precipitate was observed. 177
The yellow precipitate was then extracted with ethyl acetate (3 × 1 ml), dried with magnesium sulphate and then 178
evaporated to dryness. This was then separated on a short flash silica column with 70% ethyl acetate, 30% hexane to give 179
lucidin in a yellow amorphous solid (21 mg, 87.5% yield). 180
181
1H NMR (500 MHz, DMSO): 11.33 (s, 1H, OH), 8.22 (dd, J= 7.5, 1.5 Hz, 1H, H4), 8.15 (dd, J= 7.0, 1.5 Hz, 1H, H1),
182
7.77 (app td, J= 1.6, 7.2 Hz, 1H, H3), 7.74 (app td, J= 1.6, 7.2 Hz, 1H, H2), 7.26 (s, 1H, H5), 4.83 (broad s, 1H, OH), 183
4.55 (s, 2H, H6). 13C NMR (126 MHz, MeOD) 159.9, 159.6, 159.4, 159.1, 158.7, 158.4, 119.4, 117.1, 114.8, 112.6,
184
54.7, 54.5, 54.3, 54.2, 54.0. HRMS: m/z (ESI-) calculated for C15H10O5 [M-H]- :269.0528; found [M-H]- :269.0464. HPLC
185
retention time and mass data of negative ion can be found in Table 2. IR (ATR), (cm-1): 3400, 1634, 1558, 1365, 1338.
186
Melting point: 301-305 °C. max (log ) in MeOH: 410 nm (3.66).
187
2.3.3. Rubiadin 188
Anhydrous aluminium chloride (4.8 g, 40 mmol) and sodium chloride (1.2 g, 20 mmol) were heated to 150 C until 189
molten. To this, a mixture of phthalic anhydride (1.84 g, 8 mmol) and 2-methyl resorcinol (0.99 g, 8 mmol) was added 190
slowly. The temperature was then slowly increased to 165 C and maintained for 4 hours. The reaction mixture was then 191
cooled to 0 C and 2M aqueous hydrochloric acid solution was added and stirred for 15 minutes. The reaction mixture 192
was then heated to reflux for 30 minutes, after which it was cooled to room temperature and extracted with ethyl acetate 193
(4 × 30 ml). The ethyl acetate extracts were then washed successively with saturated sodium bicarbonate solution (30 ml), 194
dried with magnesium sulphate and evaporated to dryness to give yellow plates (0.41 g). Yellow powder was then 195
recrystallised in ethanol (0.39 g, 19% yield). 196
197
1H NMR (501 MHz, MeOD) 8.19 (dd, J = 7.5, 1.3 Hz, 1H, H4), 8.10 (dd, J = 7.5, 1.3 Hz, 1H, H1), 7.75 (app td, J =
198
1.7, 7.3 Hz, 1H, H3), 7.72 (app td, J = 1.7, 7.3 Hz, 1H, H2) 7.17 (s, 1H, H5), 2.06 (s, 3H, H6). 13C NMR (126 MHz,
199
MeOD) 188.05, 183.63, 164.21, 164.18, 135.53, 135.59, 134.92, 134.75, 133.57, 132.44, 128.02, 127.74, 119.28, 200
108.43, 8.51. HRMS: m/z (ESI-) calculated for C15H10O4 [M-H]- : 253.0579; found [M-H]- :253.0534. HPLC retention
201
time and mass data of negative ion can be found in Table 2. IR (ATR), (cm-1): 3387, 2917, 2356, 1698, 1577, 1292 cm
-202
1. Melting point: 286-291 °C (from EtOH).
max (log ) in MeOH: 410 nm (4.46).
2.4. Dyeing procedure
204
Wool samples (5 g) were first scoured using HPLC grade water containing 1 g dm-3 Sandozin NIN (non-ionic detergent)
205
in a Roaches Pyrotec S Rotodyer dyeing machine, using a liquor-fibre ratio of 200:1, at 50 °C for 2 hours. Samples were 206
then washed in deionised water and air-dried. Scoured wool samples were then mordanted in an aqueous solution of 77% 207
on mass of fibre (omf) potassium aluminium sulfate and 15% omf potassium hydrogen tartrate in a Roaches Pyrotec S 208
Rotodyer dyeing machine, using a liquor-fibre ratio of 200:1, at 50 °C for 2 hours. Wool samples were then rinsed with 209
deionised water and immersed directly in the dyebath. Dyebaths were previously prepared by heating dried and ground 210
madder root (0.62 g, 31% omf) in water (100 ml) in a Roaches Pyrotec S Rotodyer dyeing machine, at 90 °C for 3 hours; 211
the red solution was then filtered to remove any solids and pre-treated wool was immersed in the solution and temperature 212
maintained at 90 °C for 3 hours with rotation. After dyeing, wool samples were then rinsed and left to dry in air and stored 213
away from light. 214
215
2.5. Extraction methods
216
2.5.1. HCl extraction 217
This method was based on one used by Wouters [18], which has been used similarly by many other authors. A solution 218
of 37% HCl: methanol: water (2:1:1, v/v/v) was prepared and 0.5 ml of this solvent was used to extract each wool sample 219
(2 mg) at 90C for 15 mins. The solution was then filtered and evaporated to dryness at reduced pressure using a Buchi 220
rotary evaporator at 20 mbar below 40C and then re-dissolved in methanol: water (1:1, v/v). Samples were then subjected 221
to HPLC-DAD analysis. Each type of madder was extracted and the experiment was repeated twice for each type of 222
madder dyed wool. 223
2.5.2. Citric acid extraction 224
This method was based on that of Valianou et al. [29]. An aqueous solution of 0.5 M citric acid was prepared 0.5 ml of 225
this solvent was used to extract each wool sample (2 mg) at 90C for 15 mins. The solution was then filtered and 226
evaporated to dryness at reduced pressure using a Buchi rotary evaporator at 20 mbar below 40C and re-dissolved in 227
methanol: water (1:1, v/v). The samples were then subjected to HPLC-DAD analysis. Each type of madder was extracted 228
and the experiment was repeated twice for each type of madder dyed wool. 229
2.5.3. Trifluoroacetic acid (TFA) extraction 230
This method was based on methods by Valianou et al. [29] and Mantzouris et al. [30]. An aqueous solution of 2 M TFA 231
was prepared and 0.5 ml of this solvent was used to extract each wool sample (2 mg) at 90C for 15 mins. The solution 232
was then filtered and evaporated to dryness at reduced pressure using a Buchi rotary evaporator at 20 mbar below 40C 233
and re-dissolved in methanol: water (1:1, v/v). The samples were then subjected to HPLC-DAD analysis. Each type of 234
madder was extracted and the experiment was repeated twice for each type of madder dyed wool. 235
2.5.4. Glucose extraction 236
An aqueous solution of 0.4% D-(+)-glucose in HPLC grade water was prepared and 0.5 ml of this solvent was used to
237
The solution was then filtered and evaporated to dryness at reduced pressure using a Buchi rotary evaporator at 20 mbar 239
below 40C and re-dissolved in methanol: water (1:1, v/v). The samples were then subjected to HPLC-DAD analysis. 240
Each type of madder was extracted and the experiment was repeated twice for each type of madder dyed wool. 241
242
2.6. High Performance Liquid Chromatography with Photodiode Array Detection (HPLC-DAD)
243
HPLC conditions were carried out at 30 °C with a Nova-Pak C18, 5 m particle size, 15 3.9 cm I.D. column equipped 244
with pre-column on a Dionex Ultimate 3000 series UHPLC binary pump system with online degasser and photodiode 245
array detection (DAD). Conditions were solvent A: water (HPLC grade) in 0.1% formic acid; solvent B: acetonitrile in 246
0.1% TFA. Linear gradient programme applied of 0-6 minutes 27% B; 6-20 minutes linear increase to 60% B; 20-23 247
minutes hold at 60% B; 23-25 minutes linear increase to 70% B; 25-35 minutes hold at 70% B; 35-40 minutes linear 248
decrease to 27% B. Method followed as described in the literature [5]. The flow rate was 1.0 ml min-1 and peaks were
249
detected at 254 nm. Detection range was 190-400 nm, scan speed set to 0.002 mins and the data collection rate was 5 Hz. 250
Quantification of dye components was conducted at 254 nm relative to standards, in accordance with literature methods 251
[18,29,30]. 252
253
2.7. Artificial ageing of dyed wool
254
To implement the photodegradation of dyed wool samples by light irradiation, bespoke equipment was constructed and a 255
method applied based on the work of Colombini et al. [40]. The apparatus consisted of a wooden box of dimensions 1 m 256
(width) x 1 m (length) x 0.44 m (height). Within the box both the irradiation element and the sample area was contained 257
within a circular steel frame of 84 cm diameter and 38.5 cm height. Wool samples dyed with Turkish madder were 258
mounted on to cardboard cut-outs and stapled in place then they were mounted at varying distances from the centre on a 259
spherical section of mesh to enable uniform irradiation and energy delivery. Illumination was provided by a xenon arc 260
bulb, wherein the bulb was an XBO 450 w/4 xenon short arc lamp, producing 450 watts with a luminous flux of 13000 261
lm. The light source element was located 24 cm from the base. Owing to a 310° range of irradiation, and the height of the 262
box, the maximum area available for sample mounting was ca. 227 cm x 46 cm, hence the number of samples irradiated 263
was dependent on the specific test procedure or requirement of processing. The delivery of energy to the dyed wool 264
sample was controlled by the duration of exposure, in every instance the samples were exposed to 400 hours of light and 265
the distance from the bulb was 30 cm. The box was fitted with a fan to expel ozone and facilitate air exchange. Testing 266
was conducted in ambient conditions where the temperature and humidity were maintained at 25 °C and 65% RH, 267
respectively. 268
269
3. Results and discussion
270
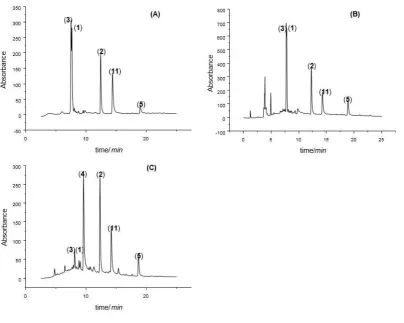
Comparative HPLC analysis of the original dyebaths of the three different Rubia tinctorum varieties was carried out and 271
assigned by comparison to analytical standards (Table 2). From Figure 2 it can be seen that “Iranian madder” (Figure 2A) 272
and “Turkish madder” (Figure 2B) have similar colorant profiles: the primary components are the glycosides lucidin 273
primeveroside (3) and ruberythric acid (1), with significant concentrations of the aglycons alizarin (2) and purpurin (11). 274
(4) and alizarin (2); English madder only displays small amounts of the glycosides lucidin primeveroside (3) and 276
ruberythric acid (1), which may have been caused through either enzymatic or chemical hydrolysis during 277
drying/processing of the roots. All chromatograms also contain a small peak which has been assigned to nordamnacanthal 278
(5) as it matches the mass observed by LC-MS. 279
[image:11.595.106.511.142.465.2]280
Figure 2. HPLC chromatograms of dyebaths prepared by extracting roots of different Rubia tinctorum varieties at 90 °C
281
for 3 hours (no wool added): (A) Iranian madder; (B) Turkish madder; (C) English madder. 282
283
Ideally, an effective extraction method should reveal differences between madder types grown in different 284
locations, i.e. Iran, Turkey and England; it is currently unclear whether the differences between these plants are due to 285
different treatments upon drying/processing or if the origins of the differences in the ratios of the colorants are in planta. 286
Nonetheless, it is interesting to determine if these subtle differences are observed in extraction of dyed wool samples. 287
Textile back extractions were carried out on wool dyed with the three different Rubia tinctorum varieties and compared 288
to the original dyebaths. It is worth noting that at these higher concentrations some of the peaks retention times are shifted 289
slightly higher. This has been seen observed in dilutions creating the calibration curves of the dye, but each peak can be 290
identified by the distinctive UV trace of each compound, as shown in Table 2. 291
292
293
Table 2. Compounds identified by HPLC-DAD and LC-MS analysis of madder roots.
295
Anthraquinone derivative
assigned to HPLC peak
Retention time
(min)
UV max values for
compound identification
(nm)
Molecular ion, m/z,
from LC-MS [M-H]
-lucidin primeveroside (3) 7.5 246, 285 563
ruberythric acid (1) 7.5 224, 259 557
lucidin (4) 9.5 247, 288 269
alizarin (2) 11.9 249, 279 239
xanthopurpurin (7) 12.3 243, 280 239
purpurin (11) 13.5 255, 294 255
rubiadin (13) 15.2 248, 275 253
nordamnacanthal (5) 17.2 259, 297 267
296
3.1. HCl: methanol: water extraction
297
298
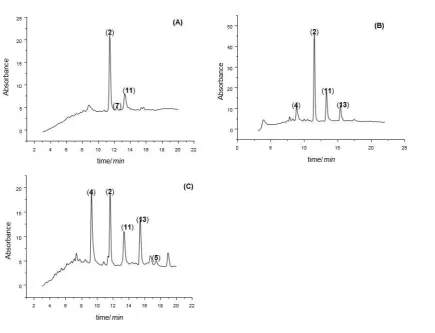
Figure 3. HPLC chromatograms of wool dyed with extracts of roots of different Rubia tinctorum varieties, extracted with
299
37% HCl: methanol: water (2:1:1, v/v/v): (A) Iranian madder; (B) Turkish madder; (C) English madder. 300
301
37% HCl: methanol: water (2:1:1, v/v/v) is used throughout the literature for extraction of natural colorants from textile 302
[image:12.595.63.499.328.661.2]wool samples dyed with the three types of madder are alizarin (2) and purpurin (11) for all varieties. In the extraction of 304
Turkish madder (Figure 3B) and English madder (Figure 3C), rubiadin (13) is present after back extraction of the textile 305
samples, but absent in the original dyebath; this could be a breakdown product of the extraction procedure as documented 306
in literature [28,29], notably a possible hydrolysis product following breakdown of rubiadin primeveroside (12), which is 307
present in very low quantities and may be masked by other anthraquinone glycoside peaks in the HPLC-DAD analysis of 308
the original dyebaths. 309
No glycosides are present in the Iranian madder (Figure 3A) or Turkish madder (Figure 3B) extractions, which is not 310
representative of the original dyebaths (Figures 2A and 2B) where the glycosides ruberythric acid (1) and lucidin 311
primeveroside (3) are observed in significant concentrations; this highlights the need for a milder extraction technique as 312
it is important to preserve the glycosides in order to gain the most detailed information on the compounds used in the 313
original dyeing. Lucidin (4) is present in extraction of Turkish madder (Figure 3B) when it is not observed in the 314
corresponding original dyebath (Figure 2B), which is most likely as a result of hydrolysis of lucidin primeveroside to 315
lucidin during the acidic back extraction process, demonstrating that this HCl: methanol: water technique is limited in 316
terms of its ability to extract a true representative sample of dye components from the textile sample. 317
318
3.2. Citric acid extraction
319
The theory behind the citric acid technique is that the weaker acid provides an extraction process with a less detrimental 320
effect to acid-sensitive compounds present in the madder [29]; it is also possible that citric acid is able to chelate to the 321
mordant metal (Al3+), which may aid extraction by disrupting the dye-metal complex. Despite the milder acid, there is
322
still evidence of detrimental effects, as observed in by HPLC (Figure 4): the glycosides lucidin primeveroside (3) and 323
ruberythric acid (1) are observed in very low concentrations in Iranian madder, significantly lower than in the original 324
dyebath, and not observed at all in Turkish or English madder; the main peaks observed in all three samples are the 325
aglycons alizarin (2) and purpurin (11). The possible degradation product rubiadin (13) is present, but only in the case of 326
English madder (Figure 4C), wherein a peak assigned to lucidin (4) is also present, but in lower concentrations compared 327
to the original dyebath. Nordamnacanthal (5), which is found in all original dyebaths, is present in the case of both Iranian 328
and Turkish madder and in similar peak ratios to the original dyebaths. Nordamnacanthal (5) is not present in English 329
madder extracted with citric acid (Figure 4C) when it is present in the original dyebath. This could be the effect of many 330
other aglycons competing for sites on the mordanted wool in the dyeing procedure and hence may not be as easily 331
333
Figure 4. HPLC chromatograms of wool dyed with extracts of roots of different Rubia tinctorum varieties, extracted
334
with 0.5 M citric acid: (A) Iranian madder; (B) Turkish madder; (C) English madder. 335
336
3.3. Trifluoroacetic acid (TFA) extraction
337
As can be observed in Figure 5, the peaks present are the aglycons alizarin (2) and purpurin (11) in all cases; no glycosides 338
are present in the samples, which is probably due to them being very sensitive to acid hydrolysis under these conditions. 339
A broad peak is present in the Iranian madder extraction (Figure 5A) that has a similar retention time as the glycosides, 340
but the UV data did not correspond, hence this could not be assigned to lucidin primeveroside (3) or ruberythric acid (1). 341
This extraction procedure is very efficient for the extraction of English madder (Figure 5C) as it the closest to resembling 342
the original dyebath; the main peak in English madder samples is that of lucidin (4) as seen in the original dyebath. It is 343
notable that the HPLC chromatograms of the Turkish madder samples (Figure 5B) also contain lucidin in the extraction 344
analysis; however, lucidin is not observed as a product in the original dyebaths of Turkish madder (Figure 2B) and hence 345
is probably present due to the hydrolysis of lucidin primeveroside. Rubiadin (13) is present after back extraction of all 346
the samples using the TFA method; as discussed previously, this is likely the hydrolysis product rubiadin primeveroside 347
(12), which is present in very low quantities and may be masked by other anthraquinone glycoside peaks in the HPLC-348
DAD analysis of the original dyebaths. It is also notable that nordamnacanthal (5) is not present in any of the samples 349
extracted with TFA when it is present in the original dyebath, which may be as a result of the TFA extraction process not 350
352
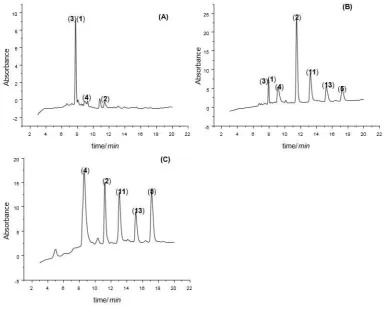
Figure 5. HPLC chromatograms of wool dyed with extracts of roots of different Rubia tinctorum varieties, extracted
353
with 2 M TFA: (A) Iranian madder; (B) Turkish madder; (C) English madder. 354
355
3.4. Glucose extraction
356
An aqueous glucose solution (0.4% w/v) was used to extract wool samples dyed with the three madder types. It was 357
observed from HPLC chromatograms (Figure 6) of the extraction of the wool samples that the glycosides lucidin 358
primeveroside (3) and ruberythric acid (1) are present in the extraction from Iranian madder (Figure 6A) and Turkish 359
madder (Figure 6B), which has not been observed in significant concentrations for any of the other extraction methods 360
evaluated in this research. Accordingly, it would seem that the glucose method is the only one that allows preservation of 361
the glycosidic components lucidin primeveroside (3) and ruberythric acid (1) adsorbed onto the fibre and also enables 362
their extraction. As can be seen from extraction of Turkish madder (Figure 6B) and English madder (Figure 6C), the 363
glucose method is also able to extract aglycons as both samples yield alizarin (2) and purpurin (11), however the aglycons 364
are only observed in trace quantities in the Iranian madder samples (Figure 6A); HPLC analysis of the dyebaths before 365
and after dyeing reveals that the most significant decrease in peak size was that of the two glycosides as a result of their 366
sorption onto the wool fibre, and only a small decrease in the peaks of alizarin and purpurin was also observed, so in the 367
case of the Iranian madder it may be that there was limited adsorption of the aglycons onto the fibre during dyeing, hence 368
why there was little removed during glucose extraction. In the glucose extraction method lucidin (4) is observed as a main 369
peak for the extracted English madder samples (Figure 6C), which corresponds to the HPLC analysis of the original 370
corresponding dyebath (Figure 2C), the glucose method does not extract any glycosides from the English madder as there 371
a result of hydrolysis during processing of the madder prior to receipt. Lucidin is also observed in low concentrations in 373
the Turkish madder samples, in agreement with observations from the TFA extraction. 374
[image:16.595.101.490.111.430.2]375
Figure 6. HPLC chromatograms of wool dyed with extracts of roots of different Rubia tinctorum varieties, extracted
376
with 0.4% aqueous glucose solution: (A) Iranian madder; (B) Turkish madder; (C) English madder. 377
378
An aqueous solution of 0.4% glucose and using 0.5 ml of this solvent to extract a 2 mg wool sample corresponded 379
to a 1:1 mass ratio of glucose to wool sample; it was found through varying the concentration of the glucose that this was 380
sufficient to enable efficient extraction and increasing glucose concentration above a 1:1 ratio did not improve the 381
extraction efficiency. When no glucose was present, the water alone was not able to extract any dye components from the 382
sample in significant concentrations. Temperatures below 90 C did not extract as high concentrations of both the 383
glycoside and aglycon dye components, but glycosides were still detected. Longer extraction times were also applied, but 384
15 minutes was found to be sufficient for the samples tested and extending the time did not afford significant advantages. 385
Other sugars (xylose, galactose, fructose, and sucrose) were also evaluated to see the efficiency of the extraction technique, 386
and it was observed that although other sugars were able to extract glycosides efficiently, the relative concentration of 387
alizarin extracted was not as high as for glucose extractions; it was thought that this may be related to the nature of the 388
primary hydroxyl group in glucose and its ability to bind with and disrupt the Al-dye mordant complex. Full details of 389
these optimisation and alternative sugar experiments are available [41]. 390
It is suggested that the glucose solution provides a favourable extraction medium for several reasons. Glucose 391
interactions, thus displacing glycosylated dye into aqueous solution. It is unlikely that there is one dye interaction per 393
mordant metal atom and the presence of multiple layers of dye (through H-bonding and - interactions between dye 394
molecules) means that there is propensity for aggregates to be disrupted and the dye displaced from fibre. Crystal 395
structures of the glycosidic components lucidin primeveroside (3) [10] and ruberythric acid (1) [11] display significant 396
hydrogen bonding between sugar moieties, and the anthraquinone backbones do not hydrogen bond at all, which supports 397
the argument that glucose can disrupt dye aggregates by forming extensive hydrogen bonding interactions with the sugar 398
moieties in the dye molecules. It is also evident that the glucose extraction method is able to overcome the interactive 399
forces between the mordant metal (Al3+) and the dye as the glucose solution is still an effective extraction medium in the
400
case of English madder where it would appear that there are no anthraquinone glycosides in the initial dye extracts. It is 401
possible that glucose can also competitively bind to the mordant and disrupt dye-metal interactions. It should be noted 402
that some pale residual colour remained on each sample after back extraction, but this was observed in all cases and not 403
particular to any one method. This is most probably due to low concentrations of particularly strongly bound residual 404
components, which could be potentially analysed through alternative techniques using fibre digestion. 405
A quantitative comparison of extraction methods (Figure 7) further exemplifies the efficiency of the glucose 406
extraction method in its ability to remove glycosidic anthraquinone components without causing hydrolysis of the sugar 407
moieties. A further important observation was that the concentration of alizarin in English madder in each extraction 408
method, including glucose, was equal (within experimental error), confirming no anthraquinone glycosides were present 409
in the starting dyebath as observed in Figure 2C. Furthermore, although alizarin is extracted from Turkish madder-dyed 410
samples by the glucose method, it is at a much lower concentration than for other extraction methods, confirming that 411
both alizarin and anthraquinone glycosides were present in the starting dyebath as observed in Figure 2B. This further 412
demonstrates the advantages of the glucose method; dye components may be hydrolysed fully or partially before 413
adsorption onto the fibre (e.g. during drying or processing of madder roots, or in the original dyebath), and this new 414
method provides differentiation of this from hydrolysis in back extraction. This is a step-change in analysis of madder 415
dyed textiles as it can provide further information about historical dye preparation and dyeing processes that current 416
methods cannot. 417
The intention of the work described herein was to develop a technique that could be applied to museum objects 418
and historical textile artefacts; however, further validation is desirable before using such valuable substrates. An 419
alternative approach was to artificially age freshly dyed samples using UV photodegradation, based on the work of 420
Colombini et al. [40]. Samples dyed with an alternative source of Turkish madder were used for this work as they had 421
been demonstrated to have the greatest concentration of glycosides present in the fresh dyeings when analysed with the 422
novel glucose method (Figure 6A). Dyeings were aged in a xenon light chamber for 400 hours and fading of the samples 423
was observed, although significant colour remained. Aged dyeings and fresh dyeings were subsequently extracted using 424
the HCl, TFA and glucose methods previously described herein and analysed as before. Considering the relative ratios of 425
lucidin primeveroside, ruberythric acid and alizarin, it was observed that for the aged samples extracted with the HCl and 426
TFA methods, only alizarin was observed and the glycosides not detected, which compared exactly to samples before 427
ageing. For samples extracted using the glucose method, the ratio of lucidin primeveroside:ruberythric acid:alizarin 428
extracted before ageing was 0.8:0.9:1.0, and the same ratio after ageing was 0.8:0.8:1.0, so only minimal change was 429
observed. It is thought that the packing of the dyes on the fibre surface should not change considerably after ageing if 430
these dyes are present in the original textile; moreover, the preservation of the glycosides after artificial ageing in the 431
same ratio as alizarin, suggests that glycosides are able to form complexes with the mordant metal, which is known to 432
samples demonstrates that this novel glucose method can be applied to historical textiles, and work is ongoing in this area 434
to exemplify this on actual artefacts. 435
436
[image:18.595.70.523.138.447.2]437
Figure 7. Concentration of anthraquinone glycosides (primarily ruberythric acid and lucidin primeveroside) extracted
438
from wool samples in comparison with concentration of alizarin (main anthraquinone aglycon) extracted. 439
440
4. Conclusions
441
Extraction in aqueous glucose solution provides a highly effective method for extraction of madder dyed wool on a 2 mg 442
scale, which would be applicable for museum textile artefacts. HPLC-DAD analysis allowed conclusive identification of 443
each peak based on UV data and retention times obtained. Glucose solution is a favourable extraction medium due to its 444
ability to form extensive hydrogen bonding with dye molecules present in madder, particularly glycosides, to solubilise 445
the molecules for expeditious removal from fibre. It is extremely important that acid-sensitive molecules present in 446
madder, such as glycosides (lucidin primeveroside, ruberythric acid, galiosin) and sensitive aglycons (lucidin), are 447
preserved in the textile extraction process to enable better-informed identification of the original dyestuff and dyeing 448
process. Acid-sensitive anthraquinonoid colorants are either not present at all or only in small amounts in the previously 449
studied textile back extractions, particularly those including acid in the method, due to their sensitivity. This new glucose 450
method offers an efficient process that preserves these sensitive molecules and is a step-change in analysis of madder 451
dyed textiles as it can provide further information about historical dye preparation and dyeing processes that current 452
museum textile artefacts. One suggested area for improvement of the glucose method is in the separation of the glycosides 454
in LC through the use of alternative methods, which would be especially useful to be able to separately quantify the 455
different glycosides present, especially those present in lower concentrations. 456
This technique is used to detect glycosides contained in the textile if they are present and does not have any 457
detrimental effect on these compounds and hence give more information on the historical textile being examined. This 458
detection method is a very gentle method which could be used as a first step to detect these acid sensitive compounds 459
followed by a stronger acidic back extraction to remove any aglycons still left on the textile. 460
461
Acknowledgments and Funding Information
462
The authors would like to thank The Clothworkers’ Foundation for the provision of financial support to LF to allow her 463
to conduct her PhD studies. 464
465
References
466
1. X. Zhang, R. Boytner, J.L. Cabrera, R. Laursen, Identification of Yellow Dye Types in Pre-Columbian Andean 467
Textiles, J. Anal. Chem. 4 (2007) 1575-1582. 468
2. A. Manhita, T. Ferreira, A. Candeias, C.B. Dias, Extracting natural dyes from wool – an evaluation of extraction 469
methods, Anal. Bioanal. Chem., 400 (2011) 1501-1514. 470
3. F. Brunello, The Art of Dyeing in the History of Mankind, Neri Pozza, Vicenza, 1973. 471
4. J. Hofenk de Graaff, The Colourful Past, Archetype Publications Ltd, London, 2004. 472
5. G.C.H. Derksen, H.A.G. Niederlander, T. van Beek, Analysis of anthraquinones in Rubia tinctorum L. by liquid 473
chromatography coupled with diode-array UV and mass spectrometric detection, J. Chromatogr. A, 978 (2002) 119-474
127. 475
6. R. Wijnsma, R. Verporte, In R.A. Hill, H.C. Krebs (Eds), Progress in the Chemistry of Organic Natural Products, Vol. 476
49, Wein: Springer-Verlag, 1986, pp. 78-149. 477
7. I. Boldizsár, Z. Sz cs, Zs. Füzfai, I. Molnár-Perl, Identification and quantification of the constituents of madder root 478
by gas chromatography and high-performance liquid chromatography, J. Chromatogr. A, 1133 (2006) 259-274. 479
8. G. Cuoco, C. Mathe, P. Archier, F. Chemat, C. Vieillescazes, A multivariate study of ultrasound-assisted extraction 480
of madder dyes and charactisation by liquid chromatography-photodiode array detection, Ultrasonics Sonochemistry, 481
16 (2009) 75-82. 482
9. C. Mouri, R. Laursen, Identification of anthraquinone markers for distinguishing Rubia species in madder-dyed 483
textiles by HPLC, Microchim. Acta 179 (2012) 105-113. 484
10.R.L. Henderson, C.M. Rayner, R.S. Blackburn, Isolation and extraction of lucidin primeveroside from Rubia 485
tinctorum L. and crystal structure elucidation, Phytochemistry, 95 (2013) 105-108. 486
11.L. Ford, C.M. Rayner, R.S. Blackburn, Isolation and extraction of ruberythric acid from Rubia tinctorum L. and crystal 487
structure elucidation, Phytochemistry, 117 (2015) 168-173. 488
12.Y. Yasui, N. Takeda, Identification of a mutagenic substance, in Rubia tinctorum L. (madder) root, as lucidin, Mutat. 489
Res., 121 (1983) 185-190. 490
14.Y. Kawasaki, Y. Goda, K. Yoshihira, The mutagenic constituents of Rubia tinctorum, Chem. Pharm. Bull. 40 (1992) 492
1504-1509. 493
15.E.Y. Backheet, S.F. Farag, N.A. El-Emary, Anthraquinones and iridoid glucosides from the roots of Rubia tinctorum 494
L., Bull. Faculty Pharm. 39 (2001) 135-140. 495
16.G. Derksen, T.A. van Beek, Æ. de Groot, A. Capelle, High-performance liquid chromatographic method for the 496
analysis of anthraquinone glycosides and aglycons in madder root (Rubia tinctorum). J. Chromatogr. A, 816 (1998) 497
277-281. 498
17.P. Novotna, V. Pacakova, Z. Bosakova, K. Stulik, High-performance liquid chromatographic determination of some 499
anthraquinone and naphthoquinone dyes occurring in historical textiles. J. Chromatogr. A, 863 (1999) 235-241. 500
18.J. Wouters, High Performance Liquid Chromatography of Anthraquinones: Analysis of Plant and Insect Extracts and 501
Dyed Textiles, Stud. Conserv., 30 (1985) 119-128. 502
19.J. Wouters, L. Maes, R. Germer, The identification of haematite as a red colorant on an Egyptian textile from the 503
second millenium BC, Stud. Conserv., 35 (1990) 89-92. 504
20.I. Karapanagiotis, S. Daniilia, A. Tsakalof, Y. Chryssoulakis, Identification of Red Natural Dyes in Post-Byzantine 505
Icons by HPLC, J. Liquid Chromatogr. Rel. Technol., 28 (2005) 739-749. 506
21.G. Balakina, V. Vasiliev, E. Karpova, V. Mamatyuk, HPLC and molecular spectroscopic investigations of the red dye 507
obtained from an ancient Pazyryk textile, Dyes Pigm., 71 (2006) 54-60. 508
22.K. Lech, M. Jarosz, Novel methodology for the extraction and identification of natural dyestuffs in historical textiles 509
by HPLC-UV-Vis-ESI MS. Case study: chasubles from the Wawel Cathedral collection, Anal. Bioanal. Chem., 399 510
(2011) 3241-3251. 511
23.J. Liu, D. Guo, Y. Zhou, Z. Wu, W. Li, F. Zhao, X. Zheng, Identification of ancient textiles from Yingpan, Xinjiang, 512
by multiple analytical techniques, J. Archaeol. Sci. 38 (2011) 1763-1770. 513
24.J. Sanyova, J. Reisse, Development of a mild method for the extraction of anthraquinones from their aluminum 514
complexes in madder lakes prior to HPLC analysis, J. Cult. Heritage, 7 (2006) 229-235. 515
25.Rochleder, Untersuchung der Krappwurzel (Investigation of the madder root). Justus Liebigs Ann. Chem., 80 (1851) 516
321-330. 517
26.E. Schunck, Ueber die Einwirkung des Krapp-Ferments auf Zucker (Concerning the effect of madder-ferment sugar). 518
J. Prakt. Chem., 63 (1854) 222-240. 519
27.R. Hill, D. Richter, Anthraquinone pigments in Galium, Proc. Royal Soc. B, 121 (1937) 547-552. 520
28.X. Zhang, R. Laursen, Development of Mild Extraction Methods for the Analysis of Natural Dyes in Textiles of 521
Historical Interest Using LC-Diode Array Detector-MS, J. Anal. Chem., 77 (2005) 2022-2025. 522
29.L. Valianou, I. Karapanagiotis, Y. Chryssoulakis, Comparison of extraction methods for the analysis of natural dyes 523
in historical textiles by high-performance liquid chromatography, Anal. Bioanal. Chem. 395 (2009) 2175-2189. 524
30.D. Mantzouris, I. Karapanagiotis, L. Valianou, C. Panayiotou, HPLC-DAD-MS analysis of dyes identified in textiles 525
from Mount Athos, Anal. Bioanal. Chem. 399 (2011) 3065-3079. 526
31.Joosten, M.R. van Bommel, Critical evaluation of micro-chemical analysis of archaeological materials. Experiences 527
from the Netherlands Institute for Cultural Heritage, Microchim. Acta 162 (2008) 433-446. 528
32. K. Omura, D. Swern, Oxidation of alcohols by activated dimethyl sulfoxide. A preparative, steric and mechanistic 529
study, Tetrahedron 34 (1978) 1651-1660; K. Torssell, Mechanisms of dimethylsulfoxide oxidations, Tetrahedron 530
Letts. 37 (1966) 4445-4451. 531
33.H. Schweppe, Handbuch der Naturfarbstoffe, Landsberg/Lech: Ecomed Verlagsgesellschaft, 1993. 532
35.G.C.H. Derksen, M. Naayer, T.A. van Beek, A. Capelle, I.K. Haaksman, H.A. van Doren, A.E. de Groot, Chemical 534
and enzymatic hydrolysis of anthraquinone glycosides from madder roots, Phytochem. Anal., 14 (2003) 137-144. 535
36.H. Itokawa, Y. Qiao, K. Takeya, Anthraquinones and naphthohydroquinones from Rubia cordifolia, Phytochemistry, 536
28 (1989) 3465-3468. 537
37.M.-J. Liou, P.-L. Wu, T.-S. Wu, Constituents of the Roots of Rubia yunnanensis, Chem. Pharm. Bull. 50 (2002) 276-538
279. 539
38.G. Cuoco, C. Mathe, P. Archier, C. Vieillescazes, Characterization of madder and garancine in historic French red 540
materials by liquid chromatography-photodiode array detection, J. Cult. Herit. 12 (2011) 98-104. 541
39.V.V.S. Murti, T.R. Seshadri, S. Sivakumaran, A Study of Madder, the Roots of Rubia tinctorum Linn., Indian J. Chem., 542
8 (1970) 779-782. 543
40.M.P. Colombini, A. Andreotti, C. Baraldi, I. Degano, J.J. Łucejko, Colour fading in textiles: A model study on the 544
decomposition of natural dyes, Microchem. J. 85 (2007) 174-182. 545
41.R.L. Henderson, The chemical profile of Rubia tinctorum in wool dyeing and a novel fibre extraction method for 546
compositional analysis, PhD Thesis, University of Leeds, 2013. 547
42.D.G. Duff, R.S. Sinclair, D Stirling, Light-induced colour changes of natural dyes. Studies Conserv. 22 (1977) 161-548
164. 549