This is a repository copy of
A Service-Oriented Co-Simulation: Holistic Data Center
Modelling Using Thermal, Power and Computational Simulations
.
White Rose Research Online URL for this paper:
http://eprints.whiterose.ac.uk/122068/
Version: Accepted Version
Proceedings Paper:
Clement, S orcid.org/0000-0003-2918-5881, McKee, D orcid.org/0000-0002-9047-7990
and Xu, J orcid.org/0000-0002-4598-167X (2017) A Service-Oriented Co-Simulation:
Holistic Data Center Modelling Using Thermal, Power and Computational Simulations. In:
Proceedings of the10th International Conference on Utility and Cloud Computing. UCC
2017 : 10th IEEE/ACM International Conference on Utility and Cloud Computing, 05-08
Dec 2017, Austin, Texas, USA. Association for Computing Machinery , pp. 91-99. ISBN
978-1-4503-5149-2
https://doi.org/10.1145/3147213.3147219
© 2017 Copyright held by the owner/author(s). Publication rights licensed to Association
for Computing Machinery. This is the author's version of the work. It is posted here for your
personal use. Not for redistribution. The definitive Version of Record was published in
Proceedings of the10th International Conference on Utility and Cloud Computing,
http://doi.org/10.1145/3147213.3147219
[email protected]
https://eprints.whiterose.ac.uk/
Reuse
Unless indicated otherwise, fulltext items are protected by copyright with all rights reserved. The copyright
exception in section 29 of the Copyright, Designs and Patents Act 1988 allows the making of a single copy
solely for the purpose of non-commercial research or private study within the limits of fair dealing. The
publisher or other rights-holder may allow further reproduction and re-use of this version - refer to the White
Rose Research Online record for this item. Where records identify the publisher as the copyright holder,
users can verify any specific terms of use on the publisher’s website.
Takedown
If you consider content in White Rose Research Online to be in breach of UK law, please notify us by
Modelling Using Thermal, Power and Computational
Simulations
Stephen Clement
School of Computing University of Leeds
Leeds, UK [email protected]
David McKee
School of Computing University of Leeds
Leeds, UK [email protected]
Jie Xu
School of Computing University of Leeds
Leeds, UK [email protected]
ABSTRACT
Holistic modelling of a data center to include both thermodynam-ics and computational processes has the potential to revolutionize how data centers are designed and managed. Such a model is in-herently multi-disciplinary, bringing together the computational elements studied by computer scientists; thermodynamics stud-ied by mechanical engineers; and other aspects in the domain of electrical engineering. This paper proposes the use of the Inter-net of Simulation to allow engineers to build models of individual complex elements and deploy them as simulation services. These services can then be integrated as simulation system worklows. A proof of concept server simulation is presented, incorporating simulations of Central Processing Units (CPUs), heat sinks, and fans exposed using the Simulation as a Service (SIMaaS) paradigm. The integrated worklow of the server is then exposed as a service (WFaaS) to facilitate the building of an entire virtual data center. Unlike other data center simulations, this approach requires no di-rect characterisation of the hardware being simulated. Preliminary results are presented showing the efectiveness of the simulation technique and representative behaviour under various simulated cloud workloads. The beneits and future applications of this rapid prototyping approach extend to data center design and data center eiciency research.
CCS CONCEPTS
·Computing methodologies→Modeling and simulation;
Distributed simulation; ·Computer systems organization→
Cloud computing;Distributed architectures; ·Hardware→Power and energy;
KEYWORDS
Cloud; SOA; Services; Simulation; WFaaS; SIMaaS; IoS; Thermody-namics; Data-center
Permission to make digital or hard copies of all or part of this work for personal or classroom use is granted without fee provided that copies are not made or distributed for proit or commercial advantage and that copies bear this notice and the full citation on the irst page. Copyrights for components of this work owned by others than the author(s) must be honored. Abstracting with credit is permitted. To copy otherwise, or republish, to post on servers or to redistribute to lists, requires prior speciic permission and⁄or a fee. Request permissions from [email protected].
UCC ’17, December 5ś8, 2017, Austin, Texas USA
© 2017 Copyright held by the owner⁄author(s). Publication rights licensed to Associa-tion for Computing Machinery.
ACM ISBN 978-1-4503-5149-2⁄17⁄12. . . $15.00 https:⁄⁄doi.org⁄10.1145⁄3147213.3147219
ACM Reference format:
Stephen Clement, David McKee, and Jie Xu. 2017. A Service-Oriented Co-Simulation: Holistic Data Center Modelling Using Thermal, Power and Computational Simulations. InProceedings of UCC ’17: 10th International Conference on Utility and Cloud Computing, Austin, Texas USA, December 5ś8, 2017 (UCC ’17),9 pages.
https:⁄⁄doi.org⁄10.1145⁄3147213.3147219
1
INTRODUCTION
Data centers globally consume in the region of 3% of the world's electricity up from 1.3% in 2010 and 0.8% in 2005 [13, 21]. Fully understanding their workings in terms of computational processes, system architectures, cooling performance, as well as energy and power eiciencies is therefore of paramount importance as part of the digital economy [22]. However there has been no success-ful holistic simulation of a data center's computation and cooling. Such a simulation brings together the worlds of mechanical, elec-trical, and computational engineering. In this paper we present a proof of concept holistic model of server operation, encompassing computation through utilisation, power and thermal performance. Previous authors have utilised complex simulation methods such as Computational Fluid Dynamics (CFD) simulations and trained models from empirical measurements [8]. However, this characteri-sation and modelling can be time consuming and requires access and measurement of speciic exemplar hardware. Additionally the complexity of the models employed in these applications preclude rapid simulation of the computational, power and thermal perfor-mance. Instead we present an initial proof of concept showing that holistic server behaviour can be realistically characterised using readily available, public data from manufacturer datasheets and datasets. This data is used as parameters in the model allowing for rapid generation of simulations.
UCC ’17, December 5–8, 2017, Austin, Texas USA S. Clement et al.
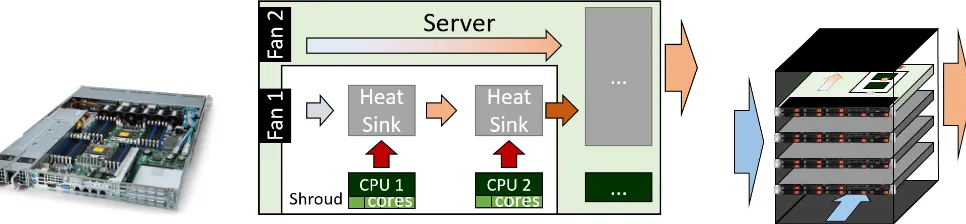
[image:3.612.68.551.86.198.2](a) Example Acer AR360 F2 server (b) The abstract server architecture and air low for the simulation (c) The abstract rack architecture
Figure 1: The simulated system architecture of a rack with four servers and the corresponding airlows
2
BACKGROUND
Simulation of data centers is critical to understanding their global impact and providing a means to explore new approaches to im-prove their energy eiciency. For example globally data centers used 416 terrawatt hours of electricity in 2015 whilst the UK as a nation only consumed in the region of 300 terrawatt hours [21]. There has therefore been a push in recent years to provideholistic modelsof data centers power usage, however there remain signii-cant limitations. One of the main limitations is the integration of the electrical and thermodynamic simulations with computational models of server utilisation. This integration and the resulting trade-ofs that can be explored are critical to managing the costs associated with running a data center. It is therefore essential that improvements to energy eiciency also enable the utilisation of said data centers to be maximised as they are currently severely under-utilised, in some cases as low as 10% [10].
Currently, the eiciency of a data center is measured by the Power Usage Efectiveness (PUE) or Data Center Infrastructure Eiciency (DCiE) value. Both of these metrics compare the amount of energy used by the data center for computation against the total energy used by the data center [3]. Therefore while reducing total energy consumption of the data center is important, it is equally important to ensure that as much energy as possible is used for useful computation. Since cooling systems consume much of the non-IT equipment energy[17], understanding the relationships between data center operation and its heat generation can help to maximise eiciency. Therefore models that encompass computation, power consumption and heat generation can provide a tool to understand these relationships.
2.1
Modelling Power Consumption
Some of the existing simulations of data centers include power models but these are usually simple and generally focus on compute energy rather than the combination of compute and cooling. The CloudSim [4] provides a number of possible power models for servers, however these are based on a linear relationship between power consumption and CPU utilisation [16]. Other authors [2, 14] have presented power consumption models based on Virtual Machine (VM) utilisation and activity.
Garraghan et al. [8] provide a model of power usage in data cen-ter servers aiming to bring together the domains of software, server
hardware, and cooling. The authors experimentally measured the power consumption by the server and fans under various workload utilisations. Subsequent work by Li et al. [15, 27] looked at sim-ulating the cloud workload using CloudSim [4] and matched the resulting data with CFD results to estimate the server temperature for a given workload.
Additionally, there has been recent work in detailed simulation of processor power consumption. Walker et al.[24, 25] develop a thermally aware CPU power model which accounts for diferences in power consumption due to the temperature of the processor. This model is achieved through experimental measurement and characterisation of an ARM CPUs.
These approaches are however not fully integrated and require the simulation designer to be an expert across all aspects of the system model. It is therefore vital that a new paradigm for sim-ulating cyber-physical systems is developed allowing engineers and researchers to build highly detailed and complex models of individual components, such as heat sinks or software systems, and bring them together in an integrated System of Systems simulation.
2.2
Internet of Simulation
In order to facilitate an ecosystem of model sharing and simulation integration McKee et al. [18] propose the concept of Internet of Simulation (IoS). By using the infrastructure of Cloud computing massive-scale simulations can be run rapidly and at speed [9]. IoS therefore aims to facilitate the deployment of simulations as services (SIMaaS) which can then be integrated into other simulations as part of a more typical service-oriented worklow.
The worklows, which would be in essence system simulations, can then themselves be exposed as services (WFaaS). This provides a mechanism to iteratively build massively complex system models and simulations using the relevant expertise to accurately capture the nuances from each domain [5].
The remainder of this paper takes these IoS concepts and applies them to holistic server simulation.
3
MODELLING METHODOLOGY
in a cloud data center depends on the utilisation of all VMs hosted on the machine. The future load of the server is also unknown as this is dependant on demand and the decisions of the scheduler.
Previous approaches to modelling the dynamic behaviour of servers or data centers require characterisation through experi-mentation on the speciic hardware to be used or historical data collected from data centers with that same hardware. Both of these methods are resource intensive and do not allow characterisation without investment in hardware. Therefore we take a modelling approach that aims to characterise data center dynamics without experimental data collection by using readily available benchmark data, manufacturer's speciications and physics modelling. This lowers the cost of data center simulation and allows for research developing scalable, energy eicient data center technologies such as schedulers, cooling systems or new servers.
In order to capture these behaviours a dynamic model is required and each power consuming component is modelled independently and then co-simulated. In the case of this model we choose to model the processors, cooling components (fans and heatsinks) and residual components (power supply, motherboard, memory etc.). In this instance the server we are modelling does not include a GPU. Based on the IoS paradigm each individual component of the system can be modelled independently. Each model therefore has deined interface expressing the inputs and outputs as well as all assumptions that are being made. For example the interface must capture the units of measurement as well as the metric preix, such kilowatts. The individual models can then be exposed as services, using the SIMaaS paradigm, to be integrated. This integrated sim-ulation (Worklow as a Service (WFaaS)) can be made available as a service to be used to test diferent data center coniguration, experimental schedulers or novel cooling techniques.
The remainder of this section focusses on the construction of the individual models that are used to construct the simulation using iterative WFaaS design.
3.1
Abstract Server
[image:4.612.321.567.81.219.2]An Acer AR360 F2 Server was chosen as a representative 1U server; its power ratings are available in the results of the SPECpower benchmark [6]. The server can be seen in Figure 1a and the abstract representation used in this paper's proof of concept is shown in Figure 1b. For the purposes of this paper the server is considered to utilise of two Intel Xeon E5-2660 CPUs as deined in the benchmark results [1]. Figure 1 shows the server has fans located at the front pushing air through the server towards the rear. On the one side are the CPUs located longitudinally with the warm air from CPU1 passing over CPU2 before leaving out the rear of the server, each CPU has a passive heat sink and is assumed to be shrouded. The output air from the second heat sink is mixed uniformly with the ambient air from fan 2 before passing out of the back of the server. This architecture allows us to characterise the remaining power consumption and heat generation of the server as a third heat sink, though this characterisation is not performed in this paper.
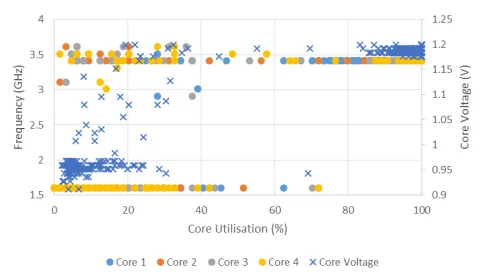
Figure 2: Dynamic voltage and frequency scaling against utilisation
3.2
CPU
In this server the single component responsible for most of the power consumption in a server is the CPU. The total power con-sumption of the CPU is a sum of dynamic and short-circuit power consumptions and losses due to leakage currents[23]:
PC PU =Pdyn+Psc+Pl eak
Most of the power consumed by the CPU is then dissipated as heat which must be removed from the system via cooling.
Modern CPUs have multiple cores, with a multi-threaded work-load each will have a diferent utilisation and therefore each will draw a diferent amount of power and dissipate a diferent amount of heat. The processor package includes a case which functions as a heat spreader. Thermal interface compound provides good thermal conductivity between the processor case and a cooler.
To characterise the power and cooling requirements of a given CPU manufacturers deine a Thermal Design Power (TDP) in Watts. This describes the maximum power consumption of the processor and therefore the maximum heat power that the cooling system must be able to dissipate. These values are deined based on propri-ety workloads that are promised to be realistically complex. TDP does not represent the absolute maximum thermal output, it can be exceeded for short periods [12].
In a modern CPU there are a number of mechanisms that al-low for more optimal power consumption and changes in perfor-mance. The primary method is Dynamic Voltage and Frequecy Scaling (DVFS) which allows the clock frequency of the processor and correspondingly the voltage to be adjusted to reduce power consumption or increase processor performance on demand [25]. Portions of the processor can also be disconnected from the clock signal to reduce switching power consumption, known as clock gating [26], or turned of completely (power gating) [11].
UCC ’17, December 5–8, 2017, Austin, Texas USA S. Clement et al.
is diicult to directly model CPU performance state and power. Instead we use a function of overall utilisation to model CPU power consumption. Figure 3b shows power consumption under the same benchmark load collected from three separate Intel CPUs: i5-2500K, i5-4300U and Xeon E3-1270. While there are diferent core counts, TDPs and cache sizes, igure 3b shows that the power consumption relative to TDP is similar across all of our tests.
Therefore, since the TDPPT DP of the chosen server's CPU is known we it the bounded exponential function:
RT DP =a−be
−cu
100 (1)
to our data in igure 3b and model power consumption as a factor of TDPRT DP based on the overall CPU utilisationu(0% to 100%). Wherea,b andc are itting terms found to be 90, 80 and -0.03 respectively. Actual power consumptionPC PU(W) is then:
PC PU =PT DP∗RT DP
In this abstract server architecture we ignore the efects of ther-mal resistance in the interface compound and assume that heat is transferred directly into the heat sink.
To realistically model a modern CPU we must model multiple cores, this is especially important in cloud workloads where VMs with varying loads execute on diferent CPU cores. Since our mod-els are based on overall utilisation we take the mean of all core utilisation to give an overall utilisation.
3.3
Heat Sink
In our abstract server model the CPU cooler is a passive heat sink, modelled as a heat exchanger using the NTU method as presented by Mofat [19]. Since this is an abstract model, we model the heat as completely uniform across the whole heat sink rather than mod-elling the heat transmission from the base to the ins. Additionally, we assume that that heat generated by the CPU is transmitted into the heat sink without losses. We only model the convective cooling as this is a much larger factor than radiative cooling since the heat sink is tightly enclosed in the 1U case so any energy lost from radiation will transfer to other components.
Using the NTU method, a normal heat exchanger with two luids can be characterised by its efectivenessϵ. This is a ratio of the actual heat transferred and the maximum possible heat transferral between the two luids. Using the luid with the lowest heat capacity
Cminthis is:
ϵ=Tcold˙out
−Tcold˙in
Thot˙in−Tcold˙in
(2)
For a heat sink where there is no hot luid,Chot =∞, and
there-fore the ratio is 0. It can be shown that in this special case the efectivenessϵif given by:
ϵ=1−e−N T U (3)
where the number of transfer unitsNTU is a characterisation of the heat exchanger based on the heat exchanger geometry and the cooling luid mass low. This deined as:
NTU= U A Cmin =
hA Û
mCp (4)
whereCminis the smaller of the two luid's heat capacities, in the case of a heat sink this is the air and is given by the product of the mass lowmÛ and the speciic heat capacityCpof air.U Ais product of the efective exchange areaAand the overall heat transfer coei-cientUof the cooler arrangement. Since we ignore the efects of the thermal compound and heat spreader we only need to characterise the heat sink transfer coeicienthmeasured in W/m2K. Which characterises the heat sink performance as a proportion of heat transfer to temperature diference. This parameter is often diicult to ind and usually requires extensive measurement of the heat sink in operation. However, it is possible to characterise in our model based on a manufacturer's quoted TDP rating. For a given heat sink TDPPTDPthe worst case is given by the maximum temperatures allowable by the CPU manufacturer in the server caseTamband on the heat spreaderTC M ax:
h=A(T PT DP
C M ax−Tamb)
(5)
Given this characterisation ofh,NTUis:
NTU=mCÛ PT DP
p(TC M ax−Tamb)
(6)
To calculate the energy transfer rateQÛ to the cooling air low from the heat sink, we use:
Û
Q=mCÛ pϵ(TBase−TI nl et) (7)
The rate of change in temperature of the cooling air∆ÛT:
Û
∆T =
Û Q Û
mCp (8)
The change in temperature of the heat sink is calculated in a similar manner using the net energy transfer rate based on the input from the CPU and heat lost to the air.
3.4
Fan
Garraghan et al.[8] propose modelling the energy used by cooling equipment in addition to that used for computation. We utilise their presented model for fan power draw and model the generated air low based on manufacturers speciications. Most fan data sheets specify a maximum volumetric lowGmax and speedNmax, these properties are linearly related. The volumetric lowGin m/s can be modelled based on fan speedNas:
G=NGNmax
max
The mass lowmÛin kg/s of the cooling air from the fans is given by:
Û m=ρG
(a) Example benchmark of CPU temperature and power against time
[image:6.612.84.537.87.228.2](b) Measured power consumption relative to TDP against utili-sation
Figure 3: CPU characterisation using experimental benchmarks
Nscal e=
1
1+100e−0.125(TB as e−TAmb)
,
N=Nmin+Nscal e(Nmax−Nmin)
Air density changes with respect to altitude (pressure) and tem-perature, however, as only a single rack is being simulated and we do not yet model the room cooling system, we hold the pressure constant at sea level and ambient temperature constant at 20◦C.
3.5
Residual Power Consumption
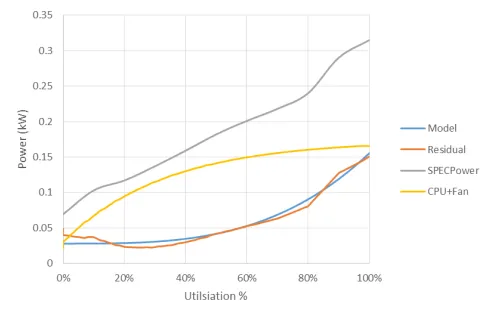
The components modelled so far are not the only sources of power consumption (or heat generation) within the server. The other com-putational components: motherboard, memory, chip set and drives all consume power. In addition, there are power losses in the power supply leading to higher power consumption. Unlike the CPU, these components do not self-report their power consumption. The actual power consumption is not easily derived without extensive mea-surement and benchmarking of the desired server. Instead we chose to compare the sum of the already modelled power consumptions against the recorded SPECPower results, see igure 4. We it the polynomial:
PRes =a+buc (9)
to this data and use this function to model the residual power draw of the remaining system components. Wherea=28,b=127.5 and
c=3.2.
3.6
Worklow
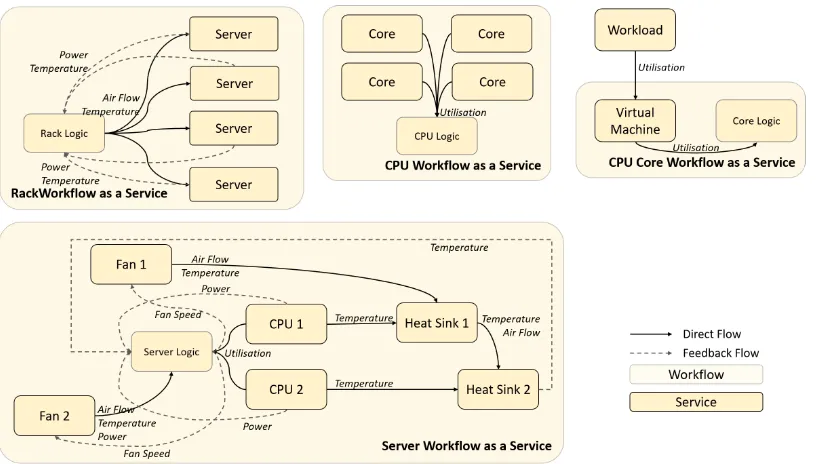
As a proof of concept towards simulating a data center we simulate multiple servers in a rack under a virtual cloud workload. The simulation is constructed by composing the component simulation services as a worklow, shown in igure 5. Presently, we only model the thermal efects of the CPUs and the airlow through the server. We do not model radiant heating between servers, this is analogous to having the servers well spread out in the rack.
Figure 4: Modelled residual power consumption
The server assigns a workload to a VM, each operating on a single core so there is no over commitment. Each CPU has 4 cores so each server can host 8 VMs. The server controls fan speeds based on the temperature of CPU1. The integrated server is then exposed as a simulation using the WFaaS concept further combined into a rack containing 4 servers.
4
EVALUATION
[image:6.612.319.566.293.452.2]UCC ’17, December 5–8, 2017, Austin, Texas USA S. Clement et al.
Figure 5: Component and system simulations as services
behaviour of the system at CPU, server and rack levels reasonably relects that seen in real systems.
4.1
Workload Modelling
In the context of Cloud computing Fehling et al. [7] identiied ive core workload patterns:
(1) Staticworkloads where the resource utilisation over time is constant. This can be extended to consider the workload as static within a variance and can therefore be guaranteed to not exceed a given threshold.
(2) Continuously Changingworkload is where the utilisation is either continuously growing or else continuously shrink-ing.
(3) Periodicwhere the resource utilisation peaks at reoccurring time intervals.
(4) Unpredictablerefers to a random utilisation and can be considered as a generalisation of periodic workloads. (5) Once-in-a-lifetimeworkload refers to general workload
that is predictable disturbed by a peak utilisation which only occurs once. This is a particular case of the periodic workload pattern where the time-frame is particularly long.
[image:7.612.323.558.356.481.2]To test the simulation the continuously changing ramped, and periodic type workloads are used. Additionally, features of the static, unpredictable and once-in-a-lifetime workloads are combined into a single step utilisation parametrised by a constant load, duration and start time. Where a single utilisation pattern is required at the server level, identical workloads are simulated on each of the 8 VMs hosted on the machine resulting in this load being applied at the server level. For rack level simulation each VM is given a diferent workload, either a periodic or a step load with random parameters of phase.
Figure 6: Modelled cumulative power consumption com-pared to results of SPECPower Benchmark for this server
4.2
Individual Server Behaviour
A single server instance was tested in isolation with a uniform VM utilisation across all cores to ensure that the server behaviour is realistic and matches existing data. To capture the behaviour at varying utilisations a ramped load from 0% to 100% utilisation is used. We also tested the server using step loads to verify the modelled thermal behaviour.
Figure 7: Thermal response of step load
is not constant and therefore should be, we note that the overall efect is small.
The thermal behaviour of the server is shown in igure 7. To most clearly show the temperature modelling of the system a step load of 100% utilisation is applied to the CPUs for a short period and the temperature of each heatsink is recorded. The servers start
coldat an ambient room temperature of 20◦C.The igure shows the expected heating and cooling curves for temperature, a large degree of heat begins as soon as the load is initiated. Once the load is reduced, the temperature immediately falls following the expected cooling curve. This matches the observed behaviour in the benchmark, igure 3a, though slower as the heatsinks have more mass than the CPU packages. The linear arrangement of the CPU means that the cooling air low reaching the second CPU's heat sink is warmer and therefore less efective than the irst CPU. This is clearly shown in the graph, the temperature of CPU 2 is 5◦C higher than CPU 1. We also model the inal air temperature exiting the server which has been heated by heat sink 1 and heat sink 2. The temperatures reached by the system are reasonable given the speciications of the CPU and the characteristics of the cooler with neither CPU exceeding its stated maximum case temperature.
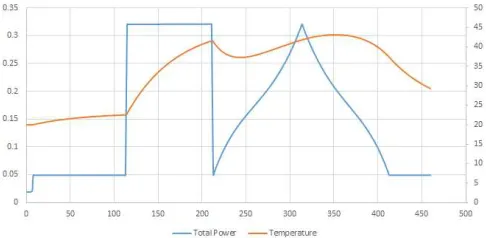
The inal characterisation of the single server involves a step workload followed by a linearly increasing and then decreasing workload. The power and temperature modelled by the server for this workload is shown in igure 8. The shape of the workload can be inferred from the power consumption. Here we see that the thermal behaviour of the system lags behind the power consumption and utilisation as there is additional energy in the system which cannot be expelled before reaching the peak of the ramped load. This is expected, realistic behaviour.
4.3
Cloud Workload Behaviour
[image:8.612.320.563.85.204.2]Since the server has been developed using IoS we can readily com-pose multiple server simulations together into a rack by adding a component which distributes workloads across the servers. To simulate a cloud workload on the server a VM is assigned to each core of the modelled CPUs. Each VM has a diferent workload ap-plied to it. One half of the VMs are given periodic workloads with
Figure 8: Single server behaviour under varying loads
variations in the phase of the period and the other half are given step workloads with a random start time and duration.
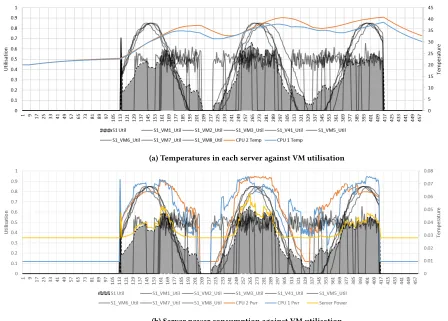
Figure 9 shows the cloud workload applied to one of the servers. The grey lines indicate the workload of each VM and the grey shaded area indicates the average workload of the server. From igure 9 the dynamic behaviour of the system is evident in the power and temperature plots. We can see that the each element in the system behaves diferently under this varying load which could not be modelled without separating the components into discrete simulations
Figure 10 shows the behaviour of the four servers operating in parallel. The workloads are largely in phase so the power and temperature efects on the servers are also largely similar. The diference in overall utilisation of servers ranges between 10-20% but despite this diference, there are no large variances in the power or temperature.
4.4
Strengths and Limitations
The evaluation shows that the dynamic behaviour of the servers is reasonably realistic and will be physically accurate since much of the underlying model is physics based. A major strength of this approach is the lack of any required experimentation or historical data for the server being modelled. The only experimental measure-ments that were required characterised a range of CPU's which allows us to approximate any CPU behaviour based on manufactur-ers speciications. Additionally, the methodology adopted means that the simulation can be easily reconigure to simulate a new server or a diferent rack coniguration. The distributed simulator used allows for potential speed up in execution with more machines. Even on a single machine with an Intel i5 processor and 16GB of RAM execution speeds were only approximately 14x real-time.
UCC ’17, December 5–8, 2017, Austin, Texas USA S. Clement et al.
(a) Temperatures in each server against VM utilisation
[image:9.612.59.507.82.403.2](b) Server power consumption against VM utilisation
Figure 9: Server rack power consumption and temperatures under a simulated cloud workload
(a) Temperatures in each server against VM utilisation (b) Server power consumption against VM utilisation
Figure 10: Server rack power consumption and temperatures under a simulated cloud workload
In addition to a complete validation of model, other elements can be added due to the extensible nature of the simulation worklow. Given a characterisation of their performance, it would be possible to add additional components into the server such as power supplies or DIMM memory. A more detailed thermal simulation could also
[image:9.612.81.529.443.594.2]5
CONCLUSION
In this paper we have presented a medium idelity model of a cloud server where we modelled the relationships between the execution and thermodynamic behaviour of the server. The parameters used in this modelled are based on publicly available datasets and manu-facturer data sheets or itted against data from three diferent com-puters, therefore this model is easily changed to simulate a diferent server than the one chosen here. The behaviour of the modelled server was demonstrated under diferent cloud workloads, with the resulting temperature and power consumptions being reasonably realistic given the lack of experimental measurements available
We followed an IoS approach to construct this simulation and therefore adding more servers or other elements is easily achieved. Each of the sub-components of the worklow shown in Figure 5 are independent and therefore can be changed to add more detail without afecting other components. Additionally, by combining multiple worklows it is possible to scale this simulation to simulate multiple servers and the cooling systems such as in a much larger data center.
Given the server is represented as a WFaaS we can combine multiple servers together with models of air conditioning units and model the total thermal performance and power consumption of a virtual data center. For this purpose the beneits of our approach are the rapid speed in which diferent cooling solutions could be tested without physical prototypes. With a more detailed execution model, the macro efects of software behaviours on power consumption and cooling can investigated, for example the choice of scheduler or the cost of the long tail problem. The modular nature of the simulation due to IoS means that any of these changes are implemented as new services and easily incorporated into the new simulation worklow. Extending the IoS techniques to their limit will allow the con-struction of entire virtual systems, from data centers through to cities [20]. This will facilitate a huge opening of research opportu-nities, studying digital systems at a scale that has never been seen before.
ACKNOWLEDGMENTS
This work forms part of the University of Leeds centre for city simulation: VirtuoCity and has been supported by various grants including UK-EPSRC grant EP⁄K014226⁄1 and the China National Key Research and Development Program (No. 2016YFB1000101 and 20016YFB1000103)
REFERENCES
[1] Acer Incorporated. 2013. Acer Incoporated Acer AR360 F2. (2013). https: ⁄⁄www.spec.org⁄power
[2] A. E. Husain Bohra and V. Chaudhary. 2010. VMeter: Power modelling for virtualized clouds. In2010 IEEE International Symposium on Parallel Distributed Processing, Workshops and Phd Forum (IPDPSW). 1ś8.
[3] Gemma A. Brady, Nikil Kapur, Jonathan L. Summers, and Harvey M. Thompson. 2013. A case study and critical assessment in calculating power usage efec-tiveness for a data centre.Energy Conversion and Management76 (2013), 155 ś 161.
[4] Rodrigo N Calheiros, Rajiv Ranjan, Anton Beloglazov, César A. F. De Rose, and Rajkumar Buyya. 2011. CloudSim: a toolkit for modeling and simulation of cloud computing environments and evaluation of resource provisioning algorithms.
Softw. Pract. Exp.41, 1 (jan 2011), 23ś50.
[5] SJ Clement, DW Mckee, and Jie Xu. 2017. Service-Oriented Reference Architec-ture for Smart Cities. InIEEE International Symposium on Service-Oriented System Engineering. IEEE.
[6] Standard Performance Evaluation Corporation. 2008. SPEC Power Benchmark. (2008). https:⁄⁄www.spec.org⁄power˙ssj2008⁄results⁄
[7] Christoph Fehling, Frank Leymann, Ralph Retter, Walter Schupeck, and Peter Arbitter. 2014.Cloud Computing Patterns. Springer Vienna, Vienna.
[8] Peter Garraghan, Yaser Al-Anii, Jon Summers, Harvey Thompson, Nik Kapur, and Karim Djemame. 2016. A uniied model for holistic power usage in cloud datacenter servers. InProceedings of the 9th International Conference on Utility and Cloud Computing - UCC ‘16. ACM Press.
[9] Peter Garraghan, David McKee, Xue Ouyang, David Webster, and Jie Xu. 2016. SEED: A Scalable Approach for Cyber-Physical System Simulation.IEEE Trans-actions on Services Computing9, 2 (mar 2016), 199ś212.
[10] Albert Greenberg, James Hamilton, David A Maltz, and Parveen Patel. 2008. The cost of a cloud: research problems in data center networks.ACM SIGCOMM computer communication review39, 1 (2008), 68ś73.
[11] Zhigang Hu, Alper Buyuktosunoglu, Viji Srinivasan, Victor Zyuban, Hans Jacob-son, and Pradip Bose. 2004. Microarchitectural techniques for power gating of execution units. InProceedings of the 2004 international symposium on Low power electronics and design. ACM, 32ś37.
[12] Intel Corporation. 2015.Intel Xeon Processor E5-1600/2600/4600 v3 Product Fami-lies: Thermal Mechanical Speciication and Desgin Guide. http:⁄⁄www.intel.com⁄ content⁄www⁄us⁄en⁄processors⁄xeon⁄xeon-e5-v3-thermal-guide.html [13] Jonathan Koomey. 2011. Growth in data center electricity use 2005 to 2010.A
report by Analytical Press, completed at the request of The New York Times9 (2011). [14] Bhavani Krishnan, Hrishikesh Amur, Ada Gavrilovska, and Karsten Schwan. 2011.
VM Power Metering: Feasibility and Challenges.SIGMETRICS Perform. Eval. Rev.
38, 3 (Jan. 2011), 56ś60.
[15] Xiang Li, Peter Garraghan, Xiaohong JIANG, Zhaohui Wu, and Jie Xu. 2017. Holistic Virtual Machine Scheduling in Cloud Datacenters towards Minimizing Total Energy.IEEE Transactions on Parallel and Distributed Systems(2017), 1ś1. [16] W. Long, L. Yuqing, and X. Qingxin. 2013. Using CloudSim to Model and
Simu-late Cloud Computing Environment. In2013 Ninth International Conference on Computational Intelligence and Security. 323ś328.
[17] Tao Lu, Xiaoshu Lü, Matias Remes, and Martti Viljanen. 2011. Investigation of air management and energy performance in a data center in Finland: Case study.
Energy and Buildings43, 12 (2011), 3360 ś 3372.
[18] DW Mckee, SJ Clement, X Ouyang, J Xu, R Romano, and J Davies. 2017. The Internet of Simulation, a Specialisation of the Internet of Things with Simulation and Worklow as a Service (SIM⁄WFaaS). In2017 IEEE Symposium on Service-Oriented System Engineering (SOSE). IEEE.
[19] Robert J. Mofat. 2007. Modeling Air-Cooled Heat Sinks as Heat Exchangers. In
Twenty-Third Annual IEEE Semiconductor Thermal Measurement and Management Symposium. IEEE.
[20] Richard Romano, Natasha Merat, Erik Thomasson, David Hogg, David McKee, and Jie Xu. 2017. Institute for Transport Studies: VirtuoCITY. (2017). https: ⁄⁄www.its.leeds.ac.uk⁄research⁄featured-projects⁄virtuocity⁄
[21] Tom Bawden. 2016. Global warming: Data centres to consume three times as much energy in next decade, experts warn | The In-dependent. (2016). http:⁄⁄www.independent.co.uk⁄environment⁄ global-warming-data-centres-to-consume-three-times-as-much-energy-\ in-next-decade-experts-warn-a6830086.html
[22] Paul Townend, Jie Xu, Jon Summers, Daniel Ruprecht, and Harvey Thompson. 2016. Holistic data centres: Next generation data and thermal energy infrastruc-tures. In2016 IEEE 35th Int. Perform. Comput. Commun. Conf.IEEE, 1ś2. [23] Karel De Vogeleer, Gerard Memmi, Pierre Jouvelot, and Fabien Coelho. 2014. The
Energy⁄Frequency Convexity Rule: Modeling and Experimental Validation on Mobile Devices. InParallel Processing and Applied Mathematics. Springer Berlin Heidelberg, 793ś803.
[24] M. J. Walker, S. Diestelhorst, A. Hansson, D. Balsamo, G. V. Merrett, and B. M. Al-Hashimi. 2016. Thermally-aware composite run-time CPU power models. In
2016 26th International Workshop on Power and Timing Modeling, Optimization and Simulation (PATMOS). 17ś24.
[25] M. J. Walker, S. Diestelhorst, A. Hansson, A. K. Das, S. Yang, B. M. Al-Hashimi, and G. V. Merrett. 2017. Accurate and Stable Run-Time Power Modeling for Mobile and Embedded CPUs.IEEE Transactions on Computer-Aided Design of Integrated Circuits and Systems36, 1 (Jan 2017), 106ś119.
[26] Qing Wu, Massound Pedram, and Xunwei Wu. 2000. Clock-gating and its appli-cation to low power design of sequential circuits.IEEE Transactions on Circuits and Systems I: Fundamental Theory and Applications47, 3 (2000), 415ś420. [27] Zhaohui Wu, Xiang Li, Peter Garraghan, Xiaohong Jiang, Kejiang Ye, and Albert Y.