ia
eurostat
ENERGIEPREISE
ENERGY PRICES
PRIX DE L'ÉNERGIE
1980-1995
"7
/
/
eurostat
STATISTISCHES AMT DER EUROPAISCHEN GEMEINSCHAFTEN
STATISTICAL OFFICE OF THE EUROPEAN COMMUNITIES
OFFICE STATISTIQUE DES COMMUNAUTÉS EUROPÉENNES
L-2920 Luxembourg — Tél. (352) 43 01-1 — Télex COMEUR LU 3423
B-1049 Bruxelles, rue de la Loi 200 — Tél. (32-2) 299 11 11
Eurostat hat die Aufgabe, den
Informa-tionsbedarf der Kommission und aller am
Aufbau des Binnenmarktes Beteiligten
mit Hilfe des europäischen statistischen
Systems zu decken.
Um der Öffentlichkeit die große Menge an
verfügbaren Daten zugänglich zu machen
und Benutzem die Orientierung zu
erleichtem, werden zwei Arten von
Publi-kationen angeboten: Statistische
Doku-mente und Veröffentlichungen.
Statistische Dokumente sind für den
Fachmann konzipiert und enthalten das
ausführliche Datenmaterial:
Bezugs-daten, bei denen die Konzepte allgemein
bekannt, standardisiert und
wissenschaft-lich fundiert sind. Diese Daten werden in
einer sehr tiefen Gliederung dargeboten.
Die Statistischen Dokumente wenden
sich an Fachleute, die in der Lage sind,
selbständig die benötigten Daten aus der
Fülle des dargebotenen Materials
auszu-wählen. Diese Daten sind in gedruckter
Form und/oder auf Diskette,
Magnet-band, CD-ROM verfügbar. Statistische
Dokumente unterscheiden sich auch
optisch von anderen Veröffentlichungen
durch den mit einer stilisierten Graphik
versehenen weißen Einband.
Veröffentlichungen wenden sich an eine
ganz bestimmte Zielgruppe, wie zum
Beispiel an den Bildungsbereich oder an
Entscheidungsträger in Politik und
Ver-waltung. Sie enthalten ausgewählte und
auf die Bedürfnisse einer Zielgruppe
abgestellte und kommentierte
Informa-tionen. Eurostat übernimmt hier also eine
Art Beraterrolle.
Für einen breiteren Benutzerkreis gibt
Eurostat Jahrbücher und periodische
Veröffentlichungen heraus. Diese
enthal-ten statistische Ergebnisse für eine erste
Analyse sowie Hinweise auf weiteres
Datenmaterial für vertiefende
Unter-suchungen. Diese Veröffentlichungen
werden in gedruckter Form und in
Daten-banken angeboten, die in Menütechnik
zugänglich sind.
Um Benutzem die Datensuche zu
erleich-tem, hat Eurostat Themenkreise, d. h.
eine Untergliederung nach Sachgebieten,
eingeführt. Daneben sind sowohl die
Statistischen Dokumente als auch die
Veröffentlichungen in bestimmte Reihen,
wie zum Beispiel „Jahrbücher",
„Kon-It is Eurostat's responsibility to use the
European statistical system to meet the
requirements of the Commission and all
parties involved in the development of the
single market.
To ensure that the vast quantity of
ac-cessible data is made widely available,
and to help each user make proper use of
this information, Eurostat has set up two
main categories of document: statistical
documents and publications.
The statistical document is aimed at
spe-cialists and provides the most complete
sets of data: reference data where the
methodology is well-established,
stand-ardized, uniform and scientific. These
data are presented in great detail. The
statistical document is intended for
ex-perts who are capable of using their own
means to seek out what they require. The
information is provided on paper and/or
on diskette, magnetic tape, CD-ROM. The
white cover sheet bears a stylized motif
which distinguishes the statistical
docu-ment from other publications.
The publications proper tend to be
com-piled for a well-defined and targeted
public, such as educational circles or
political and administrative
decision-makers. The information in these
docu-ments is selected, sorted and annotated
to suit the target public. In this instance,
therefore, Eurostat works in an advisory
capacity.
Where the readership is wider and less
well-defined, Eurostat provides the
infor-mation required for an initial analysis,
such as yearbooks and periodicals which
contain data permitting more in-depth
studies. These publications are available
on paper or in videotext databases.
To help the user focus his research,
Eurostat has created themes', i.e. subject
classifications. The statistical documents
and publications are listed by series: e.g.
yearbooks, short-term trends or
method-ology in order to facilitate access to the
statistical data.
Y. Franchet
Director-General
Pour établir, évaluer ou apprécier les
dif-férentes politiques communautaires, la
Commission européenne a besoin
d'infor-mations.
Eurostat a pour mission, à travers le
sys-tème statistique européen, de répondre
aux besoins de la Commission et de
l'en-semble des personnes impliquées dans
le développement du marché unique.
Pour mettre à la disposition de tous
l'im-portante quantité de données accessibles
et faire en sorte que chacun puisse
s'orienter correctement dans cet
ensem-ble, deux grandes catégories de
docu-ments ont été créées: les docudocu-ments
statistiques et les publications.
Le document statistique s'adresse aux
spécialistes. Il fournit les données les plus
complètes: données de référence où la
méthodologie est bien connue,
standar-disée, normalisée et scientifique. Ces
données sont présentées à un niveau très
détaillé. Le document statistique est
des-tiné aux experts capables de rechercher,
par leurs propres moyens, les données
requises. Les informations sont alors
disponibles sur papier et/ou sur disquette,
bande magnétique, CD-ROM. La
couver-ture blanche ornée d'un graphisme stylisé
démarque le document statistique des
autres publications.
Les publications proprement dites
peu-vent, elles, être réalisées pour un public
bien déterminé, ciblé, par exemple
l'enseignement ou les décideurs
politi-ques ou administratifs. Des informations
sélectionnées, triées et commentées en
fonction de ce public lui sont apportées.
Eurostat joue, dès lors, le rôle de
conseil-ler.
Dans le cas d'un public plus large, moins
défini, Eurostat procure des éléments
nécessaires à une première analyse, les
annuaires et les périodiques, dans
les-quels figurent les renseignements
adé-quats pour approfondir l'étude. Ces
publications sont présentées sur papier
ou dans des banques de données de type
vidéotex.
ENERGIEPREISE
Eine Übersicht über die Verbraucherpreise
für Gas, Elektrizität und Erdölprodukte
in der Europäischen Union bis 1995
ENERGY PRICES
A summary of consumer prices
for gas, electricity and oil
in the European Union up to 1995
PRIX DE L'ÉNERGIE
Un aperçu des prix à la consommation
du gaz, de l'électricité et des produits pétroliers
à l'intérieur de l'Union européenne,
mis à jour jusqu'en 1995
Bibliographische Daten befinden sich am Ende der Veröffentlichung.
Cataloguing data can be found at the end of this publication.
Une fiche bibliographique figure à la fin de l'ouvrage.
Für alle Informationen über diese Veröffentlichung wenden Sie sich bitte an:
For information concerning this publication, contact:
Pour toute information concernant cette publication, s'adresser à:
Eurostat, tèi. (352) 43 01 -32040
Manuskript abgeschlossen im November 1995
Manuscript completed in November 1995
Manuscrit terminé en novembre 1995
Luxembourg: Office des publications officielles des Communautés européennes, 1996
ISBN 92-827-5710-2
© EGKS-EG-EAG, Brüssel · Luxemburg, 1995
Nachdruck — ausgenommen zu kommerziellen Zwecken — mit Quellenangabe gestattet
© ECSC-EC-EAEC, Brussels · Luxembourg, 1995
Reproduction is authorized, except for commercial purposes, provided the source is acknowledged.
© CECA-CE-CEEA, Bruxelles · Luxembourg, 1995
INHALTS / CONTENTS / SOMMAIRE
Einleitung
Introduction
Introduction
5
11
17
Quellenangaben und Anmerkungen zur Methodik
Notes on sources and methods
Note concernant les sources et la méthodologie
7
13
19
Statistische Tabellen / Statistical Tables / Tableaux Statistiques
Endverbraucherpreise für Energie in Landeswährung, ECU und KKS
Final consumer prices of energy in national currencies, ECU and PPS
Prix à la consommation finale de l'énergie en monnaies nationales,
ECU et SPA
Preisvergleich auf Endenergieebene - Sektoren Industrie und Haushalte
(mit Grafiken)
Comparison between supplied energy prices - Industrial and household sector
(with graphics)
Comparaison entre les prix de l'énergie finale - Secteurs industriels et domestiques
(avec graphiques)
Preisvergleich auf Nutzenergieebene - Sektoren Industrie und Haushalte
Comparison between useful energy prices - Industrial and household
Comparaison entre les prix de l'énergie utile - secteurs industriels et domestiques
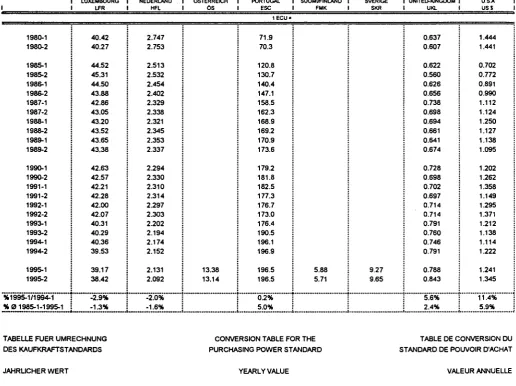
Umrechnungstabellen
Conversion tables
Tables de conversion
23
143
159
EUROSTAT - ENERGIEPREISE 1980-1995
1. EINLEITUNG
EUROSTAT sammelt und veröffentlicht zahlreiche Angaben über die Energiepreise in den
Mitgliedstaaten. Mit der vorliegenden Veröffentlichung soll in möglichst knapper Form über die Preise
der letzten Jahre für die grossen Energieträger informiert werden. Es wurde daher bewusst nur die
Entwicklungen bis zu dem Zeitpunkt, zu dem Informationen für alle Energieträger verfügbar waren
betrachtet. Einzelne Preisangaben für spezifische Energieträger können aus der Fachpresse und
insbesondere aus:
- dem wöchentlichen "Oel-Preis-Bulletin"
- den halbjährlichen "Statistik Kurzgefasst" über Gas und Elektrizität
- den jährlichen Veröffentlichungen "Gaspreise" und "Elektrizitätspreise"
der Kommission entnommen werden.
EUROSTAT - ENERGIEPREISE 1980-1995
ZEICHEN UND ABKÜRZUNGEN
1980=100
0
Kein Nachweis vorhanden
Basisjahr
jährlicher durchschnittlicher prozentualer Anstieg
kWh
GWh
h
a
GJ
Ho
Hu
HS
tRÖE
MWSt
Kilowattstunden
Gigawattstunden (10
6kWh)
Stunde
Jahr
Gigajoule (10
3MJ)
oberer Heizwert
unterer Heizwert
hoher Schwefelgehalt
Tonne Rohöleinheiten
Mehrwertsteuer
BFR
DKR
ØRE
DM
Pf
DR
PTA
FF
Cent.
IRE
Pence
LIT
LFR
HFL
Cent
ÖS
ESC
FMK
CFM
SKR
UKE
Pence
NKR
CNK
Belgischer Franc
Dänische Krone
1/100 Dänische Krone
Deutsche Mark
Pfennig
Drachmen
Spanische Peseta
Französischer Franc
1/100 Französischer Franc
Irisches Pfund
1/100 Irisches Pfund
Italienische Lira
Luxemburgischer Franc
Holländischer Gulden
1/100 Holländischer Gulden
Österreichischer Schilling
Portugiesischer Eskudo
Finnische Markka
1/100 Finnische Markka
Schwedische Krone
Pfund Sterling
1/100 Pfund Sterling
Norwegische Krone
1/100 Norwegische Krone
ECU
KKS
BIP
Europäische Währungseinheit
Kaufkraftstandard
Bruttoinlandsprodukt
EUR 15
EUROSTAT
EUROSTAT - ENERGIEPREISE 1980-1995
2. QUELLENANGABEN UND ANMERKUNGEN ZUR
METHODIK
A. Mengeneinheiten
Für die Endverbraucher sind die Preise in nationalen Währungseinheiten pro spezifische Einheit
(Gigajoule, Kilowattstunde, Liter, Tonne) ausgedrückt. Drei Arten von Preisen werden angegeben
(Tabellen Seiten 23 bis 142)
- Preise einschliesslich Steuern
- Preise ausschliesslich Mehrwertsteuer und ausschliesslich absetzbare Steuern (für die Industrie)
- Preise ausschliesslich alle Steuern.
Der Preis einschliesslich Steuern ¡st der vom privaten Verbraucher tatsächlich gezahlte Preis. Er
umfasst den Preis ausschliesslich Steuern plus die Summe aller vom Verbraucher zu tragenden
Steuern.
Im Falle des Industriellen Energieverbrauchers ist der Preis der für die Vergleiche, benutzt wurde der
Preis ohne und sonstige abzugsfähige Steuern.
B. Verwendete Währungseinheiten
Die Endverbraucherpreise sind in Landeswährung und in gemeinsamen Einheiten (ECU und KKS)
ausgewiesen worden, um Preisvergleiche zwischen den Ländern zu ermöglichen. Die drei Einheiten
enthalten die Preise mit jeweils allen Steuern, ohne Mehrwertsteuer und absetzbaren Steuern und
ohne Steuern.
Der ECU spiegelt Wechselkursschwankungen wider, die durch Faktoren verursacht werden können,
die von der inländischen Preisentwicklung unabhängig sind. Der ECU-Kurs bringt daher nicht
unbedingt die Kaufkraft einer Währung auf dem inländischen Markt zum Ausdruck.
Der KKS (Kaufkraftstandard) wird in der Weise berechnet, dass die Kaufkraftparität zwischen dem
KKS und den einzelnen Landeswährungen die Anzahl nationaler Währungseinheiten ausdrückt, die
erforderlich ist, um in jedem Land der Europäischen Union die gleiche Menge an Waren und
Dienstleistungen zu kaufen.
Es handelt sich also um eine Masseinheit, welche die Kaufkraftrelationen zwischen den Währungen
der zu vergleichenden Länder berücksichtigt.
Vor 1991 wurde das Prinzip der Fünfjährlichen Basiserhebungen angewandt. (Basiserhebungen
haben bisher für die Jahre 1975, 1980, 1985, und neuerdings für 1990 stattgefunden). In der
vorliegenden Veröffentlichung werden seit 1991 jedes Jahr nur die KKP an der Aggregationsstufe des
BIP für EUR 12 verwendet.
Die Ergebnisse vor 1990 wurden zurück bis zum Jahr 1960 extrapoliert.
EUROSTAT - ENERGIEPREISE 1980 - 1995
C. Energieträger
— Gas (Tabellen Selten 23 bis 54)
Die Preise stammen aus einer regelmässigen Erhebung des EUROSTAT bei
Gasversorgungsunternehmen in den Ländern der Europaischen Union. Die dabei angewandte
Methodik ist in der EU ROST AT-Veröffentlichung "Gaspreise" beschrieben.
Die in dieses Bulletin aufgenommenen Verbrauchertypen entsprechen folgenden Kategorien der
EUROSTAT-Veröffentlichung :
• Haushaltsverbraucher :
D
2D
3-b
Jahresverbrauch
16.74 GJ (das sind 4652)
125.60 GJ (das sind 34890 kWh)
Haushaltsausstattung
Kochen und Warmwasser
Kochen, Warmwasser und Zentralheizung
Industrielleverbraucher :
I3-1
I4.1
Jahresverbrauch
41 860 GJ (oder11.63 GWh)
418 600 GJ (oder 116.3 GWh)
Benutzungsdauer
200 Tage 1 600 Stunden
250 Tage 4 000 Stunden
Für die Inlandspreise wurde eine repräsentative Stadt oder Region berücksichtigt.
— Elektrizität (Seiten 55 bis 102)
Die Preise stammen aus einer regelmässigen Erhebung des EUROSTAT bei
Elektrizitätsversorgungsunternehmen in den Ländern der Europaischen Union. Die dabei angewandte
Methodik ist in der EUROSTAT-Veröffentlichung "Elektrizitätspreise" beschrieben.
Die in dieses Bulletin aufgenommenen Verbrauchertypen entsprechen folgenden Kategorien der
EUROSTAT-Veröffentlichung :
• Haushaltverbraucher :
D
bDc
Jahresverbrauch
kWh
Insgesamt
1 200
3 500
(darunter
Nachtstrom)
-(1 300)
Bestellte
Leistung
(Richtwert) in
kW
3-4
4-9
Wohnungstyp
70 m
23 Zimmer + Küche
EUROSTAT - ENERGIEPREISE 1980-1995
Industrieverbraucher :
ld
if
'g
Jahresverbrauch
kWh
1 250 000
10 000 000
24 000 000
Maximaler
Leistungsbedarf kW
(Höchstlast)
500
2 500
4 000
Jahresnutzungsdauer
(1)
2 500 St.
4 000 St.
6 000 St.
(
1) Jahresnutzungsdauer des maximalen Leistungsbedarfs.
Für die Inlandspreise wurde eine repräsentative Stadt oder Region berücksichtigt.
— Mineralölerzeugnisse (Tabellen Seiten 103 bis 142)
Die geltenden Preise, die der Kommission monatlich von den Mitgliedstaaten gemäss Richtlinie
76/491/EWG vom 4. Mai 1976 mitgeteilt werden. Ausgewiesen sind die am 15. Januar und 15. Juli
gültigen Preise für :
Super Benzin, bleifrei Super-Benzin und Dieselöl : Tankstellenpreise
Leichtes Heizöl : Preise für Lieferungen von 2 000 bis 5 000 Liter
Schweres Heizöl : Preise für Lieferungen von weniger als 2 000 Tonnen pro Monat bzw. weniger als
24 000 Tonnen pro Jahr.
Tabellen Seiten 23 bis 142 : Endverbraucherpreisreihen
Die Preise sind für Januar und Juli ausgewiesen.
Tabellen und Grafiken Seiten 143 bis 158 : Preisvergleich auf Endenergieebene
Diese Tabellen enthalten die Preise der in Ihrem jeweiligen Verbrauchersektor als konkurrierend
angesehenen Energieträger, ausgedrückt in ECU pro GJ (Hu).
Tabellen Seiten 159 bis 166 : Preisvergleich auf Nutzenergieebene
Diese Tabellen basieren auf den in Tabellen Seiten 23 bis 142 dargestellten Preisen. Sie geben die
Preise für Nutzenergie in ECU/GJ an (Tabellen Seiten 159 bis 166).
D. UNTERER HEIZWERT (Hu)
Petroleum
Schweres Heizöl
Leichtes Heizöl
Leichtes Heizöl
Gas
1 t ROE
1 000 kg
1 000 kg
1 000 I
1 GJHo
=
=
=
=
=
41.86
40.00
42.30
36.38
0.90
EUROSTAT - ENERGY PRICES 1980-1995
1. INTRODUCTION
EUROSTAT collects and publishes a wide range of information on energy prices in the Member
States. The aim of this publication is to summarize as succintly as possible the most recent price
information for the principal energy sources. It is therefore deliberately confined to trends up to the
date at which information for all these energy sources was available. More detailed prices for
particular sources can be found in the specialist press and notably in:
- the weekly "Oil Price Bulletin"
- the halfyearly "Statistics in focus" for "Gas" and "Electricity"
- the yearly publication "Gas prices" and "Electricity prices"
published by the Commission.
EUROSTAT - ENERGY PRICES 1980-1995
SYMBOLS AND ABBREVIATIONS
1980 = 1 0 0
0
kWh
GWh
h
a
GJ
GCV
NCV
HSC
toe
VAT
BFR
DKR
ØRE
DM
Pf
DR
PTA
FF
Cent.
IRE
Pence
LIT
LFR
HFL
Cent
ÖS
ESC
FMK
CFM
SKR
UK£
Pence
NKR
CNK
ECU
PPS
GDP
EUR 15
EUROSTAT
No data available
Reference year
Annual average percentage increase
Kilowatthour
Gigawatthour(10
6kWh)
Hour
Year
Gigajoule (10
3MJ)
Gross calorific value
Net calorific value
High sulphur content
Ton of oil equivalent
Value added tax
Belgian franc
Danish crown
1/100 Danish crown
German mark
Pfennig
Drachma
Peseta
French franc
1/100 French franc
Irish pound
1/100 Irish pound
Italian lira
Luxembourg franc
Dutch guilder
1/100 Dutch guilder
Austrian Schilling
Escudo
Finnish Markka
1/100 Finnish Markka
Swedish crown
Pound sterling
1/100 Pound sterling
Norwegian crown
1/100 Norwegian crown
European currency unit
Purchasing power standard
Gross domestic product
EUROSTAT - ENERGY PRICES 1980-1995
2. NOTES ON SOURCES AND METHODS
A. Quantity units employed
For end-users, the prices are indicated in pages 23 to 142 in currency units per specific unit (gigajoule,
kilowatt hour, tonne, litre). Three types of prices were used :
- prices including all taxes
- prices excluding VAT and excluding specific deductible taxes (for industrial consumers)
- prices excluding all taxes.
The prices including all taxes are the prices actually paid by the household consumer. They therefore
comprise the price excluding tax plus all taxes borne by the consumer.
In the case of industrial consumers, the price used for comparison excludes both VAT and other
specific deductible taxes.
B. Monetary units employed
End-user prices are expressed in both national currencies and in common units (ECU and PPS) so as
to be able to compare prices between countries.
The ECU reflects exchange rate fluctuations which can be caused by factors other than internal price
movements. It therefore does not necessarily reflect the purchasing power of a currency in its national
territory.
The PPS (Purchasing Power Standard) is calculated in such a way that the purchasing power parity
between the PPS and each national currency expresses the number of national currency units
required to purchase in each Member State of the Union the same volume of goods and services.
This is a measurement unit which takes into account the purchasing power relationships between the
respective currencies of the countries to be compared.
Before 1991, the principle was five-yearly surveys. (Basic surveys have been carried out for the years
1975, 1980, 1985 and 1990). Since then, the level of the PPS has been arbitrarily fixed so that each
year the GDP of EUR 12 expressed in PPS coincides with the same GDP in ECU.
The data prior to 1990 have been extrapolated backwards to 1960.
EUROSTAT - ENERGY PRICES 1980 - 1995
C. Sources
— Gas (Pages 23 to 54)
These prices are taken from regular EUROSTAT surveys of the gas utilities in the European Union
countries. The methodology is described in the EUROSTAT publication "Gas Prices".
The standard consumer categories used in this bulletin correspond to the following categories in the
EUROSTAT publication :
• domestic consumers:
D
2D
3-b
Annual consumption
16.74 GJ (i.e. 4652)
125.60 GJ (i.e. 34890 kWh)
Equipment
cooking and water heating
cooking, water heating and central heating
industrial consumers:
I3-1
I4-1
Annual consumption
41 860 GJ (or 11.63 GWh)
418 600 GJ (or 116.3 GWh)
Load factor
200 days 1 600 hours
250 days 4 000 hours
For national prices a representative town or region has been used.
— Electricity (Pages 55 to 102)
These prices are taken from regular EUROSTAT surveys of the electricity utilities in the European
Union countries. The methodology is described in the EUROSTAT publication "Electricity Prices".
The standard consumer categories used in this bulletin correspond to the following categories in the
EUROSTAT publication :
• domestic consumers:
D
bDc
Annual consumption
kWh
Total
1 200
3 500
of which night
(1 300)
Approx.
subscribed
demand
in kW
3-4
4-9
Standard dwelling
70 m
23 rooms + kitchen
EUROSTAT - ENERGY PRICES 1980-1995
industrial consumers:
ld
if
Ig
Annual consumption
kWh
1 250 000
10 000 000
24 000 000
Maximum demand
in kW
500
2 500
4 000
Annual load
(1)
2 500 h
4 000 h
6 000 h
C) Annual duration of maximum demand
For national prices a representative town or region has been used.
— Petroleum products (Pages 103 to 142)
Ruling prices notified by Member States to the Commission each month pursuant to Directive
76/491/EEC of 4 May 1976. The prices given are those recorded at 15 January and 15 July for :
Gasoline, premium unleaded gasoline and automotive diesel oil: pump prices
Heating gas oil: prices for deliveries of between 2000 and 5000 litres
Residual fuel oil: prices for monthly deliveries of less than 2000 tonnes or annual deliveries of less
than 24000 tonnes
Pages : 23 to 142 : Series of end consumer prices
Prices are given for January and July.
Pages 143 to 158 : Comparison of supplied energy prices (and graphics)
These tables show the prices of energy sources which can be regarded as competing in their sector of
utilization. Prices are expressed in ECU per GJ (NCV).
Pages 159 to 166 : Comparison of useful energy prices
These tables are based on the prices shown in pages 23 to 142. They express prices in ECU/GJ of
useful energy (pages 159 to 166).
D. NET CALORIFIC VALUE (NCV)
Crude Oil
Residual fuel
Gasoil
Gasoil
Gas
Electricity
1 toe
1 000 kg
1 000 kg
1 000 I
1 GJ/GCV
100kWh
=
=
=
=
=
=
41.86
40.00
42.30
36.38
0.90
0.36
EUROSTAT - PRIX DE L'ENERGIE 1980-1995
1. INTRODUCTION
EUROSTAT recueille et publie de nombreuses informations sur les prix de l'énergie dans les Etats
membres. Le but de cette publication est de rassembler de la manière la plus synthétique possible
les informations les plus récentes sur les prix couvrant les principales sources d'énergie. Elle se
limite par conséquent à l'évolution observée jusqu'au moment où les informations pour toutes ces
sources ont été disponibles. Pour certaines sources d'énergie, le lecteur intéressé trouvera des
données de prix plus détaillées dans les publications spécialisées de la Commission, et en
particulier, dans :
- le "bulletin Pétrolier", hebdomadaire
- les "Statistiques en bref" semestrielles sur le "Gaz" et "l'Electricité"
- les publications annuelles "Prix du Gaz" et "Prix de l'Electricité".
EUROSTAT - PRIX DE L'ENERGIE 1980-1995
SIGNES ET ABREVIATIONS
1980 = 100
0
kWh
GWh
h
a
GJ
PCS
PCI
HTS
tep
TVA
BFR
DKR
ØRE
DM
Pf
DR
PTA
FF
Cent.
IRE
Pence
LIT
LFR
HFL
Cent
ÖS
ESC
FMK
CFM
SKR
UK£
Pence
NKR
CNK
ECU
SPA
PIB
EUR 15
EUROSTAT
Donnée non disponible
Année de base
Pourcentage annuel moyen d'évolution
Kilowattheure
Gigawattheure (10
6kWh)
Heure
Année
Gigajoule (103MJ)
Pouvoir calorifique supérieur
Pouvoir calorifique inférieur
Haute teneur en soufre
Tonne d'équivalent pétrole
Taxe à la valeur ajoutée
Franc belge
Couronne danoise
1/100 Couronne danoise
Deutsche Mark
1/100 Deutsche Mark
Drachme
Peseta
Franc français
1/100 Franc français
Livre irlandaise
1/100 Livre irlandaise
Lire italienne
Franc luxembourgeois
Florin néerlandais
1/100 Florin néerlandais
Schilling autrichien
Escudo
Markka
1/100 Markka
Couronne suédoise
Livre sterling
1/100 Livre sterling
Couronne norvégienne
1/100 Couronne norvégienne
Unité monétaire européenne
Standard de pouvoir d'achat
Produit intérieur brut
EUROSTAT - PRIX DE L'ENERGIE 1980-1995
2. NOTES CONCERNANT LES SOURCES ET LA
METHODOLOGIE
A. Unités de mesure quantitative
Au niveau de la consommation finale, les tableaux pages 23 à 142 présentent les prix en unités
monétaires nationales par unité spécifique (gigajoule, kilowatt-heure, tonne, litre). Trois niveaux de prix
ont été retenus :
- prix toutes taxes comprises
- prix hors TVA et hors taxes spécifiques déductibles (pour les consommateurs industriels)
- prix hors taxes.
Le prix toutes taxes comprises est le prix réellement payé par le consommateur domestique. Il
correspond donc au prix hors taxes plus l'ensemble des taxes qui restent à la charge du
consommateur.
Dans le cas des consommateurs industriels, le prix utilisé pour les comparaisons est le prix hors TVA
et hors taxes spécifiques déductibles.
B. Unités monétaires
Les prix à la consommation finale sont exprimés en monnaie nationale et ont été convertis dans les
unités communes (ECU et SPA) dans le but de permettre une comparaison entre pays. Pour les 3
unités ils comprennent les prix toutes taxes comprises, hors TVA et taxes spécifiques et hors taxes.
L'ECU reflète les fluctuations des taux de change qui peuvent aussi se produire sous l'effet de facteurs
indépendants des mouvements de prix intérieurs. Il ne reflète donc pas nécessairement le pouvoir
d'achat d'une monnaie sur le territoire national.
Le SPA (Standard de Pouvoir d'Achat) est calculé de façon à ce que la parité du pouvoir d'achat entre
le SPA et chaque monnaie exprime le nombre d'unités de monnaie nationale nécessaire pour acheter
dans chaque pays de l'Union le même volume de biens et de services.
Il s'agit donc d'une unité de mesure des valeurs qui tient compte des rapports de pouvoir d'achat de la
monnaie des pays à comparer.
Avant 1991, le principe était celui des enquêtes de base quinquennale. (Des enquêtes de base ont eu
lieu en 1975, 1980, 1985 et dernièrement en 1990). Depuis le niveau du SPA a été arbitrairement fixé
de telle sorte que chaque année le PIB de EUR 12 exprimé en SPA coïncide avec ce même PIB en
ECU.
Les données d'avant 1990 ont été rétrapolées jusqu'à 1960.
EUROSTAT - PRIX DE L'ENERGIE 1980-1995
C. Sources
— Gaz (tableaux pages 23 à 54)
Les prix proviennent de l'enquête régulière menée par EUROSTAT parmi les sociétés de distribution
de gaz dans les différents pays de l'Union Européenne. La méthodologie est décrite dans la
publication EUROSTAT "Prix du Gaz".
Les consommateurs-type retenus pour ce Bulletin correspondent aux catégories suivantes de la
publication EUROSTAT :
• consommateurs domestiques :
D
2D
3-b
Consommation annuelle
16.74 GJ (soit 4652)
125.6 GJ (soit 34890 kWh)
Equipement
cuisine et eau chaude
cuisine, eau chaude et chauffage central
consommateurs industriels :
I3-1
I4-1
Consommation annuelle
41 860 GJ (soit 11.63 GWh)
418 600 GJ (soit 116.3 GWh)
Modulation
200 jours 1 600 heures
250 jours 4 000 heures
En ce qui concerne les prix dans les différents pays, la méthode du choix d'une ville ou d'une région
représentative a été retenue.
Electricité (Tableaux pages 55 à 102)
Les prix proviennent de l'enquête régulière menée par EUROSTAT parmi les sociétés de distribution
d'électricité dans les différents pays de l'Union Européenne. La méthodologie est décrite dans la
publication EUROSTAT "Prix de l'électricité".
Les consommateurs-type retenus pour ce Bulletin correspondent aux catégories suivantes de la
publication EUROSTAT :
• consommateurs domestiques :
D
bDc
Consommation annuelle
en kWh
Total
1 200
3 500
dont nuit
(1 300)
Puissance
souscrite
indicative en
kW
3-4
4-9
Logement type
70 m
23 pièces + cuisine
EUROSTAT - PRIX DE L'ENERGIE 1980-1995
consommateurs industriels
ld
if
Ig
Consommation annuelle
kWh
1 250 000
10 000 000
24 000 000
Puissance maximale
appelée en kW
500
2 500
4 000
Modulation
d)
2 500 h
4 000 h
6 000 h
0) Durée d'utilisation annuelle de la puissance maximale appelée.
En ce qui concerne les prix dans les différents pays, la méthode du choix d'une ville ou d'une région
représentative a été retenue.
— Produits pétroliers (Tableaux pages 103 à 142)
Prix pratiqués tels qu'ils sont notifiés par les Etats membres chaque mois à la Commission
conformément à la Directive 76/491/CEE du 4 mai 1976. Les prix indiqués sont les prix relevés au 15
janvier et au 15 juillet pour les consommations suivantes :
Essence super, essence super sans plomb et gasoil routier : prix à la pompe
Gasoil chauffage : prix pour livraisons de 2000 à 5000 litres
Fuel oil résiduel : prix pour livraisons inférieures à 2000 tonnes par mois ou 24000 tonnes par an.
Tableaux pages 23 à 142 : Séries de prix à la consommation finale
Les tableaux présentent les prix pour les mois de janvier et juillet.
Tableaux et graphiques pages 143 à 158: Comparaison entre prix de l'énergie finale
Dans ces tableaux ont été réunis les prix des énergies qui peuvent être considérées comme
concurrentes dans leur secteur d'utilisation. Les prix sont exprimés en ECUS par Gigajoule (PCI).
Tableaux pages 159 à 166: Comparaison entre les prix de l'énergie utile
Ces tableaux sont établis sur la base des prix des tableaux pages 23 à 142. Ils expriment les prix en
ECU/GJ utile (Tabi, pages 159 à 166).
D. POUVOIR CALORIFIQUE SUPERIEUR (PCI)
Pétrole brut
Fuel oil résiduel
Gasoil chauffage
Gasoil chauffage
Gaz
Electricité
1 tep
1 000 kg =
1 000 kg =
1 000 I
1 GJ PCS =
100kWh =
41.86
40.00
42.30
36.38
0.90
0.36
Í7TU?PAS
16,7α GJ/JAHR
HATUPAl. SAS
16,74 GJ/YEAR
GAZ NATUREL
16,74 GJ/AN
HAUSHALTSVERBRAUCHER
HOUSEHOLD CONSUMER
CONSOMMATEUR DOMESTIQUE
PREISE PRO GJ (HO)
PRICES PER GJ (GCV)
PRIX
PAR GJ (PCS)
1 : JANUAR JANUARY JANVIER 2 : JULI
JULY JUILLET
1 9 6 0 - 1
19S5-1 - 2 1 9 - 6 - 1 1 = 8 7 - 1 - 2 1 9 8 8 - 1 " Ζ. 1 Î 3 9 - 1
- 2 1 9 9 0 - 1 C 1 9 9 1 - 1 - 2 1 9 9 2 - 1 - 2 1 9 9 3 - 1 - 2 τ 9 9 < ί _ ι
- 2 1 9 9 5 - 1 - 2 ::o £ 5 - 1 9 3 - 1 Xc ' O l 9 5 - 1
Ζ 9 < - l 9 5 - 1 ( 1 )
1 9 3 0 - 1 - 2 1 9 3 5 - 1 - 2 1 9 6 Í - 1 - 2 1 9 Ô 7 - 1 1 9 8 3 - 1 1 9 5 9 - 1 - 2 1 9 9 0 - 1
- 2 1 9 9 1 - 1 - 2 1 9 9 2 - 1 - 2 1 9 9 3 - 1 - 2 1 9 9 4 - 1 - 2 1 ° 9 5 - 1 - 2 Λ o 8 5 - 1 9 5 - 1 Λ3 9 3 - 1 9 5 - 1 X 9 4 - 1 9 5 - 1
NATIONALE WAEHRUNG NATIONAL CURRENCY MONNAIE NATIONALE STEUERN
I N B E G R . WITH TAXES TAXES COMPRISES BELGIQUE
3 6 3 . 4 0
6 6 3 . 9 0 6 4 8 . 6 0 5 1 9 . 5 0 5 1 7 . 1 0 5 0 6 . 7 0
5 4 4 . 5 1 5 6 9 . 0 0 5 6 9 . 1 0 5 6 2 . 0 0 5 6 5 . 0 0 5 6 4 . 1 0 5 6 2 . 6 0 5 5 9 . 9 0 5 8 6 . 5 0 5 9 0 . 3 0 5 9 1 . 9 0 - 1 . 1 7 1 . 6 3 0 . 0 7 DANMARK
1 1 1 . 2 0
1 6 2 . 0 1 1 6 3 . 1 0 1 4 0 . 2 1 1 5 4 . 1 3 1 7 1 . £ 5
2 0 0 . 0 0 2 4 7 . 3 5 2 2 7 . 3 1 2 5 0 . 9 1 2 4 7 . 6 0 2 3 4 . 9 4 2 4 0 . 0 6 2 0 7 . 2 9 2 0 0 . 9 1 2 0 1 . 8 3 1 9 6 . 1 8 1 2 . 2 2 1 0 . 1 8 1 - 2 . 6 3
OHNE MEHRWERT.
V A T E X C L . HORS T V A
3 6 1 . 7 0
5 6 7 . 5 0 5 5 4 . 4 0 4 4 4 . 0 0 4 4 2 . 2 0 4 3 3 . 1 0
4 6 5 . 3 9 4 8 6 . 3 0 4 8 6 . 4 0 4 8 0 . 3 0 4 7 2 . 8 0 4 7 2 . 0 0 4 7 0 . 8 0 4 8 9 . 6 0 4 3 6 . 7 0 4 8 9 . 9 0 4 9 1 . 2 0
9 2 . 4 7
1 3 2 . 8 0 1 3 3 . 6 9 1 1 4 . 9 3 1 2 6 . 3 4 14 0 . 8 6
1 6 3 . 9 2 2 0 2 . 7 5 1 8 6 . 3 2 2 0 0 . 7 3 1 9 3 . 0 8 1 8 7 . 9 5 1 9 2 . 0 5 1 6 5 . 8 3 1 6 0 . 7 3 1 6 1 . 4 6 1 5 8 . 5 4
OHNE STEUERN
TAXES E X C L . HORS TAXES ( BFR )
3 6 1 . 7 0
5 6 7 . 5 0 5 5 4 . 4 0 4 4 4 . 0 0 4 4 2 . 2 0 4 3 3 . 1 0
4 6 5 . 3 9 4 8 6 . 3 0 4 8 6 . 4 0 4 8 0 . 3 0 4 7 2 . 8 0 4 7 2 . 0 0 4 7 0 . 8 0 4 7 5 . 9 0 4 7 3 . 0 0 4 7 6 . 2 0 4 7 7 . 5 0
( DKR ) 8 0 . 5 3
1 3 2 . 8 0 1 3 3 . 6 9 1 1 4 . 9 3 1 2 6 . 3 4 1 4 0 . 8 6
1 6 3 . 9 2 2 0 2 . 7 5 1 8 6 . 3 2 2 0 0 . 7 3 1 9 8 . 0 6 1 3 7 . 9 5 1 9 2 . 0 5 1 6 5 . 6 3 1 6 0 . 7 3 1 6 1 . 4 6 1 5 6 . 5 4
STEUERN I N B E G R .
WITH TAXES TAXES COMPRISES
6 . 2 9
1 5 . 0 4 1 4 . 6 1 1 1 . 7 1 1 1 . 9 3 1 1 . 7 6
1 2 . 8 3 1 3 . 6 7 1 3 . 6 8 1 3 . 7 5 1 3 . 6 3 1 3 . 4 4 1 3 . 4 1 1 4 . 4 7 1 4 . 3 9 1 4 . 6 6 1 4 . 7 0 - 0 . 2 6 2 . 7 0 1 . 2 9
1 1 . 4 0
1 5 . 9 3 1 5 . 8 4 1 3 . 3 2 1 4 . 7 5 1 6 . 5 9
1 9 . 6 9 2 5 . 3 7 2 3 . 3 1 2 5 . 3 7 2 5 . 0 3 2 4 . 3 2 2 4 . 6 5 2 2 . 5 1 2 1 . 8 1 2 1 . 4 1 2 1 . 0 2 3 . 0 0 1 . 7 0 1 - 4 . 8 7
KKS PPS SPA OHNE MEHRWERT.
V A T E X C L . HORS T V A
7 . 8 2
1 2 . 8 6 1 2 . 4 9 1 0 . 0 1 1 0 . 2 0 1 0 . 0 5
1 0 . 9 6 1 1 . 6 9 1 1 . 6 9 1 1 . 7 5 1 1 . 5 7 1 1 . 2 5 1 1 . 2 2 1 2 . 0 1 1 1 . 9 4 1 2 . 1 6 1 2 . 2 0
9 . 4 8
1 3 . 0 6 1 2 . 9 8 1 0 . 9 1 1 2 . 0 9 1 3 . 6 0
1 6 . 1 3 2 0 . 7 9 1 9 . 1 1 2 0 . 3 0 2 0 . 0 3 1 9 . 4 6 1 9 . 8 8 1 8 . C l 1 7 . 4 5 1 7 . 1 3 1 6 . 8 2
OHNE STEUERN
TAXES E X C L . HORS TAXES
7 . 6 2
1 2 . 8 6 1 2 . 4 9 1 0 . 0 1 1 0 . 2 0 1 0 . 0 5
1 0 . 9 6 1 1 . 6 9 1 1 . 6 9 1 1 . 7 5 1 1 . 5 7 1 1 . 2 5 1 1 . 2 2 1 1 . 6 7 1 1 . 6 0 1 1 . 3 2 1 1 . 8 6
8 . 2 6
1 3 . 0 6 1 2 . 9 8 1 0 . 9 1 1 2 . 0 9 1 3 . 6 0
1 6 . 1 3 2 0 . 7 9 1 9 . 1 1 2 0 . 3 0 2 0 . 0 3 1 9 . 4 6 1 9 . 6 3 1 3 . 0 1 1 7 . 4 5 1 7 . 1 3 1 6 . 8 2
STEUERN I N B E G R .
WITH TAXES TAXES COMPRISES ECUS OHNE MEHRWERT.
V A T E X C L . HORS T V A BRUXELLES 9 . 4 9
1 4 . 9 1 1 4 . 5 7 1 2 . 1 2 1 1 . 9 7 1 1 . 6 1
1 2 . 7 7 1 3 . 4 3 1 3 . 4 6 1 3 . 3 8 1 3 . 4 3 1 4 . 0 0 1 3 . 9 6 1 4 . 6 2 1 4 . 8 4 1 5 . 0 7 1 5 . 4 1 0 . 1 1 3 . 3 6 3 . 1 0
8 . 9 5
1 2 . 7 5 1 2 . 4 6 1 0 . 3 6 1 0 . 2 4 9 . 9 2
1 0 . 9 2 1 1 . 5 2 1 1 . 5 0 1 1 . 4 4 1 1 . 2 4 1 1 . 7 1 1 1 . 6 9 1 2 . 1 3 1 2 . 3 1 1 2 . 5 1 1 2 . 7 9
K03ENHAVN 1 4 . 3 1
2 0 . 3 8 2 0 . 4 3 1 7 . 9 1 1 9 . 4 3 2 1 . 3 0
2 5 . 3 7 3 1 . 3 6 2 6 . 6 2 3 1 . 7 0 3 1 . 4 9 3 1 . 0 9 3 1 . 7 7 2 7 . 4 9 2 6 . 6 6 2 6 . 9 4 1 2 7 . 2 4
2 . 8 3 1 . 2 1 - 1 . 9 7
1 1 . 9 0
1 6 . 7 1 1 6 . 7 5 1 4 . 6 8 1 5 . 9 3 1 7 . 4 6
2 0 . 7 9 2 5 . 7 0 2 3 . 4 6 2 5 . 3 6 2 5 . 2 0 2 4 . 8 8 2 5 . 4 1 2 1 . 9 9 2 1 . 3 3 2 1 . 5 5 2 1 . 7 9
OHNE STEUERN
TAXES E X C L . HDRS TAXES
8 . 9 5
1 2 . 7 5 1 2 . 4 6 1 0 . 3 6 1 0 . 2 4 9 . 9 2
1 0 . 9 2 1 1 . 5 2 1 1 . 5 0 1 1 . 4 4 1 1 . 2 4 1 1 . 7 1 1 1 . 6 9 1 1 . 7 9 1 1 . 9 7 1 2 . 1 6 1 2 . 4 3
1 0 . 3 6
1 6 . 7 1 1 6 . 7 5 1 4 . 6 8 1 5 . 9 3 1 7 . 4 6
2 0 . 7 9 2 5 . 7 0 2 3 . 4 6 2 5 . 3 6 2 5 . 2 0 2 4 . 8 8 2 5 . 4 1 2 1 . 9 9 2 1 . 3 3 2 1 . 5 5 2 1 . 7 9
NATURGAS 16,74 GJ/JAHR NATURAL GAS 16,74 GJ'YEAR GAZ NATUREL 16,74 GJ/AN
HAUSHALTSVERBRAUCHER HOUSEHOLD CONSUMER CONSOMMATEUR DOMESTIQUE
PREISE PRO GJ (HO) PRICES PER GJ (GCV) PRIX PAR GJ (PCS)
1
2
y.o y.o
/.
(1)
y.o y.o V
: JANUAR JANUARY JANVIER : JULI
JULY JUILLET
NATIONALE WAEHRUNG NATIONAL CURRENCY MONNAIE NATIONALE STEUERN
INBEGR. WITH TAXES TAXES COMPRISES DEUTSCHLAND 19301
2 19651 2 19S61 2 19371 2 19881 2 19891 2 19901 2 19911 2 19921 2 19931 2 19941 2 19951 2 651 951 901 951 ÇÍ.1 951
198 01 2 19351 2 19861 2 19871 2 19881 2 19891 2 19901 2 19911 2 19921 2 19931 2 19941 2 19951 2 551 951 901 951 941 951
22.53
33.35 33.85 23.97 23.97 24.03
25.77 26.29 28.53 23.53 28.54 28.14 27.49 27.49 26.83 26.83 2.30 0.81 2.40 ELLADA
OHNE MEHRWERT.
V A T EXCL. HORS T V A
19.94
29.69 29.69 21.03 21.03 21.08
22.60 23.06 25.03 25.03 25.04 24.47 23.90 23.90 23.33 23.33
OHNE STEUERN
TAXES EXCL. HORS TAXES ( DM )
19.94
29.69 29.69 21.03 21.03 20.36
21.88 22.33 24.03 24.03 24.04 23.47 22.90 22.90 22.33 22.33
( DR )
STEUEPN 1NEEGR.
WITH TAXES TAXES COMPRISES
7.91
14.05 14.05 9.99 10.24 10.54
11.45 11.84 12.85 12.79 12.80 12.34 12.22 12.22 11.75 11.75 1.77 0.51 3.85
KKS PPS SPA OHNE MEHRWERT.
V A T EXCL. HORS T V A
7.00
12.32 12.32 8.76 β.99 9.25
10.04 10.39 11.27 11.22 11.23 10.73 10.62 10.62 10.21 10.21
OHNE STEUERN
TAXES EXCL. HORS TAXES
7.00
12.32 12.32 8.76 8.99 8.93
9.72 10.06 10.32 10. 7ö 10.78 10.29 10.18 10.18 9.73 9.76
STEUERN INBEGR.
WITH TAXES TAXES COMPRISES
ECUS OHNE MEHRWERT.
V A T EXCL. HORS T V A DUESSELDORF 9.05
15.22 15.54 11.61 11.61 11.53
12.67 12.83 13.89 13.99 13.97 14.42 14.23 14.33 14.11 14.36 0.75 2.18 0.84
8.01
13.35 13.63 10.19 10.18 10.11
11.11 11.26 12.18 12.27 12.26 12.54 12.37 12.46 12.27 12.49
NATIONAL
OHNE STEUERN
TAXES EXCL. HORS TAXES
8.01
13.35 13.63 10.19 10.18 9.77
10.76 10.90 11.70 11.78 11.77 12.03 11.86 11.94 11.74 11.95
NA'l'RC-AS
16,74 GJ/JAHR
NATURAL GAS
16,74 GJ/YEAR
GAZ NATUREL
16,74 GJ/AN
HAUSHALTSVEPBRAUCHER
HOUSEHOLD CONSUMER
CONSOMMATEUR DOMESTIQUE
PREISE PRO GJ (HO)
PRICES PER GJ (GCV)
PRIX
PAR GJ (PCS)
1 : JANUAR JANUARY JANVIER 2 : JULI
JULY JUILLET (1)
19801 2 19851 2 19361 2 19871 2 19681 2 19891 2 19901 2 19911 2 19921 2 19931 2 i 99Í.1
2 19951 2 Xo £51 951
Λ Ο 901 931 Ζ 941 951
19601 2 19651 2 19661 2 19371 2 19681 2 19691 2 19901 2 19911 2 19921 2 19931 2 19941 2 19951 2 Xo 851 951 /.o 901 951 X 941 951 (1) NATURGAS
ET GAZ D
NATIONALE WAEHRUNG NATIONAL CURRENCY MONNAIE NATIONALE STEUERN
INBEGR. WITH TAXES TAXES COMPRISES ESPANA
1694.00 1777.00 1777.00 1945.30 1945.30 1979.70 1979.70 1979.70 2082.70 2100.18 2100.10 3.03 4.39 6.09 FRANCE
57.77
108.61 104.70 86.68 83.26 82.54
84.58 87.86 89.08 90.26 87.96 86.25 86.25 86.25 84.20 82.84 83.30 2.67 0.42 3.95 UND ORTSGAS 'USINE (GAZ
OHNE MEHRWERT.
V A T EXCL. HORS T V A
1512.00 1586.00 1586.00 1721.50 1721.50 1721.50 1721.50 1721.50 1810.50 1810.50 1610.50
49.13
91.58 88.28 73.09 70.20 70.91
72.63 75.40 76.42 77.42 75.46 74.04 74.04 74.04 72.29 71.00 70.23
OHNE STEUERN
TAXES EXCL. HORS TAXES ( PTA )
1490.00 1563.00 1563.00 1721.50 1721.50 1721.50 1721.50 1721.50 1810.50 1810.50 1810.50
( FF ) 49.13
91.58 88.28 73.09 70.20 70.91
72.63 75.40 76.42 77.42 75.46 74.04 74.04 74.04 72.29 71.00 70.23
(ORTSGAS BIS 1989) / D'USINE JUSQU'EN 1989)
STEUERN INBEGR.
WITH TAXES TAXES COMPRISES
14.40 15.16 15.16 15.68 15.68 15.66 15.66 15.60 16.41 16.11 16.11 0.32 2.27 3.26
6.97
15.04 14.21 11.70 11.34 11.43
11.88 12.70 12.87 13.01 12.67 12.45 12.45 12.82 12.51 11.75 11.82 2.44 0.21 8.29 3ASWORKS GAS
KKS PPS SPA OHNE MEHRWERT.
V A T EXCL. HORS T V A
12.85 13.53 13.53 13.88 13.88 13.79 13.79 13.57 14.27 13.89 13.89
7.63
12.66 11.98 9.86 9.56 9.82
10.20 10.90 11.04 11.16 10.83 10.66 10.63 11.00 10.74 10.07 9.96
AND NATURAL OHNE STEUERN
TAXES EXCL. HORS TAXES
12.67 13.33 13.33 13.68 13.88 13.79 13.79 13.57 14.27 13.89 13.89
7.63
12.68 11.98 9.86 9.56 9.82
10.20 10.90 11.04 11.16 10.83 10.66 10.68 11.00 10.74 10.07 9.96
GAS (GA5WOR
STEUERN INBEGR.
WITH TAXES TAXES COMPRISES
ECUS OHNE MEHRWERT.
V A T EXCL. HORS T V A BARCELONA
12.84 13.75 13.81 15.06 14.96 14.25 12.93 12.41 13.16 12.77 13.04 0.08 0.11 2.67
9.91
15.95 15.67 12.60 11.94 11.62
12.22 12.62 12.78 12.97 12.76 12.99 12.93 13.08 12.81 12.60 12.82 2.33 0.62
1 3.62
<S GAS UNTIL
11.46 12.28 12.32 13.32 13.24 12.39 11.24 10.79 11.44 11.01 11.24
»ARIS 8.43
13.45 13.21 10.62 10.07 9.96
10.49 10.e3 10.96 11.13 10.95 11.15 11.14 11.22 11.00 10.30 10.60
OHNE STEUERN
TAXES EXCL. HORS TAXES
11.29 12.10 12.14 13.32 13.24 12.39 11.24 10.79 11.44 11.01 11.24
8.43
13.45 13.21 10.62 10.07 9.98
10.49 10.83 10.96 11.13 10.95 11.15 11.14 11.22 11.00 10.80 10.80
NATURGAS 16,74 GJ/JAHR HATURAL GAS 16,74 GJ/YEAR GAZ NATUREL 16,74 GJ/AN
HAUSHALTSVERBRAL'CHER HOUSEHOLD CONSUMER CONSOMMATEUR DOMESTIQUE
PREISE PRO GJ (HO) PRICES PER GJ (GCV) PRIX PAR GJ (PCS)
1
2
( 1 )
y.o y.o y. y.o y.o y.
: JANUAR JANUARY JANVIER : J U L I
JULY J U I L L E T
1 9 3 0 - 1 - 2 1 9 e 5 - l - 2 1 9 3 6 - 1 - 2 1 9 6 7 - 1 - 2 1 9 3 8 - 1 - 2 1 9 3 9 - 1 - 2 1 9 9 0 - 1 - 2 1 9 9 1 - 1 - 2 1 9 9 2 - 1 - 2 1 9 9 3 - 1 - 2 ι 9 9 4 - 1
- 2 1 9 9 5 - 1 - 2 8 5 - 1 9 5 - 1 9 0 - 1 9 5 - 1 9 6 - 1 9 5 - 1
1 9 6 0 - 1 - 2 1 9 5 5 - 1 - 2 1 9 8 6 - 1 - 2 1 9 6 7 - 1 - 2 1 9 8 3 - 1 - 2 1 9 8 9 - 1 - 2 1 9 9 0 - 1 - 2 1 9 9 1 - 1 - 2 1 9 9 2 - 1 - 2 1 9 9 3 - 1 - 2 1 9 9 4 - 1 - 2 1 9 9 5 - 1 - 2 6 5 - 1 9 5 - 1 9 0 - 1 9 5 - 1 9 4 - 1 9 5 - 1
NATIONALE WAEHRUNG NATIONAL CURRENCY MONNAIE NATIONALE STEUERN INBEGR. WITH TAXES TAXES COMPRISES IRELAND
1 4 . 2 8 1 3 . 1 8 1 3 . 1 8 1 3 . 1 8
1 1 . 0 0 1 1 . 2 5 1 3 . 4 4 1 3 . 4 4 1 3 . 4 4 1 3 . 4 1 1 3 . 4 1 1 3 . 4 1 1 3 . 4 1 1 3 . 4 1 1 3 . 4 1 0 . 2 3 4 . 0 4
-I T A L -I A 64 08
1 8 2 4 1 1 9 0 8 2 1 7 0 1 1 1 6 8 9 0 1 8 7 2 7
1 3 7 0 4 1 6 3 4 9 16849 16849 1 6 8 4 9 1 7 6 5 9 1 7 6 5 9 1 9 6 7 0 1 9 7 2 2 2 0 9 7 2 2 3 1 9 7 1 . 4 0 2 . 3 2 6 . 6 2
OHNE MEHRWERT.
V A T EXCL. HORS T V A
1 2 . 9 8 1 1 . 9 8 1 1 . 9 8 1 1 . 9 3
1 0 . 0 0 1 0 . 0 0 1 1 . 9 5 1 1 . 9 5 1 1 . 9 5 1 1 . 9 2 1 1 . 9 2 1 1 . 9 2 1 1 . 9 2 1 1 . 9 2 1 1 . 9 2
6 0 4 5
1 6 7 3 5 1 7 5 0 6 1 5 6 0 6 1 5 4 9 5 1 7 1 8 1
1 7 1 6 0 1 6 2 0 1 1 6 2 0 1 1 6 2 0 1 1 6 2 0 1 1 6 2 0 1 1 6 2 0 1 1 8 0 4 6 1 8 0 9 4 1 9 2 4 1 2 1 0 6 8
OHNE STEUERN TAXES EXCL. HORS TAXES ( I R L )
1 2 . 9 8 1 1 . 9 8 1 1 . 9 8 1 1 . 9 8
1 0 . 0 0 1 0 . 0 0 1 1 . 9 5 1 1 . 9 5 1 1 . 9 5 1 1 . 9 2 1 1 . 9 2 1 1 . 9 2 1 1 . 9 2 1 1 . 9 2 1 1 . 9 2
( L I T ) 5 0 6 6
1 5 9 4 6 1 6 7 1 6 1 4 6 1 7 14707 1516 0
1 5 1 6 0 1 5 6 3 0 1 5 6 3 0 1 5 6 3 0 1E630 1 5 6 3 0 1 5 6 3 0 1 6 4 3 7 1 6 5 3 5 1 7 6 8 2 1 7 7 3 7
STEUERN INE-EGR. WITH TAXES TAXES COMPRISES
1 7 . 7 6 1 6 . 4 1 1 6 . 5 8 1 6 . 6 8
1 4 . 8 0 1 5 . 8 9 1 8 . 9 8 1 9 . 4 8 1 9 . 4 8 1 8 . 7 0 1 8 . 7 0 1 9 . 9 9 1 9 . 9 9 1 8 . 7 8 1 8 . 7 6 1 . 2 2 4 . 8 8 - 6 . 0 1
6 . 7 9
1 3 . 6 6 1 3 . 7 4 1 1 . 9 1 1 1 . 4 9 1 2 . 5 5
1 2 . 1 6 1 0 . 7 8 1 0 . 7 8 1 0 . 6 1 1 0 . b l 1 0 . 9 5 1 0 . 9 5 1 1 . 8 0 1 1 . 8 3 1 2 . 3 7 1 3 . 6 9 - 1 . 0 0 0 . 3 5 4 . 8 4
KKS PPS SPA OHNE MEHRWERT.
V A T E X C L . HORS T V A
1 6 . 1 4 1 4 . 9 2 1 5 . 0 7 1 5 . 1 6
1 3 . 4 6 1 4 . 1 2 1 6 . 8 8 1 7 . 3 2 1 7 . 3 2 1 6 . 6 2 1 6 . 6 2 1 7 . 7 6 1 7 . 7 6 1 6 . 7 0 1 6 . 7 0
6 . 4 1
1 2 . 5 5 1 2 . 6 0 1 0 . 9 2 1 0 . 5 4 1 1 . 5 1
1 1 . 1 5 1 0 . 3 7 1 0 . 3 7 1 0 . 2 1 1 0 . 2 1 1 0 . 0 4 1 0 . 0 4 1 0 . 3 3 1 0 . 8 6 1 1 . 3 5 1 2 . 4 4
OHNE STEUERN TAXES EXCL. HORS TAXES
1 6 . 1 4 1 4 . 9 2 1 5 . 0 7 1 5 . 1 6
1 3 . 4 6 1 4 . 1 2 1 6 . 8 8 1 7 . 3 2 1 7 . 3 2 1 6 . 6 2 1 6 . 6 2 1 7 . 7 6 1 7 . 7 6 1 6 . 7 0 1 6 . 7 0
5 . 3 9
1 1 . 9 6 1 2 . 0 4 1 0 . 3 7 1 0 . 0 0 1 0 . 1 6
9 . 8 5 1 0 . 0 0 1 0 . 0 0 9 . 8 5 9 . 8 5 9 . 6 9 9 . 6 9 9 . 8 9 9 . 9 2 1 0 . 4 3 1 0 . 4 6
STEUERN I N B E G R .
WITH TAXES TAXES COMFRISES ECUS OHNE MEHRWERT.
V A T EXCL. HORS T V A D U B L I N
1 9 . 9 6 1 7 . 0 7 1 6 . 9 6 1 6 . 9 2
1 4 . 3 0 1 4 . 6 5 1 7 . 5 0 1 7 . 5 4 1 7 . 5 4 1 8 . 0 8 1 6 . 6 3 1 7 . 2 3 1 6 . 7 6 1 6 . 8 3 1 6 . 3 6 - 0 . 8 2 3 . 3 1 - 2 . 3 7
5 . 5 1
1 3 . 3 2 1 2 . 7 8 1 1 . 5 7 1 1 . 1 5 1 2 . 1 7
1 2 . 3 4 1 0 . 9 5 1 0 . 9 5 1 0 . 9 5 1 0 . 9 5 9 . 7 1 9 . 7 1 1 0 . 4 3 1 0 . 2 6 1 0 . 4 9 1 0 . 6 7 - 2 . 3 6 - 3 . 2 1 0 . 5 8
1 8 . 1 4 1 5 . 5 2 1 5 . 4 1 1 5 . 3 3
1 3 . 0 0 1 3 . 0 2 1 5 . 5 6 1 5 . 6 0 1 5 . 6 0 1 6 . 0 7 1 4 . 7 8 1 5 . 3 2 1 4 . 9 0 1 4 . 9 6 1 4 . 5 4
ROMA 5 . 2 0
1 2 . 2 2 1 1 . 7 3 1 0 . 6 1 1 0 . 2 3 1 1 . 1 7
1 1 . 3 3 1 0 . 5 3 1 0 . 5 3 1 0 . 5 3 1 0 . 5 3 8 . 9 1 6 . 9 1 9 . 5 6 9 . 4 1 9 . 6 2 9 . 7 0
OHNE STEUERN TAXES EXCL. HORS TAXES
1 8 . 1 4 1 5 . 5 2 1 5 . 4 1 1 5 . 3 8
1 3 . 0 0 1 3 . 0 2 1 5 . 5 6 1 5 . 6 0 1 5 . 6 0 1 6 . 0 7 1 4 . 7 8 1 5 . 3 2 1 4 . 9 0 1 4 . 9 6 1 4 . 5 4
4 . 3 7
1 1 . 6 4 1 1 . 2 0 1 0 . 0 8 9 . 7 1 9 . 8 5
1 0 . 0 1 1 0 . 1 6 1 0 . 1 6 1 0 . 1 6 1 0 . 1 6 6 . 6 0 8 . 6 0 8 . 7 4 8 . 6 0 8 . 8 4 8 . 1 6
NATURIAS
16,74 GJ/JAHR
NATURAL GAS
16,74 GJ/YEAR
GAZ NATUREL
16,74 GJ/AN
HAUSHALTSVERBRAUCHER
HOUSEHOLD CONSUMER
CONSOMMATEUR DOMESTIQUE
PREISE PRO GJ (HO)
PRICES PER GJ (GCV)
PRIX
PAR
GJ (PCS)
1 : JANUAR JANUARY JANVIER 2 : JULI
JULY JUILLET 1 1980-1 -2 1985-1 -2 1986-1 -2 1967-1 -2 1938-1 -2 1939-1 -2 1990-1 -2 1991-1 -2 1992-1 -2 1993-1 -2 1994-1 -2 1995-1 -2
Xc 83-1 95-1
■/.o 90-1 95-1 Χ 94-1 95-1
y 1960-1 -2 1935-1 -2 1986-1 -2 1987-1 -2 1988-1 -2 1969-1 -2 1990-1 -2 1991-1 -2 1992-1 -2 1993-1 -2 1994-1 -2 1995-1 -2
Xe 05-1 95-1
y.o 90-1 95-1 Χ 94-1 95-1
NATIONALE WAEHRUNG NATIONAL CURRENCY MONNAIE NATIONALE STEUERN INBEGR. WITH TAXES TAXES COMPRISES .UXEMBOURG 354.90 536.20 564.10 409.49 389.51 371.06 468.76 492.82 544.82 482.76 471.36 422.99 422.99 424.00 425.77 420.96 422.48 -3.26 -2.13 -0.72 JEDERLAND 13.12 22.88 23.55 17.20 16.79 16.29 18.21 22.02 23.06 22.29 22.38 20.66 20.70 21.40 21.00 21.30 20.83 -0.71 3.18 -0.47 OHNE MEHRWERT.
V A T EXCL. HORS T V A
333.00 553.00 532.20 336.31 367.46 350.06 442.26 464.94 513.98 455.44 444.68 399.04 399.04 400.00 401.67 397.13 396.57 11.12 19.23 19.79 14.33 13.99 13.75 15.37 18.58 19.46 18.61 18.89 17.59 17.62 18.21 17.87 18.13 17.73 OHNE STEUERN TAXES EXCL. HORS TAXES
( LFR )
338.00 553.00 532.20 386.31 367.46 350.06 442.26 464.94 513.98 455.44 444.68 399.04 399.04 400.00 401.67 397.13 398.57
( HFL )
11.11 19.22 19.78 14.32 13.98 13.73 15.35 18.39 19.18 18.56 17.71 17.00 17.02 17.62 17.28 17.51 17.12 STEUERN INBEGR. WITH TAXES TAXES COMPRISES 7.99 13.11 12.82 9.24 8.92 6.60 10.97 11.75 12.99 11.48 11.21 10.13 10.13 10.15 10.19 9.76 9.80 -2.91 -2.31 -3.83 4.14 8.47 8.99 6.75 6.80 6.84 7.82 9.49 9.94 9.65 9.69 9.02 9.04 9.55 9.38 9.29 9.08 0.92 3.51 -2.78 KKS PPS SPA OHNE MEHRWERT.
V A T EXCL. HORS T V A
7.61 12.37 12.09 8.72 8.41 8.12 10.35 11.08 12.25 10.83 10.57 9.56 9.56 9.53 9.62 9.21 9.24 3.51 7.12 7.55 5.62 5.66 5.76 6.60 8.01 8.39 8.14 8.18 7.68 7.69 8.13 7.98 7.91 7.73 OHNE STEUERN TAXES EXCL. HORS TAXES 7.61 12.37 12.09 8.72 8.41 8.12 10.35 11.08 12.25 10.83 10.57 9.56 9.56 9.58 9.62 9.21 9.24 3.50 7.12 7.55 5.62 5.66 5.77 6.59 7.93 8.27 8.03 7.67 7.42 7.43 7.87 7.71 7.64 7.47 STEUERN INBEGR. WITH TAXES TAXES COMPRISES ECUS OHNE MEHRWERT.
V A T EXCL. HORS T V A
MATUFSAS 16,74 GJ/JAHR NATURAL GAS 16,74 GJ/YEAR GAZ NATUREL 16,74 GJ/AN
HAUSHALTSVERBRAUCHER HOUSEHOLD CONSUMER CONSOMMATEUR DOMESTIQUE
PREISE PRO GJ (HO) PRICES PER GJ (GCV) PRIX PAR GJ (PCS)
1
2
y.o Xo X (1)
Xo XO
■/.
(1)
: JANUAR JANUARY JANVIER : JULI
JULY JUILLET
0 1960-1
-2 1905-1 -2 1986-1 -2 1987-1 -2 1933-1 -2 1989-1 -2 1990-1 -2 1991-1 -2 1992-1 -2 1993-1 -2 1994-1 -2 1595-1 -2 8Î-1 95-1 90-1 95-1 94-1 95-1
1980-1 -2 1985-1 -2 1986-1 -2 1987-1 -2 19β8-1 -2 1989-1 -2 1990-1 -2 1991-1 -2 1992-1 -2 1993-1 -2 1994-1 -2 1995-1 -2 85-1 95-1 90-1 95-1 94-1 95-1 ORTSGAS
NATIONALE WAEHRUNG NATIONAL CURRENCY MONNAIE NATIONALE STEUERN
INBEGR. WITH TAXES TAXES COMPPISES ÏSTERREICH
PORTUGAL 369.71
1393.50 1467.60 1308.30 1393.50 1507.30
1677.90 1848.60 2107.50 2108.00 2264.00 2264.00 2411.00 2411.00 2909.00 2909.00 2909.00 7.64 11.63 20.66 / GASWORKS
OHNE MEHRWERT.
V A T EXCL. HORS T V A
369.71
1393.50 1358.90 1211.40 1290.30 1395.60
1553.60 1711.60 1951.40 1951.00 1951.00 1951.00 2296.00 2296.00 2770.00 2770.00 2770.00
GAS / GAZ
OHNE STEUERN
TAXES EXCL. HORS TAXES ( OS )
( ESC ) 369.71
1393.50 1358.90 1211.40 1290.30 1395.60
1553.60 1711.60 1951.40 1951.00 1951.00 1951.00 2296.00 2296.00 2770.00 2770.00 2770.00
D'USINE
STEUERN INBEGR.
WITH TAXES TAXES COMPRISES
10.27
19.97 18.04 14.82 14.84 15.15
15.03 15.82 18.04 16.66 18.11 16.39 17.46 15.98 19.29 21.82 21.82 0.89 7.73 36.49
KKS PPS SPA OHNE MEHRWERT.
V A T EXCL. HORS T V A
10.27
19.97 16.70 13.73 13.74 14.03
13.92 14.65 16.70 15.61 15.61 14.13 16.62 15.22 18.37 20.78 20.78
OHNE STEUERN
TAXES EXCL. HORS TAXES
10.27
19.97 16.70 13.73 13.74 14.03
13.92 14.65 16.70 15.61 15.61 14.13 16.62 15.22 18.37 20.78 20.78
STEUERN INBEGR.
WITH TAXES TAXES COMPRISES
ECUS OHNE MEHRWERT.
V A T EXCL. HORS T V A NATIONAL
LISBOA 5.14
11.54 10.45 6.26 8.25 8.82
9.36 10.13 11.89 11.93 13.09 12.84 12.66 12.30 14.78 14.81 14.81 2.53 9.60 20.42
5.14
11.54 9.63 7.64 7.64 8.16
8.67 9.38 11.01 11.04 11.28 11.06 12.05 11.71 14.07 14.10 14.10
OHNE STEUERN
TAXES EXCL. HORS TAXES
5.14
11.54 9.68 7.64 7.64 8.16
NATURGAS 16,74 GJ/JAHR NATURAL GAS 16,74 GJ/YEAR GAZ NATUREL 16,74 GJ/AN
HAUSHA LTSVE RBRAUCH E R HOUSEHOLD CONSUMER CONSOMMATEUR DOMESTIQUE
PREISE PRO GJ (HO) PRICES PER GJ (GCV) PRIX PAR GJ (PCS)
1 : JANUAR JANUARY JANVIER 2 : JULI
JULY JUILLET
NATIONALE WAEHRUNG NATIONAL CURRENCY MONNAIE NATIONALE STEUERN 1 OHNE I INBEGR
WITH TAXES TAXES
1 MEHRWERT. I 1 V A T I 1 EXCL. 1 1 HORS 1 COMPRISES 1 T V A 1
OHNE STEUERN
TAXES EXCL. HORS TAXES
STEUERN INBEGR.
WITH TAXES TAXES COMPRISES
KKS
PPS
SPA
OHNE MEHRWERT.V A T
EXCL. HORST V A
OHNE STEUERN
TAXES EXCL. HORS TAXES
STEUERN INBEGR.
WITH TAXES TAXES COMPRISES
ECUS
OHNE MEHRWERT.
V A T
EXCL. HORST V A
OHNE STEUERN
TAXES EXCL. HORS TAXES
SUOMI/FINL. ( FMK ) NATIONAL
1960-1 -2
1985-1 -2 1986-1 -2 1987-1 -2 1988-1 -2 1989-1 -2
1990-1 -2 1991-1 -2 1992-1 -2 1993-1 -2 1994-1 -2
1995-1 -2
y.o €5-1 95-1 y.o 90-1 95-1 y. 94-1 95-1
SVERIGE ( SKR ) NATIONAL
NATUPFAS 16 NATURAL GAS 16 GAZ NATUREL 16
1 : JANUAR I JANUARY 1 JANVIER 1 2 : JULI 1
JULY I
,74 GJ/JAHR ,74 GJ/YEAR ,74 GJ/AN
NATIONALE WAEHRUNG NATIONAL CURRENCY MONNAIE
STEUERN I INBEGR. 1
WITH I TAXES 1 TAXES 1 JUILLET 1 COMPRISES I
UTD
1980-1 I -2 I
1985-1 I -2 1 1986-1 1 -2 1 1987-1 1 -2 1 1988-1 1 -2 1 1989-1 I -2 1
1990-1 | -2 1 1991-1 1 -2 1 1992-1 1 -2 1 1993-1 I -2 1 1994-1 I -2 1
1995-1 1 -2 1
Xo 65-1 95-1 1 Xo 90-1 95-1 1 X 9^-1 95-1 1
KINGDOM
2.85
5.70
5.87
5.73
5.42
5.73
5.85
6.44 6.60 6.60 6.43 6.30 6.30 6.30 6.81
6.68 6.68
1.60 2.69 6.03
NATIONALE OHNE MEHRWERT.
V A T EXCL. HORS T V A
2.85
5.70
5.87
5.73
5.42
5.73
5.65
6.44 6.60 6.60 6.43 6.30 6.30 6.30 6.30
6.18 6.18
OHNE STEUERN
TAXES EXCL. HORS TAXES
( UKL )
2.85
5.70
5.67
5.73
5.42
5.73
5.85
6.44 6.60 6.60 6.43 6.30 6.30 6.30 6.30
6.16 6.18
HAUSHALTSVERBRAUCHER HOUSEHOLD CONSUMER CONSOMMATEUR DOMESTIQUE
STEUERN INBEGR.
WITH TAXES TAXES COMPRISES
4.73
9.39
9.67
9.20
8.55
8.87
8.90
9.54 9.78 9.91 9.65 9.17 9.17 9.04 9.77
9.67 9.67
0.29 1.66 6.98
KKS PPS SPA OHNE MEHRWERT.
V A T EXCL. HORS T V A
4.73
9.39
9.67
9.20
8.55
8.87
β.90
9.54 9.78 9.91 9.65 9.17 9.17 9.04 9.04
8.95 8.95
OHNE STEUERN
TAXES EXCL. HORS TAXES
4.73
9.39
9.67
9.20
8.55
8.87
8.90
9.54 9.78 9.91 9.65 9.17 9.17 9.04 9.04
8.95 8.95
PREISE PRO PRICES PER PRIX PAR
STEUERN INBEGR.
WITH TAXES TAXES COMPRISES
4.47
9.16
9.38
7.76
7.81
8.94
8.03
9.18 9.47 9.24 9.CO 7.97 8.29 8.44 8.61
8.47 7.92
-0.78 1.07 0.40
GJ GJ GJ
(HO) (GCV) (PCS)
ECUS
OHNE MEHRWERT.
V A T EXCL. HORS T V A
-ONDON
4.47
9.16
9.38
7.76
7.81
8.94
8.03
9.18 9.47 9.24 9.00 7.97 8.29 6.44 7.97
7.64 7.33
OHNE STFUERN
TAXES EXCL. HORS TAXES
4.47
9.16
9.38
7.76
7.81
6.94
8.03
9.18 9.47 9.24 9.00 7.97 8.29 8.^4 7.97