REVIEW
Use of gene expression studies to investigate
the human immunological response to malaria
infection
Susanne H. Hodgson
1,2*, Julius Muller
1, Helen E. Lockstone
3, Adrian V. S. Hill
1,3, Kevin Marsh
4, Simon J. Draper
1and Julian C. Knight
3Abstract
Background: Transcriptional profiling of the human immune response to malaria has been used to identify diagnos-tic markers, understand the pathogenicity of severe disease and dissect the mechanisms of naturally acquired immu-nity (NAI). However, interpreting this body of work is difficult given considerable variation in study design, definition of disease, patient selection and methodology employed. This work details a comprehensive review of gene expres-sion profiling (GEP) of the human immune response to malaria to determine how this technology has been applied to date, instances where this has advanced understanding of NAI and the extent of variability in methodology between studies to allow informed comparison of data and interpretation of results.
Methods: Datasets from the gene expression omnibus (GEO) including the search terms; ‘plasmodium’ or ‘malaria’ or ‘sporozoite’ or ‘merozoite’ or ‘gametocyte’ and ‘Homo sapiens’ were identified and publications analysed. Datasets of gene expression changes in relation to malaria vaccines were excluded.
Results: Twenty-three GEO datasets and 25 related publications were included in the final review. All datasets related to Plasmodium falciparum infection, except two that related to Plasmodium vivax infection. The majority of datasets included samples from individuals infected with malaria ‘naturally’ in the field (n = 13, 57%), however some related to controlled human malaria infection (CHMI) studies (n = 6, 26%), or cells stimulated with Plasmodium in vitro (n = 6, 26%). The majority of studies examined gene expression changes relating to the blood stage of the parasite. Significant heterogeneity between datasets was identified in terms of study design, sample type, platform used and method of analysis. Seven datasets specifically investigated transcriptional changes associated with NAI to malaria, with evidence supporting suppression of the innate pro-inflammatory response as an important mechanism for this in the majority of these studies. However, further interpretation of this body of work was limited by heterogeneity between studies and small sample sizes.
Conclusions: GEP in malaria is a potentially powerful tool, but to date studies have been hypothesis generating with small sample sizes and widely varying methodology. As CHMI studies are increasingly performed in endemic settings, there will be growing opportunity to use GEP to understand detailed time-course changes in host response and understand in greater detail the mechanisms of NAI.
Keywords: Plasmodium falciparum, Gene expression, Malaria, Immunity
© The Author(s) 2019. This article is distributed under the terms of the Creative Commons Attribution 4.0 International License (http://creat iveco mmons .org/licen ses/by/4.0/), which permits unrestricted use, distribution, and reproduction in any medium, provided you give appropriate credit to the original author(s) and the source, provide a link to the Creative Commons license, and indicate if changes were made. The Creative Commons Public Domain Dedication waiver (http://creativecommons.org/ publicdomain/zero/1.0/) applies to the data made available in this article, unless otherwise stated.
Background
Malaria, caused by infection with parasites of the genus Plasmodium, remains a significant public health concern [1]. Despite a vaccine in pilot implementation trials [2] and widespread application of control measures [3], the disease is still responsible for a huge burden of mortality
Open Access
*Correspondence: [email protected]
1 The Jenner Institute, University of Oxford, Old Road Campus Road
Building, Off Roosevelt Drive, Oxford OX3 7DQ, UK
and morbidity worldwide and a concerning increase in incidence has been seen in previously well-controlled areas [3].
With repeated exposure to infection, individuals in malaria-endemic regions develop naturally acquired immunity (NAI), first to the most severe clinical forms, such as cerebral malaria and then more slowly to infec-tion itself [1]. Although the role of antibodies in con-trolling parasite density, symptomatology and severity of disease is well established [4, 5], less is known about mechanism in terms of the role of the innate and cellu-lar immune responses [6]. Increased understanding of the immune response to malaria, in particular those that mediate NAI, could aid identification of diagnostic and prognostic markers, inform vaccine development and assist with the identification of treatment strategies to modify the immunological mechanisms mediating severe pathology [1].
Transcriptomics, which allows the expression of thou-sands of genes to be assessed in parallel for a single RNA sample, is an exciting, expanding area of research with vast potential application in the field of infection [7]. Facilitating a systems biology approach, gene expres-sion data from high-throughput technologies (such as microarrays [8] and next generation sequencing enabling RNA sequencing for bulk cell populations and at single-cell resolution [9, 10]) can allow greater understanding of individuals’ response to infection. To date, expression data have been used to dissect mechanisms of vaccine immunogenicity [11], inform the design of new vaccines [12, 13], predict response to infection and outcome [14, 15], characterize and improve understanding of sepsis [16], and offer a novel approach to the diagnosis of infec-tious pathogens [17–19] together with RNA expression in the pathogen [20].
Given the limited understanding of the mechanisms of NAI to malaria from traditional immunological studies, a systems approach characterizing the gene expression patterns associated with infection could provide novel and valuable insights [21, 22]. Transcriptional profiling of the immune response to malaria in humans to date has sought to identify markers to aid diagnosis [23], to understand the pathogenicity of severe disease [24] and dissect the mechanisms of NAI [25, 26]. However, inter-preting this body of work is difficult given considerable variation in study design, definition of disease, patient selection and methodology employed.
This review outlines a comprehensive analysis of all GEP studies of the human immune response to malaria with two aims: (i) to understand the application of this technology to date, in particular how these studies have informed understanding of NAI; and (ii) to determine the extent of variability in methodology between studies to
allow informed comparison of data and interpretation of results.
Methods
A search of Gene Expression Omnibus (GEO) [27] for datasets including the search terms; ‘plasmodium’ or ‘malaria’ or ‘sporozoite’ or ‘merozoite’ or ‘gametocyte’ and ‘Homo sapiens’ was performed on 10th September 2019. Each of these datasets were examined and those not relating to the human immune response to malaria infection or using the Homo sapiens platform excluded. Of note, datasets of gene expression changes in relation to malaria vaccines were excluded.
Results
Studies identified
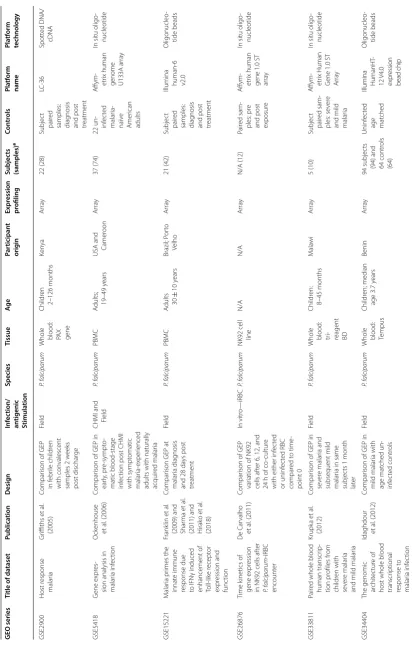
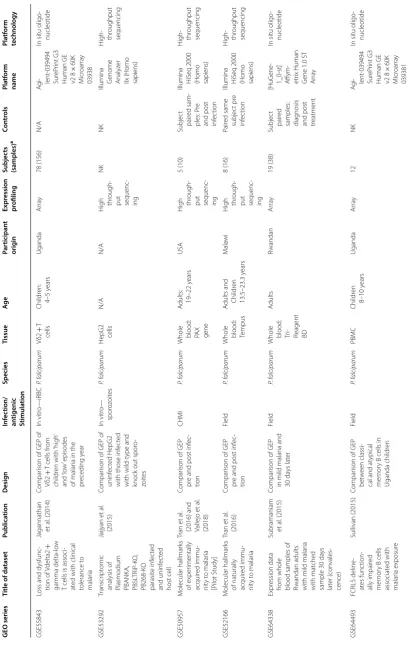
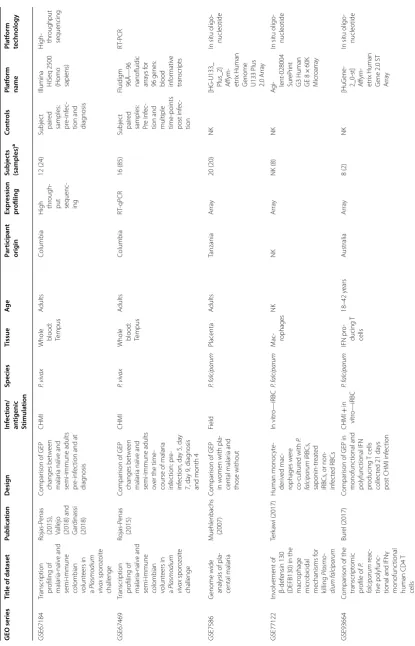
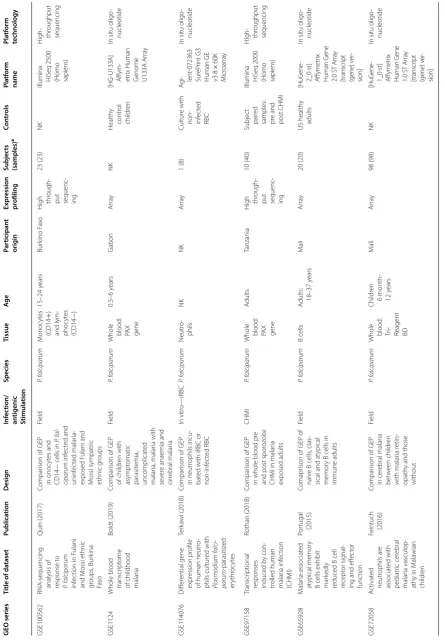
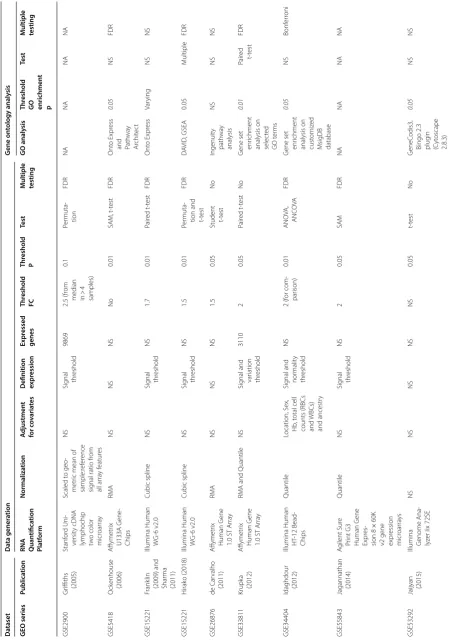
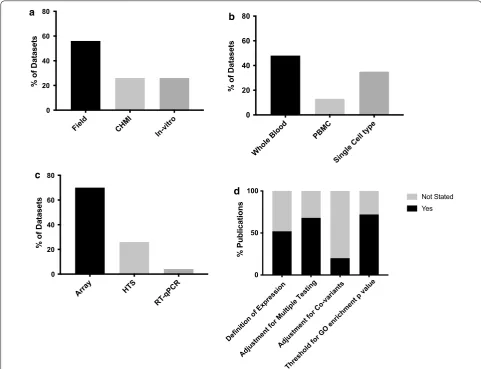
The search identified 30 GEO datasets. Seven of these datasets were excluded, as published analyses were una-vailable. Twenty-three datasets and 25 related publica-tions were therefore included in the final review (Table 1 and Additional file 1: Figure S1). All datasets related to Plasmodium falciparum infection except two that related to Plasmodium vivax infection (Table 1). The majority of datasets included samples from individuals infected with malaria ‘naturally’ in the field (n = 13, 57%),
how-ever some related to controlled human malaria infec-tion (CHMI) studies (n = 6, 26%), or cells stimulated
with Plasmodium in vitro (n = 6, 26%). Studies included
samples from individuals with a wide range of ages (from 2 months—varying ages of adulthood) with differing degrees of prior exposure and, therefore, NAI to malaria. Samples were often collected as part of wider immuno-epidemiological studies or vaccine trials, leading to varia-tion in study design and sampling intervals.
Review of methodological approaches
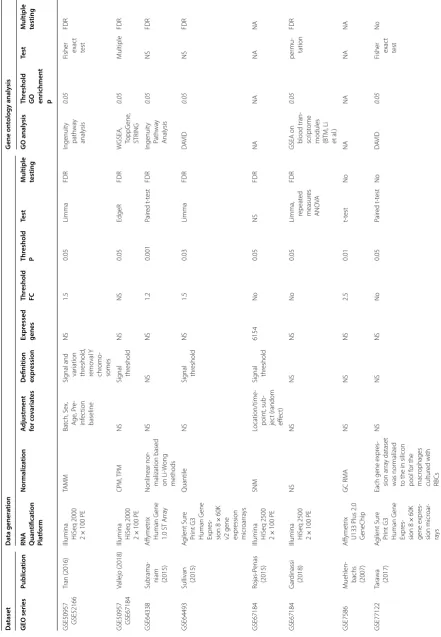
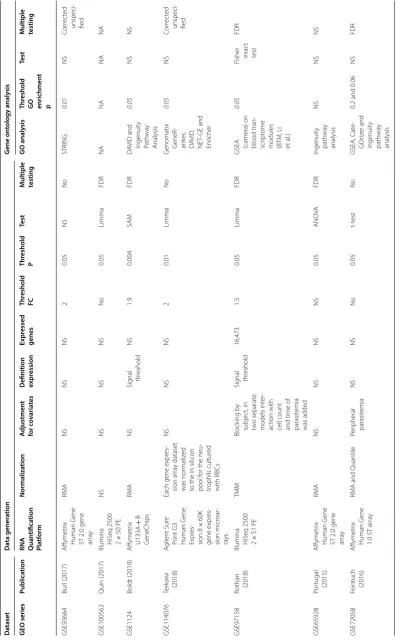
Significant heterogeneity in the datasets was found in terms of study design, sample type, platform used and method of analysis (Tables 1, 2 and Fig. 1), making direct comparison of results between studies difficult. Most datasets were generated from whole blood samples (n = 11, 48%), however some used PBMCs (n = 3, 13%)
or individual tissue or cells types (n = 8, 35%) (Table 1).
For the majority of studies, expression profiling was per-formed by array (n = 16, 70%), with others using high
throughput sequencing (n = 6, 26%) or RT-qPCR [28]
(n = 1, 4%) (Table 1). There was heterogeneity in data
Table
1
Summar
y of gene e
xpr
ession da
tasets in
vestiga
ting the human immunolo
gic al r esp onse t o malaria inf ec tion GEO series Title of da taset Publica tion Desig n Inf ec tion/ an tigenic Stimula tion Species Tissue Ag e Par ticipan t orig in Expr ession pr ofiling Subjec ts (samples) a Con tr ols Pla tf orm name Pla tf orm technology GSE2900 Host r esponse malar ia Gr iffiths et al . (2005) Compar
ison of GEP
in f ebr ile childr en with con valescent samples 2 w eeks post dischar ge Field P. f alciparum
Whole blood: PA
X gene Childr en 2–126 months Ken ya Ar ra y 22 (28) Subjec t pair ed
samples: diag
nosis
and post treatment
LC-36 Spott ed DNA/ cDNA GSE5418 G ene expr es
-sion analysis in malar
ia inf ec tion O ck enhouse et al . (2006) Compar
ison of GEP in
ear
ly
, pr
e-sympt
o-matic blood-stage infec
tion post CHMI
with sympt omatic malar ia-exper ienced
adults with naturally acquir
ed malar
ia
CHMI and Field
P. f
alciparum
PBMC
A
dults; 19–49
y
ears
USA and Camer
oon
Ar
ra
y
37 (74)
22 un- inf
ec ted malar ia-naïv e Amer ican adults A ffym -etr ix human
genome U133A ar
ra
y
In situ oligo
-nucleotide GSE15221 M alar ia pr imes the innat e immune
response due to IFNγ induced enhancement of Toll-lik
e r ecept or expr ession and func tion Frank lin et al .
(2009) and Shar
ma et
al
.
(2011) and Hirak
o et
al
.
(2018)
Compar
ison GEP at
malar ia diag nosis and 28 da ys post tr eatment Field P. f alciparum PBMC A
dults 30
± 10 y ears Brazil; P or to Velho Ar ra y 21 (42) Subjec t pair ed
samples: diag
nosis
and post treatment Illumina human-6 v2.0
Oligonucleo -tide beads GSE26876 Time k inetics of gene expr ession
in NK92 cells af
ter P. f alciparum -iRBC encount er D e C ar valho et al . (2011) Compar
ison of GEP
var
iation of NK92
cells af
ter 6, 12, and
24
h of co
-cultur
e
with either inf
ec ted or uninf ec ted RBC compar ed t o time -point 0 In vitr o—iRBC P. f alciparum
NK92 cell line
N/A N/A Ar ra y N/A (12) Pair ed sam -ples: pr e
and post exposur
e A ffym -etr ix human
gene 1.0 ST arra
y
In situ oligo
-nucleotide
GSE33811
Pair
ed whole blood human transcr
ip -tion pr ofiles fr om childr en with se ver e malar ia
and mild malar
ia Krupk a et al . (2012) Compar
ison of GEP in
se
ver
e malar
ia and
subsequent mild malar
ia in same
subjec ts 1 month lat er Field P. f alciparum
Whole blood: tr i- reagent BD
Childr en: 8–45 months M ala wi Ar ra y 5 (10) Subjec t pair ed sam -ples: se ver e
and mild malar
ia A ffym -etr ix Human G
ene 1.0 ST
Ar
ra
y
In situ oligo
-nucleotide
GSE34404
The genomic ar
chit
ec
tur
e of
host whole blood transcr
iptional response t o malar ia inf ec tion
Idaghdour et
al
. (2012)
Compar
ison of GEP in
mild malar ia with age mat ched un-inf ec ted contr ols Field P. f alciparum
Whole blood: Tempus
Childr en; median age 3.7 y ears Benin Ar ra y 94 subjec ts
(94) and 64 contr
ols
(64)
Uninf
ec
ted
age mat
ched
Illumina HumanHT
-
12 V4.0 expr
ession
bead chip
Oligonucleo
[image:3.595.85.498.84.731.2]
Table 1 (c on tinued) GEO series Title of da taset Publica tion Desig n Inf ec tion/ an tigenic Stimula tion Species Tissue Ag e Par ticipan t orig in Expr ession pr ofiling Subjec ts (samples) a Con tr ols Pla tf orm name Pla tf orm technology GSE55843
Loss and dysfunc
-tion of V delta2 + gamma delta-lo w
T cells is associ
-at
ed with clinical
tolerance t
o
malar
ia
Jagannathan et
al
. (2014)
Compar
ison of GEP of
Vδ2
+
T cells fr
om childr en with ‘ high ’ and ‘ lo w ’ episodes of malar
ia in the
pr eceding y ear In vitr o—iRBC P. f alciparum Vδ2 + T cells Childr en: 4–5 y ears Uganda Ar ra y 78 (156) N/A Ag i- lent -039494 Sur eP rint G3
Human GE v2 8
× 60K M icr oar ra y 03938
In situ oligo
-nucleotide GSE53292 Transcr ipt omic
analysis of Plasmodium PBANK
A, PBSL TR iP -K O , PB268-K O parasit e inf ec ted and uninf ec ted host cell Jaijyan et al . (2015) Compar
ison of GEP of
uninf
ec
ted HepG2
with those inf
ec
ted
with wild-t
ype and
knock out spor
o-zoit es In vitr o— spor oz oit es P. f alciparum
HepG2 cells
N/A
N/A
H
igh through
-put sequenc
-ing NK NK Illumina G enome Analyz er
IIx (Homo sapiens)
H
igh- throughput sequencing
GSE50957 M olecular hallmar ks of exper imentally acquir ed immu -nit y t o malar ia [P ilot Study] Tran et al .
(2016) and Vallejo et
al
.
(2018)
Compar
ison of GEP
pr
e and post inf
ec -tion CHMI P. f alciparum
Whole blood: PA
X
gene
A
dults: 19–22
y
ears
USA
H
igh through
-put sequenc
-ing 5 (10) Subjec t pair ed sam -ples: P re
and post infec
tion Illumina H iS eq 2000 (Homo sapiens) H
igh- throughput sequencing
GSE52166
M
olecular hallmar
ks
of naturally acquir
ed immu -nit y t o malar ia Tran et al . (2016) Compar
ison of GEP
pr
e and post inf
ec -tion Field P. f alciparum
Whole blood: Tempus
A
dults and Childr
en 13.5–23.3 y ears M ala wi H
igh through
-put sequenc
-ing
8 (16)
Pair
ed same subjec
t pr e inf ec tion Illumina H iS eq 2000 (Homo sapiens) H
igh- throughput sequencing
GSE64338
Expr
ession data
from whole blood samples of Rwandan adults with mild malar
ia with mat ched sample 30 da ys lat er ( con vales -cence)
Subramaniam et
al
. (2015)
Compar
ison of GEP
in mild malar
ia and 30 da ys lat er Field P. f alciparum
Whole blood: Tr
i-Reagent BD
A dults Rwandan Ar ra y 19 (38) Subjec t pair ed
samples: diag
nosis
and post treatment
[HuG
ene
-1_0-st] Affym
-etr
ix Human
G
ene 1.0 ST
Ar
ra
y
In situ oligo
-nucleotide GSE64493 FCRL5 deline -at es func tion -ally impair ed memor
y B cells
associat ed with malar ia exposur e Sullivan (2015) Compar
ison of GEP
bet
w
een classi
-cal and at
ypical
memor
y B cells in
Uganda childr en Field P. f alciparum PBMC Childr en 8–10 y ears Uganda Ar ra y 12 NK Ag i- lent -039494 Sur eP rint G3
Human GE v2 8
× 60K M icr oar ra y 039381
In situ oligo
[image:4.595.87.498.86.732.2]
Table
1
(c
on
tinued)
GEO series
Title of da
taset
Publica
tion
Desig
n
Inf
ec
tion/
an
tigenic
Stimula
tion
Species
Tissue
Ag
e
Par
ticipan
t
orig
in
Expr
ession
pr
ofiling
Subjec
ts
(samples)
a
Con
tr
ols
Pla
tf
orm
name
Pla
tf
orm
technology
GSE67184
Transcr
iption
pr
ofiling of
malar
ia-naïv
e and
semi-immune colombian volunt
eers in
a
Plasmodium
viv
ax
spor
oz
oit
e
challenge
Rojas-P
enas
(2015), Vallejo (2018) and Gar
dinassi
(2018)
Compar
ison of GEP
changes bet
w
een
malar
ia naïv
e and
semi-immune adults pre-inf
ec
tion and at
diag
nosis
CHMI
P. viv
ax
Whole blood: Tempus
A
dults
Columbia
H
igh through
-put sequenc
-ing
12 (24)
Subjec
t
pair
ed
samples: pre-inf
ec
-tion and diag
nosis
Illumina H
iS
eq
2500
(Homo sapiens)
H
igh- throughput sequencing
GSE67469
Transcr
iption
pr
ofiling of
malar
ia-naïv
e and
semi-immune colombian volunt
eers in
a
Plasmodium
viv
ax
spor
oz
oit
e
challenge
Rojas-P
enas
(2015)
Compar
ison of GEP
changes bet
w
een
malar
ia naïv
e and
semi-immune adults over the time
-course of malar
ia
inf
ec
tion: pr
e-inf
ec
tion, da
y 5, da
y
7, da
y 9, diag
nosis
and month 4
CHMI
P. viv
ax
Whole blood: Tempus
A
dults
Columbia
RT
-qPCR
16 (85)
Subjec
t
pair
ed
samples: Pre inf
ec
-tion and multiple time
-points
post inf
ec
-tion
Fluidig
m
96×96 nanofluidic arra
ys f
or
96 genes: blood infor
mativ
e
transcr
ipts
RT
-PCR
GSE7586
G
enome wide analysis of pla
-cental malar
ia
M
uehlenbachs (2007)
Compar
ison of GEP
in w
omen with pla
-cental malar
ia and
those without
Field
P. f
alciparum
Placenta
A
dults
Tanzania
Ar
ra
y
20 (20)
NK
[HG-U133_ Plus_2] A
ffym
-etr
ix Human
G
enome
U133 P
lus
2.0 Ar
ra
y
In situ oligo
-nucleotide
GSE77122
In
volv
ement of
β-def
ensin 130
(DEFB130) in the macr
ophage
micr
obicidal
mechanisms f
or
killing
Plasmo
-dium f
alciparum
Ter
ka
wi (2017)
Human monoc
yt
e-der
iv
ed mac
-rophages w
er
e
co
-cultur
ed with
P.
falciparum
iRBCs
,
saponin-tr
eat
ed
iRBCs
, or
non-inf
ec
ted RBCs
In vitr
o—iRBC
P. f
alciparum
M
ac
-rophages
NK
NK
Ar
ra
y
NK (8)
NK
Ag
i- lent
-028004
Sur
eP
rint
G3 Human GE 8
×
60K
M
icr
oar
ra
y
In situ oligo
-nucleotide
GSE93664
Compar
ison of the
transcr
ipt
omic
pr
ofile of
P.
falciparum
reac
-tiv
e polyfunc
-tional and IFNγ monofunc
tional
human
CD4 T
cells
Bur
el (2017)
Compar
ison of GEP in
monofunc
tional and
polyfunc
tional IFN
pr
oducing T
cells
collec
ted 21
da
ys
post CHMI inf
ec
tion
CHMI
+
in
vitr
o—iRBC
P. f
alciparum
IFN pr
o-ducing T cells
18–42
y
ears
A
ustralia
Ar
ra
y
8 (2)
NK
[HuG
ene
-2_0-st] Affym
-etr
ix Human
G
ene 2.0 ST
Ar
ra
y
In situ oligo
[image:5.595.85.501.83.730.2]
Table 1 (c on tinued) GEO series Title of da taset Publica tion Desig n Inf ec tion/ an tigenic Stimula tion Species Tissue Ag e Par ticipan t orig in Expr ession pr ofiling Subjec ts (samples) a Con tr ols Pla tf orm name Pla tf orm technology GSE100562
RNA-sequencing analysis of response t
o
P. f
alciparum
inf
ec
tion in F
ulani and M ossi ethnic gr oups , Bur kina Faso Quin (2017) Compar
ison of GEP
in onoc yt es and CD14 − cells in P. f al -ciparum inf ec ted and uninf ec ted malar ia-exposed F ulani and M ossi sympatr ic ethnic g roups Field P. f alciparum M onoc yt es (CD14 + ) and lym -phoc yt es (CD14 − ) 15–24 y ears Bur kino F aso H
igh through
-put sequenc
-ing 23 (23) NK Illumina H iS eq 2500 (Homo sapiens) H
igh- throughput sequencing
GSE1124
Whole blood transcr
ipt
ome
of childhood malar
ia
Boldt (2019)
Compar
ison of GEP
of childr en with asympt omatic parasit emia, uncomplicat ed malar ia, malar ia with se ver
e anaemia and
cer ebral malar ia Field P. f alciparum
Whole blood: PA
[image:6.595.86.532.88.732.2]X gene 0.5–6 y ears G abon Ar ra y NK Health y contr ol childr en [HG-U133A] A ffym -etr ix Human G enome U133A Ar ra y
In situ oligo
-nucleotide GSE114076 Diff er ential gene expr ession pr ofile
of human neutr
o-phils cultur ed with Plasmodium f alci -parum -parasitiz ed er ythr oc yt es Ter ka wi (2018) Compar
ison of GEP
in neutr
ophils incu
-bat
ed with iRBC or
non-inf ec ted RBC In vitr o—iRBC P. f alciparum Neutr o-phils NK NK Ar ra y 1 (8) Cultur e with
non- infec
ted RBC Ag i- lent -072363 Sur eP rint G3
Human GE v3 8
× 60K M icr oar ra y
In situ oligo
-nucleotide
GSE97158
Transcr
iptional
responses induced b
y con -tr olled human malar ia inf ec tion (CHMI) Rothan (2018) Compar
ison of GEP
in whole blood pr
e
and post spor
oz
oit
e
CHMI in malar
ia
exposed adults
CHMI
P. f
alciparum
Whole blood: PA
X gene A dults Tanzania H
igh through
-put sequenc
-ing 10 (40) Subjec t pair ed
samples: pre and post CHMI Illumina H iS eq 2000 (Homo sapiens) H
igh- throughput sequencing
GSE65928 M alar ia-associat ed at ypical memor y
B cells exhibit mar
kedly
reduced B cell recept
or sig
nal
-ing and eff
ec
tor
func
tion
Por
tugal (2015)
Comapr
ison of GEP of
naïv
e B cells
, clas
-sical and at
ypical
memor
y B cells in
immune adults Field P. f alciparum B cells A
dults: 18–37
y ears M ali Ar ra y 20 (20) US health y adults [HuG ene -2_0-st] Affymetr ix Human G ene
2.0 ST Ar
ra y [transcr ipt (gene) v er -sion]
In situ oligo
-nucleotide GSE72058 A ctivat ed neutr ophils ar e associat ed with pediatr ic cer ebral malar ia vasculop -ath
y in M
ala
wian
childr
en
Feintuch (2016)
Compar
ison of GEP
in cer ebral malar ia bet w een childr en with malar ia r etin -opath
y and those
without
Field
P. f
alciparum
Whole blood: Tr
i-Reagent BD
Childr en 6 month– 12 y ears M ali Ar ra y 98 (98) NK [HuG ene -1_0-st] Affymetr ix Human G ene
1.0 ST Ar
ra y [transcr ipt (gene) v er -sion]
In situ oligo
-nucleotide PBM C per ipher
al blood mononuclear c
ells , GEP gene e xpr ession pr ofile , CHMI c on tr
olled human malar
ia inf ec tion, iRBCs inf ec ted r
ed blood c
ells , N/A not applicable , NK not k no wn
a S
amples analy
sed f
or publica
Table
2
C
omparison of metho
dolo
gic
al appr
oaches f
or analy
sis of gene e
xpr
ession da
ta
Da
taset
Da
ta gener
ation
G
ene on
tology analy
sis
GEO series
Publica
tion
RNA Quan
tifica
tion
Pla
tf
orm
Normaliza
tion
A
djustmen
t
for c
ov
aria
tes
Definition expr
ession
Expr
essed
genes
Thr
eshold
FC
Thr
eshold
P
Test
Multiple testing
GO analy
sis
Thr
eshold
GO enrichmen
t
p
Test
Multiple testing
GSE2900
Gr
iffiths (2005)
Stanf
or
d Uni
-versit
y cDNA
lymphochip two color micr
oar
ra
y
Scaled t
o geo
-metr
ic mean of
sample:r
ef
er
ence
sig
nal ratio fr
om
all ar
ra
y f
eatur
es
NS
Sig
nal threshold
9869
2.5 (fr
om
median in >
4
samples)
0.1
Per
muta
-tion
FDR
NA
NA
NA
NA
GSE5418
O
ck
enhouse
(2006)
A
ffymetr
ix
U133A G
ene
-Chips
RMA
NS
NS
NS
No
0.01
SA
M, t
-t
est
FDR
Ont
o Expr
ess
and Path
wa
y
Ar
chit
ec
t
0.05
NS
FDR
GSE15221
Frank
lin
(2009) and Shar
ma
(2011)
Illumina Human W
G-6 v2.0
Cubic spline
NS
Sig
nal threshold
NS
1.7
0.01
Pair
ed t
-t
est
FDR
Ont
o Expr
ess
Var
ying
NS
NS
GSE15221
H
irak
o (2018)
Illumina Human W
G-6 v2.0
Cubic spline
NS
Sig
nal threshold
NS
1.5
0.01
Per
muta
-tion and t-test
FDR
D
AVID
, GSEA
0.05
M
ultiple
FDR
GSE26876
de C
ar
valho
(2011)
A
ffymetr
ix
Human G
ene
1.0 ST Ar
ra
y
RMA
NS
NS
NS
1.5
0.05
Student t-t
est
No
Ingenuit
y
path
wa
y
analysis
NS
NS
NS
GSE33811
Krupk
a
(2012)
A
ffymetr
ix
Human G
ene
1.0 ST Ar
ra
y
RM
A and Quantile
NS
Sig
nal and variation threshold
3110
2
0.05
Pair
ed t
-t
est
No
G
ene set enr
ichment
analysis on selec
ted
GO t
er
ms
0.01
Pair
ed t-test
FDR
GSE34404
Idaghdour (2012) Illumina Human HT
-12 Bead
-Chips
Quantile
Location, S
ex,
H
b, t
otal cell
counts (RBCs and WBCs) and ancestr
y
Sig
nal and normalit
y
thr
eshold
NS
2 (f
or com
-par
ison)
0.01
ANO
VA,
ANC
O
VA
FDR
G
ene set enr
ichment
analysis on cust
omiz
ed
MsigDB database
0.05
NS
Bonf
er
roni
GSE55843
Jagannathan (2014)
A
gilent Sur
e
Pr
int G3
Human G
ene
Expr
es
-sion
8
×
60K
v2 gene expr
ession
micr
oar
ra
ys
Quantile
NS
Sig
nal threshold
NS
2
0.05
SAM
FDR
NA
NA
NA
NA
GSE53292
Jaijyan (2015) Illumina G
enome Ana
-lyz
er I
ix 72SE
NS
NS
NS
NS
NS
0.05
t-t
est
No
G
eneC
odis3,
Bingo 2.3 plug
in
(C
yt
oscape
2.8.3)
0.05
NS
[image:7.595.80.531.87.728.2]Table
2
(c
on
tinued)
Da
taset
Da
ta gener
ation
G
ene on
tology analy
sis
GEO series
Publica
tion
RNA Quan
tifica
tion
Pla
tf
orm
Normaliza
tion
A
djustmen
t
for c
ov
aria
tes
Definition expr
ession
Expr
essed
genes
Thr
eshold
FC
Thr
eshold
P
Test
Multiple testing
GO analy
sis
Thr
eshold
GO enrichmen
t
p
Test
Multiple testing
GSE50957 GSE52166
Tran (2016)
Illumina H
iS
eq
2000
2
×
100
PE
TA
M
M
Bat
ch, S
ex,
Ag
e,
P
re
-inf
ec
tion
baseline
Sig
nal and variation threshold
,
remo
val Y
chr
omo
-somes
NS
1.5
0.05
Limma
FDR
Ingenuit
y
path
wa
y
analysis
0.05
Fisher exac
t
test
FDR
GSE50957 GSE67184
Vallejo (2018)
Illumina H
iS
eq
2000
2
×
100
PE
CP
M, TP
M
NS
Sig
nal threshold
NS
NS
0.05
EdgeR
FDR
W
GSEA, ToppG
ene
,
STRING
0.05
M
ultiple
FDR
GSE64338
Subrama
-niam (2015)
A
ffymetr
ix
Human G
ene
1.0 ST Ar
ra
y
Nonlinear nor
-malization based on
Li-W
ong
methods
NS
NS
NS
1.2
0.001
Pair
ed t
-t
est
FDR
Ingenuit
y
Path
wa
y
Analysis
0.05
NS
FDR
GSE64493
Sullivan (2015)
A
gilent Sur
e
Pr
int G3
Human G
ene
Expr
es
-sion
8
×
60K
v2 gene expr
ession
micr
oar
ra
ys
Quantile
NS
Sig
nal threshold
NS
1.5
0.03
Limma
FDR
D
AVID
0.05
NS
FDR
GSE67184
Rojas-P
enas
(2015)
Illumina H
iS
eq
2500
2
×
100
PE
SNM
Location/time
-point, sub
-jec
t (random
eff
ec
t)
Sig
nal threshold
6154
No
0.05
NS
FDR
NA
NA
NA
NA
GSE67184
G
ar
dinassi (2018) Illumina H
iS
eq
2500
2
×
100
PE
NS
NS
NS
NS
No
0.05
Limma, repeat
ed
measur
es
ANO
VA
FDR
GSEA on blood tran
-scr
ipt
ome
modules (BTM, Li et al
.)
0.05
per
mu
-tation
FDR
GSE7586
M
uehlen
-bachs (2007)
A
ffymetr
ix
U133 P
lus 2.0
G
eneChip
GC RM
A
NS
NS
NS
2.5
0.01
t-t
est
No
NA
NA
NA
NA
GSE77122
Tara
wa
(2017)
A
gilent Sur
e
Pr
int G3
Human G
ene
Expr
es
-sion
8
×
60K
gene expr
es
-sion micr
oar
-ra
ys
Each gene expr
es
-sion ar
ra
y dataset
was nor
maliz
ed
to the in silicon pool f
or the
macr
ophages
cultur
ed with
RBCs
NS
NS
NS
No
0.05
Pair
ed t
-t
est
No
D
AVID
0.05
Fisher exac
t
test
[image:8.595.84.526.93.731.2]Table
2
(c
on
tinued)
Da
taset
Da
ta gener
ation
G
ene on
tology analy
sis
GEO series
Publica
tion
RNA Quan
tifica
tion
Pla
tf
orm
Normaliza
tion
A
djustmen
t
for c
ov
aria
tes
Definition expr
ession
Expr
essed
genes
Thr
eshold
FC
Thr
eshold
P
Test
Multiple testing
GO analy
sis
Thr
eshold
GO enrichmen
t
p
Test
Multiple testing
GSE93664
Bur
l (2017)
A
ffymetr
ix
Human G
ene
ST 2.0 gene arra
y
RMA
NS
NS
NS
2
0.05
NS
No
STRING
0.01
NS
Cor
rec
ted
unspeci fied
GSE100562
Quin (2017)
Illumina H
iS
eq
2500
2
×
50
PE
NS
NS
NS
NS
No
0.05
Limma
FDR
NA
NA
NA
NA
GSE1124
Boldt (2019)
A
ffymetr
ix
U133A
+
B
G
eneChips
RMA
NS
Sig
nal threshold
NS
1.9
0.004
SAM
FDR
D
AVID and Ingenuit
y
Path
wa
y
Analysis
0.05
NS
NS
GSE114076
Ter
ka
wi
(2018)
A
gilent Sur
e
Pr
int G3
Human G
ene
Expr
es
-sion
8
×
60K
gene expr
es
-sion micr
oar
-ra
ys
Each gene expr
es
-sion ar
ra
y dataset
was nor
maliz
ed
to the in silicon pool f
or the neu
-tr
ophils cultur
ed
with RBCs
NS
NS
NS
2
0.01
Limma
No
G
enomatix GeneR
-ank
er
,
D
AVID
,
NE
T-GE and
Enr
icher
0.05
NS
Cor
rec
ted
unspeci fied
GSE97158
Rothan (2018) Illumina H
iS
eq
2500
2
×
51
PE
TMM
Block
ing b
y
subjec
t, in
tw
o separat
e
models int
er
-ac
tion with
cell count and time of parasit
emia
was added
Sig
nal threshold
16,473
1.5
0.05
Limma
FDR
GSEA (camera) on blood tran
-scr
ipt
ome
modules (BTM, Li et al
.)
0.05
Fisher exac
t
test
FDR
GSE65928
Por
tugal (2015)
A
ffymetr
ix
Human G
ene
ST 2.0 gene arra
y
RMA
NS
NS
NS
NS
0.05
ANO
VA
FDR
Ingenuit
y
path
wa
y
analysis
NS
NS
NS
GSE72058
Feintuch (2016)
A
ffymetr
ix
Human G
ene
1.0 ST ar
ra
y
RM
A and Quantile
Per
ipheral parasit
emia
NS
NS
No
0.05
t-t
est
No
GSEA, C
at
e-GOr
iz
er and
ingenuit
y
path
wa
y
analysis
0.2 and 0.06
NS
FDR
FDR
false disc
ov
er
y r
at
e,
Hb
haemoglobin,
NA
not a
vailable
,
NS
not specified in publica
tion,
RBCs
red blood c
ells
,
RMA
R
obust M
ultichip a
ver
age
,
SNM
super
vised nor
maliza
tion of micr
oar
ra
y,
TMM
tr
immed mean of
M
-v
alues
,
GEO
G
ene Expr
ession Omnibus
,
GE
gene on
[image:9.595.85.487.88.731.2]also varied and there was variable, often incomplete reporting of analysis methods used (Table 2).
Transcriptional insights into the immune response to malaria infection
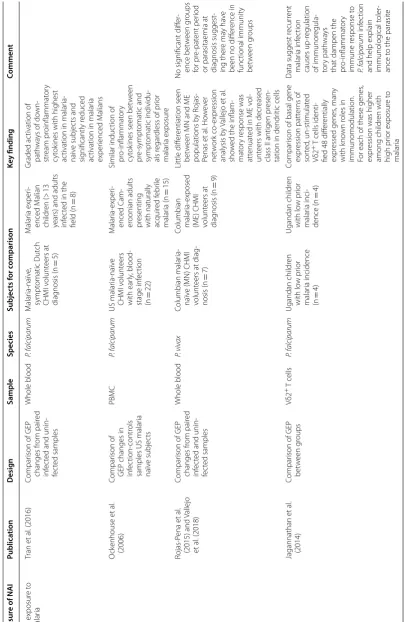
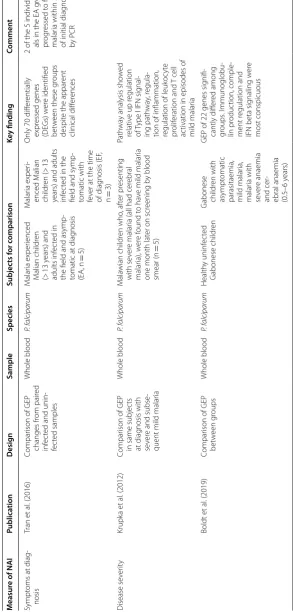
Seven datasets provided insight into the transcriptional changes associated with NAI to malaria (Table 3) [24– 26, 28–31]. However, given the difficulty in defining or quantifying NAI for an individual, studies varied in their approach, choosing to examine GEPs in settings of vary-ing history of prior exposure to malaria [25, 26, 28, 29], symptomatology during infection [25] or severity of dis-ease [24, 32]. All studies examining NAI included small numbers of subjects and all deployed different experi-mental designs (Table 3).
The findings from a number of studies supported a dampening of the innate pro-inflammatory immune response as a mechanism underpinning NAI [24–26, 33] although this finding was not observed in all studies [28,
29, 31].
One study by Franklin et al. provided evidence of ‘pro-inflammatory priming’ of the innate immune system in acute malaria infection [34]. Comparison of GEP in Brazilian adults presenting with uncomplicated malaria with paired convalescent samples showed an increase in expression in genes involved in TLR signalling pathways supporting a role for TLR hyper responsiveness in the pathology of malaria infection [34, 35].
Quin et al. sought to use RNA sequencing to eluci-date the mechanism driving lower infection rates, lower
Field CHMI In-vitro
0 20 40 60 80
% of Datasets
Whole Bloo d
PBMC
Single Cell type 0
20 40 60 80
% of Datasets
Arra y
HTS
RT-qPC R
0 20 40 60 80
% of Datasets
Definition of Expression Adjustment for Multiple Testin
g
Adjustment for Co-variants
Threshold for GO enrichment p value
0 50 100
% Publications
Yes Not Stated
a b
c
d
Fig. 1 Comparison of key methodological variables between datasets or publications. a Antigenic stimulation; CHMI controlled human malaria infection, ‘field’ infection naturally by mosquito bite, ‘in-vitro’ in vitro stimulation by sporozoites or infected red blood cells. Some datasets employed more than one method of antigenic stimulation. b Tissue type analysed; PBMC peripheral blood mononuclear cells. c Expression profiling method:
[image:10.595.56.538.306.675.2]Table
3
G
ene e
xpr
ession studies inf
orming understanding of na
tur ally ac quir ed immunit y t o malaria inf ec tion M easur e of NAI Publica tion Desig n Sample Species Subjec ts f or c omparison Ke y finding Commen t Pr ior exposur e t o malar ia Tran et al . (2016) Compar
ison of GEP
changes fr
om pair
ed
inf
ec
ted and unin
-fec ted samples Whole blood P. f alciparum M alar ia-naïv e, sympt omatic Dut ch CHMI v olunt eers at diag nosis (n = 5) M alar ia exper i-enced M alian childr en (> 13
years) and adults infec
ted in the
field (n = 8) Graded ac tivation of path wa
ys of do
wn -str eam pr oinflammat or y cyt ok
ines with highest
ac
tivation in malar
ia-naiv e subjec ts and sig nificantly r educed ac
tivation in malar
ia exper ienced M alians O ck enhouse et al . (2006) Compar ison of
GEP changes in infec
tion-contr
ols
samples US malar
ia naïv e subjec ts PBMC P. f alciparum US malar ia-naïv e CHMI v olunt eers with ear ly , blood-stage inf ec tion (n = 22) M alar ia-exper i-enced C am -er oonian adults pr esenting
with naturally acquir
ed f ebr ile malar ia (n = 15) Similar induc tion of pr o-inflammat or y cyt ok
ines seen bet
w een pr e-sympt omatic and sympt omatic individu -als r egar
dless of pr
ior malar ia exposur e Rojas-P ena et al . (2015) and V allejo et al . (2018) Compar
ison of GEP
changes fr
om pair
ed
inf
ec
ted and unin
-fec ted samples Whole blood P. viv ax Columbian malar ia-naïv
e (MN) CHMI
volunt
eers at diag
-nosis (n
=
7)
Columbian malar
ia-exposed
(ME) CHMI volunt
eers at diag nosis (n = 9) Little diff er entiation seen bet w
een MN and ME
populations b y R ojas-Penas et al . Ho w ev er net w or k co -expr ession analysis b y Vallejo et al . sho w
ed the inflam
-mat or y r esponse was att enuat
ed in ME v
ol
-unt
eers with decr
eased
class II antigen pr
esen
-tation in dendr
itic cells No sig nificant diff er -ence bet w een g roups for pr e-pat ent per iod
or parasitaemia at diag
nosis suggest -ing ther e ma y ha ve
been no diff
er ence in func tional immunit y bet w een g roups Jagannathan et al . (2014) Compar
ison of GEP
bet
w
een g
roups
Vδ2
+ T
cells P. f alciparum Ugandan childr en with lo w pr ior malar ia incidence (n = 4) Ugandan childr en with lo w pr ior malar ia inci -dence (n = 4) Compar
ison of basal gene
expr ession patt er ns of sor ted , un-stimulat ed Vδ2
+ T cells identi
-fied 48 diff
er entially expr essed genes , man y with k no wn r oles in
immunomodulation. For each of these genes
,
expr
ession was higher
among childr en with high pr ior exposur e t o malar ia
Data suggest r
ecur rent malar ia inf ec tion causes up -r egulation of immunor egula -tor y path wa ys
that dampen the pro-inflammat
or y immune r esponse t o P. f alciparum inf ec tion
and help explain immunolog
ical t
oler
ance t
o the parasit
[image:11.595.67.473.87.710.2]Table
3
(c
on
tinued)
M
easur
e of NAI
Publica
tion
Desig
n
Sample
Species
Subjec
ts f
or c
omparison
Ke
y finding
Commen
t
Sympt
oms at diag
-nosis
Tran et
al
. (2016)
Compar
ison of GEP
changes fr
om pair
ed
inf
ec
ted and unin
-fec
ted samples
Whole blood
P. f
alciparum
M
alar
ia exper
ienced
M
alian childr
en
(>
13 y
ears) and
adults inf
ec
ted in
the field and asymp
-tomatic at diag
nosis
(EA, n
=
5)
M
alar
ia exper
i-enced M
alian
childr
en
(>
13
years) and adults infec
ted in the
field and symp
-tomatic with fever at the time of diag
nosis (EF
,
n
=
3)
Only 70 diff
er
entially
expr
essed genes
(DEGs) w
er
e identified
bet
w
een these g
roups
despit
e the appar
ent
clinical diff
er
ences
2 of the 5 individu
-als in the EA g
roup
pr
og
ressed t
o f
ebr
ile
malar
ia within 5
da
ys
of initial diag
nosis
by PCR
Disease se
ver
ity
Krupk
a et
al
. (2012)
Compar
ison of GEP
in same subjec
ts
at diag
nosis with
se
ver
e and subse
-quent mild malar
ia
Whole blood
P. f
alciparum
M
ala
wian childr
en who
, af
ter pr
esenting
with se
ver
e malar
ia (all had cer
ebral
malar
ia), w
er
e f
ound t
o ha
ve mild malar
ia
one month lat
er on scr
eening b
y blood
smear (n
=
5)
Path
wa
y analysis sho
w
ed
relativ
e up r
egulation
of
Type I IFN sig
nal
-ing path
wa
y, r
egula
-tion of inflamma-tion, regula-tion of leuk
oc
yt
e
pr
olif
eration and
T cell
ac
tivation in episodes of
mild malar
ia
Boldt et
al
. (2019)
Compar
ison of GEP
bet
w
een g
roups
Whole blood
P. f
alciparum
Health
y uninf
ec
ted
G
abonese childr
en
G
abonese childr
en with
asympt
omatic
parasitaemia, mild malar
ia,
malar
ia with
se
ver
e anaemia
and cer
-ebral anaemia (0.5–6
y
ears)
GEP of 22 genes sig
nifi
-cantly diff
er
ed among
gr
oups
. I
mmunoglobu
-lin pr
oduc
tion, comple
-ment r
egulation and
IFN beta sig
naling w
er
e
most conspicuous
PBM
C
per
ipher
al blood mononuclear c
ells
,
GEP
gene e
xpr
ession pr
ofile
,
CHMI
c
on
tr
olled human malar
ia inf
ec
[image:12.595.79.373.112.726.2]parasite densities and fewer symptomatic cases of P. fal-ciparum in the population of Fulani compared to other sympatric ethnic groups [33]. Comparison of the GEP of monocytes from infected and uninfected Fulani and Mossi adults showed a marked difference, with a signifi-cantly greater number of differentially expressed (DE) genes in infected Fulani compared to infected Mossi par-ticipants (1239 versus 3 DE genes respectively). Pathway analysis showed that infected Fulani, but not infected Mossi, individuals demonstrated a marked reduction in expression of inflammasome pathway components, suggesting a blunting of the innate pro-inflammatory immune response post-infection could explain the differ-ences in susceptibility.
Another study sought to examine the genetic basis of gene expression variation in malaria [36]. Idaghdour et al. compared GEP in children diagnosed with uncom-plicated malaria (n = 94) in Benin with age matched controls (n = 64) [36] and performed a genome wide association test of transcript abundance. Testing for gen-otype-by-infection interactions demonstrated the exist-ence of genome wide significant interactions and other genes subject to interaction effects beneath genome-wide significance but still likely to have important roles in modulating the course of infection. These interactions affected the complement system, antigen processing and presentation and T cell activation [36].
In work to identify a transcriptional signature to dis-tinguish acute malaria from other febrile illnesses, Grif-fiths et al. compared the GEP of twenty-two Kenyan children admitted with febrile illnesses (fifteen of which had malaria infection alone) with six convalescent sam-ples collected 2 weeks post discharge [23]. Two main GEPs relating to neutrophil and erythroid activity were shown to differentiate acutely ill and convalescent chil-dren, with significantly higher expression of genes in the neutrophil-related gene region in subjects with bacterial infections and significantly higher expression of genes related to lymphocyte and T cell activation in subjects with malaria. The authors also identified two gene pro-files whose expression intensity correlated with host parasitaemia.
Only two datasets included gene expression changes following P. vivax infection [28, 30, 37]. Rojas-Penas et al. interrogated GEP changes in malaria naïve (MN) and malaria-exposed (ME) Columbian volunteers following infection with P. vivax in a CHMI setting [28]. Significant GEP changes were consistent with time-point rather than prior malaria exposure, with a decline in innate immune signalling and neutrophil number (in contrast to strong up regulation of the same genes reported by Igadour et al. [36]) and an increase in interferon induction seen at diag-nosis. No significant GEP changes were noted at other
time points, including those relating to the liver stage of infection. Further analysis of this dataset by Vallejo et al. using network co-expression analysis showed that while P. vivax infection induced strong inflammatory responses in all participants, the inflammatory response was atten-uated with pathways associated with antigen processing and presentation less enriched in those with prior expo-sure to P. vivax, suggesting a more ‘tolerogenic’ immune response in these individuals [30].
In contrast to this work, Rothen et al. found that tran-scriptional changes post-CHMI via intradermal injection of cryopreserved P. falciparum sporozoites were most pronounced on day 5 after inoculation, during the clini-cally silent liver stage rather than during the blood-stage of infection [38].
Transcriptomic studies in specific cell types
Whilst the majority of studies examined the immune response from whole blood or PBMCs, some examined transcriptomic changes in other cell types or tissues [26, 33, 39–45]. For example, the work of Muehlenbachs et al. with placental tissue highlighted a previously unappre-ciated role for B cells in chronic placental malaria [39]; whilst Sullivan et al. compared GEPs of classical and ‘atypical’ memory B cells obtained from Ugandan chil-dren showing the latter demonstrated down-regulation of B cell receptor signalling and apoptosis [43].
Discussion
GEP is a powerful tool to analyse the immune response to infection. As this review demonstrates, the applica-tion of these studies for malaria are wide-ranging, from attempts to dissect the mechanisms of NAI to improving understanding of the interaction between host genotype and infection outcome. However, as a field in its rela-tive infancy, studies are often hypothesis generating with extremely small sample sizes. There is a lack of stand-ardization ranging from methodological (such as sample type, RNA extraction, platform and analysis) to pheno-type (including precision in disease context and immune status). This variation means interpreting published data and comparison between studies is challenging. Some of this is unavoidable, however, much could be addressed, for example by implementing standardization in blood sampling, methodological protocols for data genera-tion and analysis with robust significance testing and approaches to confounders, use of ontologies (for exam-ple human phenotype and gene ontologies) and expert curation and annotation of data on deposition [46–49].
correlate or universally accepted definition of NAI, meaning identifying the immune status of individuals or quantification of immunity is problematic [6, 50]. In field studies where the timing of infection and parasite burden and dynamics are unknown, and potentially hugely vari-able between individuals, only limited information can be reliably extrapolated from any GEP changes seen. Most studies assess gene expression from peripheral blood or its components, which does not provide reliable informa-tion regarding the transcripinforma-tional changes in key organs such as spleen, liver, and bone marrow. In addition, when subjects are recruited at presentation with disease, no baseline comparator data are available to use as a con-trol. Even if a clear difference in GEP were to be reported between individuals with and without NAI, it would be near impossible to distinguish GEP changes associated with parasitaemia from those mediating immunity.
However, there is much potential for the future use of GEP studies, particularly in CHMI studies [51, 52] where the parasite burden can be pre-defined and dynamics of infection closely monitored using highly sensitive qPCR. As these studies are increasingly performed in endemic settings [53–55], there will be growing opportunity to use GEP to understand detailed time-course changes in immune response, particularly at the skin, liver and pre-symptomatic blood-stage, which to date have been diffi-cult to study in human subjects infected in the field.
Conclusion
GEP in malaria is a potentially powerful tool, but to date studies have been hypothesis generating with small sam-ple sizes and widely varying methodology. As CHMI studies are increasingly performed in endemic settings, there will be growing opportunity to use GEP to under-stand detailed time-course changes in host response and understand in greater detail the mechanisms of NAI.
Supplementary information
Supplementary information accompanies this paper at https ://doi.
org/10.1186/s1293 6-019-3035-0.
Additional file 1: Figure S1. Flowchart summarizing identification of GEO datasets and publications.
Abbreviations
CHMI: controlled human malaria infection; GEO: gene expression omnibus; GEP: gene expression profile; NAI: naturally acquired immunity; PBMC: periph-eral blood mononuclear cells.
Acknowledgements
Not applicable.
Authors’ contributions
SH conceived the work, analysed the datasets and wrote the manuscript. JM conducted the methodological review of the datasets. HEL, SJD, AVSH, JCK and KM made significant contributions to the conception of the work. JCK
substantially revised the manuscript. All authors read and approved the final manuscript.
Funding
This work was supported by The Wellcome Trust [Grant Number 097940/Z/11/Z to SHH and Wellcome Trust Core Award Grant Number 090532/Z/09/Z]. SHH is a NIHR Academic Clinical Lecturer in Infectious Diseases & Microbiology at the University of Oxford and Research Fellow at St. Peter’s College, University of Oxford. SJD and AVSH are Jenner Investiga-tors, and SJD is also a Lister Institute Research Prize Fellow and a Wellcome Trust Senior Fellow [106917/Z/15/Z]. JCK is a Wellcome Trust Investigator. The funders had no role in the design, collection, analysis, or interpretation of data; in the writing of the manuscript; or in the decision to submit the manuscript for publication.
Availability of data and materials
Data sharing is not applicable to this article as no datasets were generated or analysed during the current study
Ethics approval and consent to participate
Not applicable.
Consent for publication
Not applicable.
Competing interests
The authors declare that they have no competing interests.
Author details
1 The Jenner Institute, University of Oxford, Old Road Campus Road Building,
Off Roosevelt Drive, Oxford OX3 7DQ, UK. 2 Department of Infectious Diseases
& Microbiology, Oxford University Hospitals Trust, Oxford, UK. 3 Wellcome
Centre for Human Genetics, University of Oxford, Oxford, UK. 4 Department
of Tropical Medicine, University of Oxford, Oxford, UK.
Received: 15 April 2019 Accepted: 26 November 2019
References
1. White NJ, Pukrittayakamee S, Hien TT, Faiz MA, Mokuolu OA, Dondorp AM. Malaria. Lancet. 2014;383:723–35.
2. Cockburn IA, Seder RA. Malaria prevention: from immunological concepts to effective vaccines and protective antibodies. Nat Immunol. 2018;19:1199–211.
3. WHO. World malaria report. Geneva: World Health Organization; 2018. 4. Cohen S, Mc GI, Carrington S. Gamma-globulin and acquired immunity
to human malaria. Nature. 1961;192:733–7.
5. Sabchareon A, Burnouf T, Ouattara D, et al. Parasitologic and clinical human response to immunoglobulin administration in falciparum malaria. Am J Trop Med Hyg. 1991;45:297–308.
6. Doolan DL, Dobano C, Baird JK. Acquired immunity to malaria. Clin Micro-biol Rev. 2009;22:13–36.
7. Conesa A, Mortazavi A. The common ground of genomics and systems biology. BMC Syst Biol. 2014;8(Suppl 2):S1.
8. Schulze A, Downward J. Navigating gene expression using microarrays— a technology review. Nat Cell Biol. 2001;3:E190–5.
9. Wang Z, Gerstein M, Snyder M. RNA-Seq: a revolutionary tool for tran-scriptomics. Nat Rev Genet. 2009;10:57–63.
10. Papalexi E, Satija R. Single-cell RNA sequencing to explore immune cell heterogeneity. Nat Rev Immunol. 2018;18:35–45.
11. Querec TD, Akondy RS, Lee EK, Cao W, Nakaya HI, Teuwen D, et al. Systems biology approach predicts immunogenicity of the yellow fever vaccine in humans. Nat Immunol. 2009;10:116–25.
12. Six A, Bellier B, Thomas-Vaslin V, Klatzmann D. Systems biology in vaccine design. Microb Biotechnol. 2012;5:295–304.