R E S E A R C H A R T I C L E
Open Access
National estimates of the impact of
electronic health records on the workload
of primary care physicians
Jaeyong Bae
1*and William E. Encinosa
2,3Abstract
Background:Eighty-four thousand primary care physicians have received $1.3 billion in HITECH payments for EHR adoption. However, little is known about how this will impact primary care workload efficiency and the national primary care shortage. This study examines whether EHR is associated with increases in face time with the patient per visit and increases in the physician’s patient volume per week.
Methods:We used a nationally representative sample of 37,962 patient visits to 1470 primary care physicians during the pre-HITECH years 2006–2009 from the restricted-access version of the National Ambulatory Medical Care Survey. Quantile regressions were used to estimate the effects of EHR use on patient face time per visit and physician’s patient volume per week at different points of the time and volume distributions.
Results:Primary care physicians with EHR spend an extra 1.3 face time minutes per visit, or 1.5 extra hours per week. This is 34,000 extra hours of face time per week in the U.S. However, physician age matters. Among young physicians, EHR use is associated with a decline in weekly patient volume, while EHR use among older physicians is associated with an increase in volume, regardless of initial practice size. If younger physicians behaved like older physicians when adopting EHR, there would be 37,600 additional patient visits per week in the U.S., the equivalent of adding 500 more primary care physicians to the U.S. workforce.
Conclusion:EHR can enhance productivity/efficiency in primary care physician workloads.
Keywords:Electronic health records, Physician workload, Efficiency of care, Primary care
Background
Primary care physicians are playing essential care coordi-nation roles in a number of recent health care reforms such as patient-centered care [1, 2], accountable care organizations (ACOs) [3], and medical homes [2]. How-ever, the ongoing shortage of primary care doctors in the U.S. is a major challenge to the success of these reforms. The number of office visits to primary care physicians is projected to increase from 462 million in 2008 to 565 million in 2025 [4]. A recent Senate report indicates that 16,000 additional primary care physicians are required to meet the current need, and the shortage is predicted to in-crease to 52,000 physicians by 2025, mainly due to the
coverage expansion through Medicaid and the Federal and State Marketplace exchanges under the Patient Protection and Affordable Care Act (ACA) [5].
Moreover, as the number of clinical guidelines increase for primary care in the shift away from specialty care, more time demands will be placed on primary care physicians. Yarnall et al. (2009) estimate that in order to implement all current national clinical guidelines for acute care, pre-ventive care, and chronic care, primary care physicians would need to work 21.7 hours per day [6]. Primary care physicians have expressed this concern—38 % re-port not spending enough time with their patients dur-ing a typical office visit (Center for Studydur-ing Health System Change, 2008) [7]. This has not gone unnoticed by the patient. Only 75 % of patients thought that doctors always spend enough time with them during the office visit (AHRQ, 2012) [8]. Other studies also found that insufficient
* Correspondence:[email protected]
1School of Nursing and Health Studies, Northern Illinois University, Wirtz Hall 257, Dekalb, IL 60115, USA
Full list of author information is available at the end of the article
physician’s time with patients is associated with lower pa-tient satisfaction and quality of care [9–11].
Health Information Technology (HIT) such as Electronic Health Records (EHRs) has the potential to address the primary care workforce shortage by improving the effi-ciency of primary care practices and the productivity of primary care physicians. In particular, when used effect-ively, EHRs increase the efficiency of healthcare delivery in primary care through enhancing workflow and decreasing redundant or inappropriate care [12–14]. To facilitate po-tential benefits due to the implementation and appropriate use of EHRs, the 2009 Health Information Technology for Economic and Clinical Health (HITECH) Act established the Medicare and Medicaid EHR program to encourage physicians to adopt the meaningful use of EHRs. As of June, 2013, 84,000 primary care physicians had received $1.3 billion in Medicare incentive payments for meaningful use EHR adoption [15]. Consequently, the basic EHR adoption rate for family physicians increased from 24.8 to 66.4 % during the period of 2005 to 2011 [16].
There is little research on how this HITECH expansion of EHR among primary care will improve primary care workload efficiency. While a few studies have found mixed results on the impact of EHR on patient face time with the physician, no research has yet examined the complete workload picture: time spent per visits and overall number of visits per week per physician [14, 17, 18]. It has been es-timated that each office visit requires an additional 7 min of administrative work by the physician outside of the visit, amounting to about 7.8 extra hours a week [19, 20]. Thus, if EHR could reduce this administrative time, more patients could be seen per week and more time could be spent per visit. In this paper, we use nationally representa-tive data to examine the effect of EHR use on overall pri-mary care physician workloads in terms of patient visits per week and time spent per visit. We also examine how these effects vary across younger and older physicians.
Methods
Data source
We used the 2006–2009 National Ambulatory Medical Care Survey (NAMCS). The NAMCS is a cross-sectional national probability sample survey administrated by the National Center for Health Statistics (NCHS) for the Centers for Disease Control and Prevention (CDC) [21]. The NAMCS collects data on patient office visits to non-federally employed office-based physicians in the United States. For each visit, physicians or staff members complete a one page survey form containing patient demographics, reasons for the visit, physicians’diagnoses, and physicians’ time spent in face-to-face patient care. Detailed descriptions of the survey are available from the authors and on the NAMCS website (http://www.cdc.gov/nchs/ahcd.htm). We examined 37,962 patient visits to 1470 primary care
physicians during 2006–2009 (general practitioners, family practitioners, and general internists). Through the NCHS Research Data Center, we have obtained access to a re-stricted version of the NAMCS data with information on physician’s age and the number of patient visits per phys-ician per week. We use 2006–2009 since it is the baseline period prior to the introduction of the HITECH EHR adop-tion subsidies.
Patient face time and patient volume
To gauge productivity/efficiency gains in primary care physician workloads, we use (1) duration of time measured in minutes of the face-to-face encounter between physi-cians and patients (patient face time) for direct patient care during the office visit, and (2) number of total patient office visits per physician per week (patient volume). Patient face time, self-reported by physicians, only includes time physi-cians spent with their patients. Time spent waiting to see physicians, reviewing patients’ medical records by physi-cians before seeing patients, and receiving care from non-physician clinicians are excluded. Physician’s number of patient visits per week is the count of patient visits during the survey week reported by physicians or office staffs.
Basic EHR use
The key independent variable of this study is a binary EHR adoption variable“basic EHRs”defined for NAMCS data by DesRoches et al. [22] The basic EHRs include at least 5 fundamental EHR functions: (1) patient demo-graphic information, (2) clinical notes, (3) computerized orders for prescriptions, (4) viewing laboratory results, and (5) viewing image results.
Statistical methods
estimates the impact of EHR on volume at three points in the distribution of patient volume: the 10th, 50th, and 90th quartiles of patient volume (20, 64, 120 visits per week). Time and volume are logged in all regressions.
Next, in each regression we construct indicators for young physicians (age 36 or younger) (12th percentile) and older physicians (age 62 or older) (88th percentile) and include interaction terms between these two indica-tors and ‘basic EHR’ to examine how the effect of the basic EHR use on physicians’ workload productivity varies across physician’s age. In addition to these interac-tions, our regressions control for 46 covariates: patient characteristics, health status of patients, visit characteris-tics, physicians characterischaracteris-tics, physician group charac-teristics, and other covariates such as geographic region, metropolitan statistical area (MSA) status, and survey year. MSA is delineated by the US Office of Manage-ment and Budget Census as a“core urban area of 50,000 or more population." MSA has been commonly used in literature to define urban/rural status. All the covariates with descriptive statistics are reported in Appendix 1.
Results
Raw trends in basic EHR use, patient face time, and patient volume by physician age
During 2006–2009, 19.9 % of primary care physicians had basic EHRs. Older physicians were less likely to adopt basic EHRs than younger physicians (column 1, Table 1). While 23.1 % of physicians aged 36 or less and 20.4 % of physicians aged between 37 and 61 had basic EHRs, only 13.6 % of physicians aged 62 or older had basic EHRs. Physicians with basic EHRs spent longer face time with their patients than physicians without basic EHRs across all physician age groups (column 2, Table 1). In general, under EHR adoption, physicians had fewer patient visits per week than without EHR. However, this was reversed for older physicians, who had more patient visits with EHR than without (column 3, Table 1). Moreover, older physicians that adopted EHR had more visits per week
than the young and middle-aged physicians that adopted. In the case of non-EHR adopting physicians, older phy-sicians had fewer visits per week than the young and middle-aged physicians. Thus, the raw data indicates that EHRs are associated with increases in the physi-cian’s face time with the patient regardless of physician age, whereas the association between EHRs and patient volume varies across physician age. Next, we see if these patterns persist once we control for patient and physician characteristics in multivariate regressions.
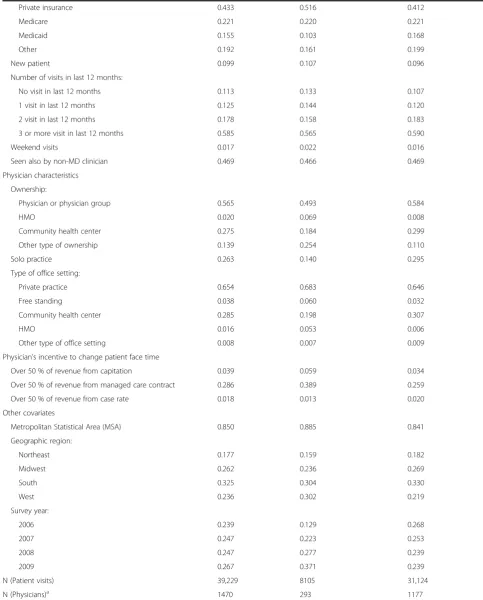
Estimated association between EHR use and patient face time
Figure 1 presents the impact of basic EHR on patient face time at selected levels of patient face time (10, 15, 20, 25, 30 min) by physician age group, estimated by quantile re-gressions controlling for 46 covariates (the rere-gressions are detailed in Appendix 2). Figure 1 is presenting the full in-cremental effects of EHR estimated from Table 2.1In Fig. 1, young physicians (age 36 or younger) using basic EHR con-sistently increased patient face time by 7-9 % at all points in the time distribution (p< .01). On the contrary, older physi-cians did not increase patient face time for visits of 10 min and 15 min (statistically insignificant), but raised patient face time by 12 %, 14 %, and 15 % for patient visits of 20 min, 25 min, and 30 min, respectively (p< .01).
[image:3.595.57.539.583.698.2]Overall, in terms of absolute magnitude, these effects can be expressed as follows: for 15 min visits, older physi-cians spent 1.4 min less per visit than younger physiphysi-cians due to EHR, but for 30 min visits, they spent 1.8 min more than younger physicians due to EHR. Thus, com-pared to younger physicians, there is a 3.2 min increase in face time over the range of visits (15 to 30 min) for older physicians that is entirely due to EHR. Note that at the mean visit time (19 min), young and old physicians behave about the same, spending 7 % more time with the patient (1.3 min,p< 0.001) under EHR than without EHR.2These extra 1.3 face time minutes per visit result in a total of 1.5 extra hours of face time per week under EHR. In the
Table 1Basic EHR use, patient face time, and physician’s number of patient visits per week by physician age (Unadjusted) Basic EHR usea Patient face time per visit,
in minutesb, Mean (SD)
Physician’s number of patient visits per weeka, Mean (SD)
All physicians Yes: 19.9 %
No: 80.1 %
20.4 (12.2) 19.0 (11.1)c
67.5 (35.7) 69.7 (46.4)c
Younger physicians (12 %) Yes: 23.1 % No: 76.9 %
20.1 (10.0) 18.8 (11.6)
62.3 (30.0) 65.1 (36.1)c
Middle-aged physicians (76 %) Yes: 20.4 % No: 79.6 %
20.5 (12.4)
18.9 (11.1)c 67.8 (36.0)72.3 (48.3)c
Older physicians (12 %) Yes: 13.6 % No: 86.4 %
20.9 (13.5) 19.4 (10.5)
73.7 (41.2) 58.6 (42.3)c
Note: Middle age is 37 to 61 a
Basic EHR use and physician’s patient visits per week are at the physician level b
Patient face time in minutes is at the visit level c
subsequent section, we will examine whether the increase in patient face time causes physicians to reduce the num-ber of visits over the week.
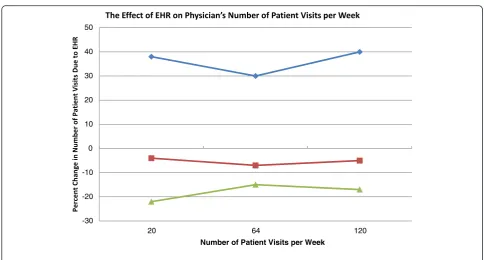
Estimated association between EHR use and the physician’s number of patient visits per week
Figure 2 shows the effect of basic EHR use on the physi-cian’s number of patient visits per week at the 10th, 50th, and 90thquantiles of patient volume (20, 64, 120 visits per week) by physician age group, estimated by quantile regres-sions (see Table 3). While basic EHR use reduced the young physician’s number of patient visits by 17-22 %, older physicians increased number of visits by 30-40 %, consistently across all scales of practice sizes. This indicates that EHRs are associated with increased weekly patient
volume among older physicians and with reduced patient volume among young physicians. In column 1, Table 3, the overall average impact of EHR on the young is the sum of the coefficients: EHR + EHR*young = -.027-.185 = -.212. Not shown, the standard error for this sum is estimated to be .126, so the full effect of -0.212 has ap-value < 0.09. Log retransformed, this is an effect of size -.19 as the average ef-fect of EHR on the number of weekly visits for young phy-sicians. For older physicians, the average effect is + .44 (p= 0.015). This amounts to an increase of 26 visits per week for older physicians with EHR compared to older physi-cians without EHR. For younger physiphysi-cians, EHR is associ-ated with a reduction of about 12 visits per week at the mean. Overall, young physicians with EHR have 53 visits per week compared to 85 visits for older physicians with -4
-2 0 2 4 6 8 10 12 14 16
10 15 20 25 30
Visit Length (minutes)
Older physicians Middle age physicians (age 37-61) Young physicians
[image:4.595.58.539.88.327.2]Fig. 1The estimated effect of EHR on patient face time. Note: Effects were estimated using the Table 2 quantile regressions controlling for patient and physician characteristics. All points are significantly different from zero at thep< .05 level except for 10 and 15 min visits for older physicians
Table 2Quantile regression estimates of the impact of EHR on patient face time per visit
Variables At mean visit 10 minute visit 15 minute visit 20 minute visit 25 minute Visit 30 minute visit
Key independent variables
Basic EHR 0.062*** (0.007) 0.053*** (0.012) 0.054*** (0.009) 0.104*** (0.012) 0.112*** (0.011) 0.117*** (0.011)
Young physician -0.009 (0.008) 0.009 (0.010) 0.010 (0.009) -0.006 (0.009) -0.032*** (0.010) -0.033*** (0.010)
Older physician 0.007 (0.008) -0.014 (0.012) -0.001 (0.012) 0.049*** (0.012) 0.026** (0.013) 0.030* (0.018)
Basic EHR * Young physician 0.005 (0.016) 0.016 (0.025) 0.009 (0.021) -0.027* (0.015) -0.030 (0.023) -0.034 (0.024)
Basic EHR * Older physician 0.006 (0.020) -0.053** (0.021) -0.073*** (0.026) 0.006 (0.031) 0.020 (0.051) 0.025 (0.048)
N= 37,962
Note: Visit-level data. Standard errors are in parentheses. Coefficients on other covariates are available inAppendix 2. Minutes are logged ***pvalue < .01
[image:4.595.58.540.586.697.2]EHR. When there is no EHR adoption, young physicians have 65 visits per week compared to 59 visits for older physicians. Among young physicians, EHR use is associ-ated with a decline in patient volume, while EHR use among older physicians is associated with an increase in volume. However, the countervailing effects between younger and older physicians cancel each other out, so that on average, basic EHR use had no statistically signifi-cant impact on overall physician visit volume per week at all levels of the volume distribution.
Discussion
In this study, we found that pre-HITECH adoption of EHR among primary care physicians from 2006–2009
was associated with 1.5 extra hours spent on patient face time per week for each physician, with no change in the overall number of visits per week. Since we are using nationally representative data, we estimate that this was 34,000 extra hours of face time per week in the U.S. in 2009 due to EHR. This extra time is likely productive. For example, using the same data, Furukawa has shown that EHR has improved the productivity of an office visit, increasing the number of diagnostic/screening services provided per 20-min period [18]. Another study has found that EHR use increased productivity, measured by the vol-ume and intensity of services per physician workday [24].
While this extra face time may be beneficial to the current patients, EHR does not seem to free up enough -30
-20 -10 0 10 20 30 40 50
20 64 120
Number of Patient Visits per Week
Older Physicians Middle Age Physicians Young Physicians
[image:5.595.55.540.83.343.2]Fig. 2The effect of EHR on physician’s number of patient visits per week. Note: Effects were estimated using the Table 3 quantile regressions controlling for patient and physician characteristics. The average effect for older physicians is significantly different from zero atp= 0.02. The average effect for young physicians is significantly different from zero atp= 0.09. The average effect for middle age physicians is not significantly different from zero
Table 3Quantile regression estimates of the impact of EHR on the physician’s number of patients per week (N= 1,470)
Variables At mean volume 20 visits 64 visits 120 visits
Basic EHR -0.027 (0.055) -0.040 (0.160) -0.072 (0.052) -0.053 (0.068)
Young physician 0.072 (0.066) 0.303*** (0.109) 0.038 (0.066) -0.125* (0.074)
Older physician -0.206*** (0.063) -0.212 (0.214) -0.208** (0.088) -0.158** (0.067)
Basic EHR * Young physician -0.185 (0.135) -0.212 (0.309) -0.094 (0.132) -0.136 (0.140)
Basic EHR * Older physician 0.403** (0.163) 0.363 (0.452) 0.331** (0.154) 0.390* (0.218)
N= 1,470
Note: Physician-level data. Standard errors are in parentheses. Coefficients on other covariates are available upon request. Number of patients (volume) is logged ***pvalue < .01
[image:5.595.58.540.599.697.2]time in the week for primary care physicians to see additional patients. This result indicates that EHR adoption is unlikely to help ease the shortage of primary care physi-cians, especially during the upcoming large insurance ex-pansion under the Patient Protection and Affordable Care Act (ACA). However, this study may provide some insight into how EHR may be adjusted to improve primary care workloads. For one subpopulation of physicians, EHR use did seem to free up enough time for the physicians to take on additional patients. Surprisingly, this efficient subpopu-lation was the older physicians (age > 61). They expanded visits per week by about 30-40 % whenever they used EHR. This was not simply an artifact of larger practices choosing to adopt EHR, or semi-retired physicians choosing not to adopt EHR. For example, we found this expansion effect among all older physicians, those with only 20 patients a week to those with 120 patients a week.
Another indication that this expansion effect is an effi-ciency effect of EHR is that older physicians had a dramat-ically different time management profile than younger physicians who used EHR. At the mean 19 min visit, older and younger physicians were alike, spending an extra 1.5 min of face time per visit due to EHR. However, their time management profiles changed for visits below and above the 19 min mean visit. For 15 min visits, older physi-cians spent 1.4 min less face time per visit than younger physicians due to EHR, but for 30 min visits, they spent 1.8 min more face time than younger physicians due to EHR. Thus, older physicians appear to be adjusting how they integrate EHR into clinical practice depending on the complexity of the patient visit. In contrast, young physicians always spend 7-9 % extra face time for every type of visit. This might possibly indicate young physicians are spending extra face time on routine EHR elements, such as keyboard entry and check list management. Older physicians might be engaging more complex patients with targeted patient education via the EHR functions. Indeed, these age-based results have been corroborated by a recent article on costs in Massachusetts. Mehrotra et al. (2012) found that physi-cians with fewer than 10 years of experience had 13.2 % higher overall costs than physicians with 40 or more years of experience. This was not due to malpractice claims or disciplinary actions, board certification status, or the size of the physician group, but appears to be due to older physi-cians having a more efficient practice style [25]. Thus, we should not be surprised to find that such an efficiency effect also holds with time and workload management among older physicians when they use a new technology such as EHR. Future research should examine how exactly older physicians are integrating the EHR into primary care to im-prove efficiency.
If younger physicians adopted the practice pattern that we find among older physicians with EHR, we may see some large workforce productivity gains due to EHR. For
example, as a very conservative estimate, if young physi-cians simply increased their number of visits per week from the raw data mean of 62 visits under EHR to that of the older physicians, 74 visits per week under EHR, we would have 37,600 additional patient visits per week in the U.S. Dividing this by 74 visits per physician per week, we con-clude that this would be the equivalent of introducing 508 new primary care physicians into the U.S. Thus, the work-load productivity of older physicians compared to younger physicians under EHR is equivalent to 508 additional physicians.
Our study has several limitations. First, our findings have limited generalizability and may not be applicable to non-U.S. ambulatory patient visits because the NAMCS only contains information on patient visits to office based physicians in the U.S. Second, the study did not account for physician’s years of experience with EHR which could moderate the association between EHR use and outcomes of interest in the study. Third, we used physician self-reported workloads. It has been shown that physicians often overestimate time spent with the patient [18]. But, since EHR logs the actual time spent, the difference in time between EHR and non-EHR physicians may be larger than what we actually estimate. Next, the use of cross-sectional NAMCS data may not infer a causal association between EHR use and physician’s productivity. It could be that older physicians with larger practices tend to adopt EHRs. However, a quantile regression method allows us to estimate the EHR impacts across the distribution, reflect-ing the distribution of unobserved characteristics associ-ated with both EHR use and physician’s productivity. Our results from quantile regressions shows that older physi-cians with any given number of patients, from 20 to 120, always have 30-40 % more patients if they have EHRs, in-dicative of EHRs possibly driving much of the increased capacity. In addition, our data does not allow assessment of the effects of EHR use on physician’s time spent on non-face time administrative activities. Moreover, our data does not have overall physician hours worked per week (i.e., including administrative time), nor percentages of full time physician employees in clinics, which would allow us to go further in assessing the actual productivity of the physicians. Future research should investigate the causal relation between EHR use and physician’s productivity in administrative work and direct patient care using panel data analyses.
Conclusion
in information technology, have lower workload prod-uctivity. Integrating EHR into primary care efficiently depends less on physician information technology cap-abilities, but more on their experience in clinical prac-tice. There may be substantial efficiency gains to be realized under EHR with better targeted training to younger physicians.
Availability of data and materials
The datasets supporting the conclusions of this article are available at “http://www.cdc.gov/nchs/ahcd/ahcd_ questionnaires.htm” except for the restricted NAMCS data, which is available on request to the Research Data Center, the National Center for Health Statistics, US center for Disease Control and Prevention.
Endnotes 1
For example, at 10 min visits for young physicians, the full impact of EHR from Table 2 is the sum of the coefficients: EHR + EHR*young = .053 + .016 = .069. Not shown, the standard error for this sum is estimated to be .017, so the full effect of 0.069 has a p-value < 0.001. This 0.069 is then log retransformed, giving 0.071 as the full effect of EHR on 10 min visit time for young physi-cians. This 0.071 effect is the point plotted in Fig. 1 for young doctors at 10 min visits. Similar computations underlie all the final full effects of EHR plotted in Ex-hibits 2 and 3.
2
For example, for the young physicians, the full effect of EHR in Table 2, col 1, is the sum of the coefficients: EHR + EHR*young = .067 (SE = .015). Log retransforming 0.067 gives a 7 % effect.
[image:7.595.59.538.335.725.2]Appendix 1
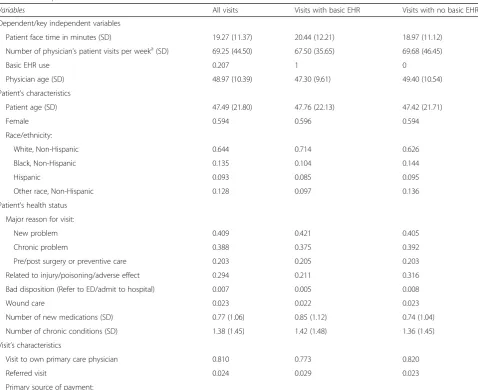
Table 4Descriptive Statistics
Variables All visits Visits with basic EHR Visits with no basic EHR
Dependent/key independent variables
Patient face time in minutes (SD) 19.27 (11.37) 20.44 (12.21) 18.97 (11.12)
Number of physician’s patient visits per weeka(SD) 69.25 (44.50) 67.50 (35.65) 69.68 (46.45)
Basic EHR use 0.207 1 0
Physician age (SD) 48.97 (10.39) 47.30 (9.61) 49.40 (10.54)
Patient’s characteristics
Patient age (SD) 47.49 (21.80) 47.76 (22.13) 47.42 (21.71)
Female 0.594 0.596 0.594
Race/ethnicity:
White, Non-Hispanic 0.644 0.714 0.626
Black, Non-Hispanic 0.135 0.104 0.144
Hispanic 0.093 0.085 0.095
Other race, Non-Hispanic 0.128 0.097 0.136
Patient’s health status
Major reason for visit:
New problem 0.409 0.421 0.405
Chronic problem 0.388 0.375 0.392
Pre/post surgery or preventive care 0.203 0.205 0.203
Related to injury/poisoning/adverse effect 0.294 0.211 0.316
Bad disposition (Refer to ED/admit to hospital) 0.007 0.005 0.008
Wound care 0.023 0.022 0.023
Number of new medications (SD) 0.77 (1.06) 0.85 (1.12) 0.74 (1.04)
Number of chronic conditions (SD) 1.38 (1.45) 1.42 (1.48) 1.36 (1.45)
Visit’s characteristics
Visit to own primary care physician 0.810 0.773 0.820
Referred visit 0.024 0.029 0.023
Table 4Descriptive Statistics(Continued)
Private insurance 0.433 0.516 0.412
Medicare 0.221 0.220 0.221
Medicaid 0.155 0.103 0.168
Other 0.192 0.161 0.199
New patient 0.099 0.107 0.096
Number of visits in last 12 months:
No visit in last 12 months 0.113 0.133 0.107
1 visit in last 12 months 0.125 0.144 0.120
2 visit in last 12 months 0.178 0.158 0.183
3 or more visit in last 12 months 0.585 0.565 0.590
Weekend visits 0.017 0.022 0.016
Seen also by non-MD clinician 0.469 0.466 0.469
Physician characteristics
Ownership:
Physician or physician group 0.565 0.493 0.584
HMO 0.020 0.069 0.008
Community health center 0.275 0.184 0.299
Other type of ownership 0.139 0.254 0.110
Solo practice 0.263 0.140 0.295
Type of office setting:
Private practice 0.654 0.683 0.646
Free standing 0.038 0.060 0.032
Community health center 0.285 0.198 0.307
HMO 0.016 0.053 0.006
Other type of office setting 0.008 0.007 0.009
Physician’s incentive to change patient face time
Over 50 % of revenue from capitation 0.039 0.059 0.034
Over 50 % of revenue from managed care contract 0.286 0.389 0.259
Over 50 % of revenue from case rate 0.018 0.013 0.020
Other covariates
Metropolitan Statistical Area (MSA) 0.850 0.885 0.841
Geographic region:
Northeast 0.177 0.159 0.182
Midwest 0.262 0.236 0.269
South 0.325 0.304 0.330
West 0.236 0.302 0.219
Survey year:
2006 0.239 0.129 0.268
2007 0.247 0.223 0.253
2008 0.247 0.277 0.239
2009 0.267 0.371 0.239
N (Patient visits) 39,229 8105 31,124
N (Physicians)a 1470 293 1177
Note: Standard deviations are in parentheses a
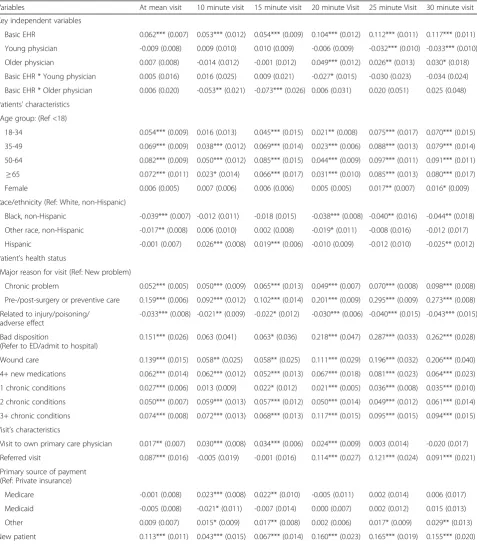
Appendix 2
Table 5Quantile regression estimates of the impact of EHR on patient face time per visit (All covariates)
Variables At mean visit 10 minute visit 15 minute visit 20 minute Visit 25 minute Visit 30 minute visit
Key independent variables
Basic EHR 0.062*** (0.007) 0.053*** (0.012) 0.054*** (0.009) 0.104*** (0.012) 0.112*** (0.011) 0.117*** (0.011)
Young physician -0.009 (0.008) 0.009 (0.010) 0.010 (0.009) -0.006 (0.009) -0.032*** (0.010) -0.033*** (0.010)
Older physician 0.007 (0.008) -0.014 (0.012) -0.001 (0.012) 0.049*** (0.012) 0.026** (0.013) 0.030* (0.018)
Basic EHR * Young physician 0.005 (0.016) 0.016 (0.025) 0.009 (0.021) -0.027* (0.015) -0.030 (0.023) -0.034 (0.024)
Basic EHR * Older physician 0.006 (0.020) -0.053** (0.021) -0.073*** (0.026) 0.006 (0.031) 0.020 (0.051) 0.025 (0.048)
Patients’characteristics
Age group: (Ref <18)
18-34 0.054*** (0.009) 0.016 (0.013) 0.045*** (0.015) 0.021** (0.008) 0.075*** (0.017) 0.070*** (0.015)
35-49 0.069*** (0.009) 0.038*** (0.012) 0.069*** (0.014) 0.023*** (0.006) 0.088*** (0.013) 0.079*** (0.014)
50-64 0.082*** (0.009) 0.050*** (0.012) 0.085*** (0.015) 0.044*** (0.009) 0.097*** (0.011) 0.091*** (0.011) ≥65 0.072*** (0.011) 0.023* (0.014) 0.066*** (0.017) 0.031*** (0.010) 0.085*** (0.013) 0.080*** (0.017) Female 0.006 (0.005) 0.007 (0.006) 0.006 (0.006) 0.005 (0.005) 0.017** (0.007) 0.016* (0.009)
Race/ethnicity (Ref: White, non-Hispanic)
Black, non-Hispanic -0.039*** (0.007) -0.012 (0.011) -0.018 (0.015) -0.038*** (0.008) -0.040** (0.016) -0.044** (0.018)
Other race, non-Hispanic -0.017** (0.008) 0.006 (0.010) 0.002 (0.008) -0.019* (0.011) -0.008 (0.016) -0.012 (0.017)
Hispanic -0.001 (0.007) 0.026*** (0.008) 0.019*** (0.006) -0.010 (0.009) -0.012 (0.010) -0.025** (0.012)
Patient’s health status
Major reason for visit (Ref: New problem)
Chronic problem 0.052*** (0.005) 0.050*** (0.009) 0.065*** (0.013) 0.049*** (0.007) 0.070*** (0.008) 0.098*** (0.008)
Pre-/post-surgery or preventive care 0.159*** (0.006) 0.092*** (0.012) 0.102*** (0.014) 0.201*** (0.009) 0.295*** (0.009) 0.273*** (0.008)
Related to injury/poisoning/ adverse effect
-0.033*** (0.008) -0.021** (0.009) -0.022* (0.012) -0.030*** (0.006) -0.040*** (0.015) -0.043*** (0.015)
Bad disposition
(Refer to ED/admit to hospital)
0.151*** (0.026) 0.063 (0.041) 0.063* (0.036) 0.218*** (0.047) 0.287*** (0.033) 0.262*** (0.028)
Wound care 0.139*** (0.015) 0.058** (0.025) 0.058** (0.025) 0.111*** (0.029) 0.196*** (0.032) 0.206*** (0.040)
4+ new medications 0.062*** (0.014) 0.062*** (0.012) 0.052*** (0.013) 0.067*** (0.018) 0.081*** (0.023) 0.064*** (0.023)
1 chronic conditions 0.027*** (0.006) 0.013 (0.009) 0.022* (0.012) 0.021*** (0.005) 0.036*** (0.008) 0.035*** (0.010)
2 chronic conditions 0.050*** (0.007) 0.059*** (0.013) 0.057*** (0.012) 0.050*** (0.014) 0.049*** (0.012) 0.061*** (0.014)
3+ chronic conditions 0.074*** (0.008) 0.072*** (0.013) 0.068*** (0.013) 0.117*** (0.015) 0.095*** (0.015) 0.094*** (0.015)
Visit’s characteristics
Visit to own primary care physician 0.017** (0.007) 0.030*** (0.008) 0.034*** (0.006) 0.024*** (0.009) 0.003 (0.014) -0.020 (0.017)
Referred visit 0.087*** (0.016) -0.005 (0.019) -0.001 (0.016) 0.114*** (0.027) 0.121*** (0.024) 0.091*** (0.021)
Primary source of payment (Ref: Private insurance)
Medicare -0.001 (0.008) 0.023*** (0.008) 0.022** (0.010) -0.005 (0.011) 0.002 (0.014) 0.006 (0.017)
Medicaid -0.005 (0.008) -0.021* (0.011) -0.007 (0.014) 0.000 (0.007) 0.002 (0.012) 0.015 (0.013)
Other 0.009 (0.007) 0.015* (0.009) 0.017** (0.008) 0.002 (0.006) 0.017* (0.009) 0.029** (0.013)
Competing interests
The authors declare that they have no competing interests.
Authors’contributions
JB and WEE jointly worked on the concept/design of the study, acquisition, analysis, and interpretation of data for the work; JB and WEE jointly wrote and edited the manuscript. Both authors read and approved the final manuscript.
Authors’information
Jaeyong Bae, Ph.D., is an Assistant Professor of Public health in School of Nursing and Health Studies at Northern Illinois University. William E. Encinosa, Ph.D., is senior economist at the Center for Delivery, Organization and Markets, Agency for Healthcare Research and Quality, and an Adjunct Professor at McCourt School of Public Policy.
Acknowledgement
The authors gratefully acknowledge the support of the Research Data Center, the National Center for Health Statistics for the use of restricted NAMCS data. They thank Ajay Yesupriya for help with the restricted NAMCS data.
Author details
1
School of Nursing and Health Studies, Northern Illinois University, Wirtz Hall 257, Dekalb, IL 60115, USA.2Center for Delivery, Organization and Markets, Agency for Healthcare Research and Quality, 5600 Fishers Ln, Rockville, MD 20857, USA.3McCourt School of Public Policy, Georgetown University, Washington, DC, USA.
[image:10.595.60.537.98.536.2]Received: 2 July 2015 Accepted: 30 April 2016
Table 5Quantile regression estimates of the impact of EHR on patient face time per visit (All covariates)(Continued)
Number of visits in last 12 months (Ref: No visit)
1 visit -0.010 (0.012) -0.011 (0.015) -0.006 (0.016) -0.021 (0.015) -0.002 (0.015) -0.003 (0.023)
2 visits -0.031*** (0.012) -0.027** (0.013) -0.018 (0.013) -0.027* (0.015) -0.024 (0.016) -0.031 (0.022)
3+ visits -0.031*** (0.010) -0.021 (0.014) -0.014 (0.012) -0.034** (0.014) -0.040*** (0.013) -0.044** (0.019)
Weekend visit -0.053*** (0.017) -0.052** (0.026) -0.082** (0.035) -0.019 (0.015) -0.068*** (0.022) -0.058 (0.035)
Seen also by non-MD clinician -0.003 (0.005) -0.006 (0.005) -0.003 (0.006) -0.011 (0.007) -0.006 (0.008) 0.003 (0.010)
Physician characteristics
Ownership
(Ref: physician or physician group)
HMO 0.070*** (0.020) 0.094*** (0.032) 0.057*** (0.018) 0.102*** (0.021) 0.024 (0.022) 0.036 (0.037)
Community health center -0.075*** (0.021) -0.040*** (0.012) -0.057*** (0.016) -0.039** (0.019) -0.060** (0.024) -0.086*** (0.032)
Other type of ownership -0.033*** (0.007) -0.043*** (0.012) -0.049*** (0.016) -0.016* (0.009) -0.034*** (0.009) -0.042*** (0.011)
Solo practice 0.058*** (0.006) 0.022*** (0.006) 0.031*** (0.006) 0.065*** (0.007) 0.077*** (0.008) 0.074*** (0.010)
Type of office setting (Ref: Private practice)
Free standing 0.001 (0.012) 0.045** (0.019) 0.059*** (0.010) -0.009 (0.015) -0.051*** (0.013) -0.092*** (0.018)
Community health center 0.090*** (0.020) 0.080*** (0.016) 0.094*** (0.017) 0.077*** (0.023) 0.067*** (0.024) 0.082** (0.032)
HMO -0.087*** (0.022) -0.170*** (0.052) -0.098*** (0.034) -0.049** (0.020) -0.084*** (0.020) -0.103*** (0.029)
Other type of office setting 0.133*** (0.026) 0.160*** (0.031) 0.140*** (0.021) 0.132*** (0.045) 0.159*** (0.059) 0.134*** (0.034)
Physician’s incentive to change patient face time
Over 50 % of revenue from capitation -0.057*** (0.012) -0.041*** (0.014) -0.038** (0.018) -0.047*** (0.009) -0.099*** (0.015) -0.101*** (0.022)
Over 50 % of revenue from managed care contract
0.009 (0.005) 0.028*** (0.010) 0.048*** (0.008) -0.002 (0.006) -0.008 (0.007) -0.016** (0.008)
Over 50 % of revenue from case rate 0.040** (0.017) 0.005 (0.024) -0.019 (0.026) 0.078*** (0.029) 0.081** (0.041) 0.105*** (0.022)
Other covariates
Metropolitan Statistical Area (MSA) 0.018*** (0.007) 0.034*** (0.009) 0.022* (0.013) 0.007 (0.007) -0.012 (0.011) -0.022** (0.011)
Geographic Region (Ref: Northeast)
Midwest 0.001 (0.007) -0.056*** (0.018) -0.092*** (0.021) 0.002 (0.010) 0.019* (0.010) 0.020* (0.011)
South 0.005 (0.007) -0.042** (0.019) -0.024 (0.016) 0.009 (0.011) 0.036*** (0.011) 0.040*** (0.011)
West 0.064*** (0.007) 0.165*** (0.022) 0.069*** (0.011) 0.014 (0.010) 0.064*** (0.012) 0.080*** (0.013)
N= 37,962
Note: Visit-level data. Standard errors are in parentheses. Survey year dummies are not shown. Minutes are logged ***pvalue < .01
References
1. Davis K, Schoenbaum SC, Audet AM. A 2020 vision of patient‐centered primary care. J Gen Intern Med. 2005;20(10):953–7.
2. Rittenhouse DR, Shortell SM. The patient-centered medical home: will it stand the test of health reform? JAMA. 2009;301(19):2038–40.
3. Goldsmith J. Accountable care organizations: the case for flexible partnerships between health plans and providers. Health Aff. 2011;30(1):32–40.
4. Petterson SM, Liaw WR, Phillips RL, Rabin DL, Meyers DS, Bazemore AW. Projecting US primary care physician workforce needs: 2010-2025. Ann Fam Med. 2012;10(6):503–9.
5. U.S. Senate Subcommittee on Primary Health and Aging. 2013. Primary Care Access. http://www.sanders.senate.gov/imo/media/doc/
PrimaryCareAccessReport.pdf. Accessed 4 May 2016.
6. Yarnall KS, Østbye T, Krause KM, Pollak KI, Gradison M, Michener JL. Family physicians as team leaders:“time”to share the care. Prev Chronic Dis. 2009;6(2):A59. 7. Center for Studying Health System Change. 2008. Physician Survey. http://
hscdataonline.s-3.com/psurvey.asp. Accessed 4 May 2016.
8. AHRQ (Agency for healthcare Research and Quality). The 2012 CAHPS database: the CAHPS clinician & group survey: Adult 12-Month 6-pt Scale Results. Rockville, MD: AHRQ; 2012. http://cahps.ahrq.gov/clinician_group/ cgdata/a6topboxscores.htm. Accessed 16 Jan. 2014.
9. Burdi MD, Baker LC. Physicians’perceptions of autonomy and satisfaction in California. Health Affair. 1999;18(4):134–45.
10. Lin CT, Albertson GA, Schilling LM, et al. Is patients’perception of time spent with the physician a determinant of ambulatory patient satisfaction? Arch Intern Med. 2001;161(11):1437–42.
11. Gross DA, Zyzanski SJ, Borawski EA, Cebul RD, Stange KC. Patient satisfaction with time spent with their physician. J Fam Pract. 1998;47(2):133–7. 12. Chaudhry B, Wang J, Wu S, et al. Systematic review: impact of health
information technology on quality, efficiency, and costs of medical care. Ann Intern Med. 2006;144:742–52.
13. Orszag PR. Evidence on the costs and benefits of health information technology. Testimony before the Subcommittee on Health Committee on Ways and Means U.S. House of Representative. Congressional Budget Office: Washington, DC. July 24, 2008. http://www.cbo.gov/sites/ default/files/cbofiles/ftpdocs/95xx/doc9572/07-24-healthit.pdf.
Accessed 4 May 2016.
14. Poissant L, Pereira J, Tamblyn R, Kawasumi Y. The impact of electronic health records on time efficiency of physicians and nurses: a systematic review. J Am Med Inform Assoc. 2005;12(5):505–16.
15. Centers for Medicare and Medicaid Services. Active Registrations: EHR Incentive Program. http://www.cms.gov/Regulations-and-Guidance/ Legislation/EHRIncentivePrograms/Downloads/June_Medicare_ EHRIncentivePayments.pdf. Accessed 4 May 2016.
16. Xierali IM, Hsiao CJ, Puffer JC, et al. The rise of electronic health record adoption among family physicians. Ann Fam Med. 2013;11(1):14–9. 17. Pizziferri L, Kittlera AF, Volka LA, et al. Primary care physician time
utilization before and after implementation of an electronic health record: a time-motion study. J Biomed Inform. 2005;38(3):176–88. 18. Furukawa MF. Electronic medical records and efficiency and productivity
during office visits. Am J Manag Care. 2011;17(4):296–303.
19. Gilchrist V, McCord G, Schrop SL, et al. Physician activities during time out of the examination room. Ann Fam Med. 2005;3(6):494–9.
20. Farber J, Siu A, Bloom P. How much time do physicians spend providing care outside of office visits? Ann Intern Med. 2007;147(10):693–8. 21. Hsiao CJ, Cherry DK, Beatty PC, et al. National Ambulatory Medical Care
Survey: 2007 summary. Natl Health Stat Rep. 2010;27:1–32.
22. DesRoches CM, Campbell EG, Rao SR, et al. Electronic health records in ambulatory care-a national survey of physicians. N Engl J Med. 2008; 359(1):50–60.
23. Greene W. Econometric analysis. New York: Prentice Hall; 2012. p. 207–10. 24. Adler-Milstein J, Huckman RS. The impact of electronic health record use on
physician productivity. Am J Manag Care. 2013;19(10 Spec No):SP345–52. 25. Mehrotra A, Reid RO, Adams JL, et al. Physicians with the least experience
have higher cost profiles than do physicians with the most experience. Health Aff. 2012;31(11):2453–63.
• We accept pre-submission inquiries
• Our selector tool helps you to find the most relevant journal
• We provide round the clock customer support
• Convenient online submission
• Thorough peer review
• Inclusion in PubMed and all major indexing services • Maximum visibility for your research
Submit your manuscript at www.biomedcentral.com/submit