Open Access
Methodology
A strategy for detection of known and unknown SNP using a
minimum number of oligonucleotides applicable in the clinical
settings
Ena Wang
1, Sharon Adams
1, Yingdong Zhao
2, Monica Panelli
1,
Richard Simon
2, Harvey Klein
1and Francesco M Marincola*
1Address: 1Immunogenetics Section, Department of Transfusion Medicine, Clinical Center, National Institutes of Health, Bethesda, MD USA and 2Biometric Research Branch, Division of Cancer Treatment and Diagnosis, National Cancer Institute, National Institutes of Health, Bethesda, MD,
USA
Email: Ena Wang - [email protected]; Sharon Adams - [email protected]; Yingdong Zhao - [email protected]; Monica Panelli - [email protected]; Richard Simon - [email protected]; Harvey Klein - [email protected]; Francesco M Marincola* - [email protected]
* Corresponding author
Abstract
Detection of unknown single nucleotide polymorphism (SNP) relies on large scale sequencing expeditions of genomic fragments or complex high-throughput chip technology. We describe a simplified strategy for fluorimetric detection of known and unknown SNP by proportional hybridization to oligonucleotide arrays based on optimization of the established principle of signal loss or gain that requires a drastically reduced number of matched or mismatched probes. The array consists of two sets of 18-mer oligonucleotide probes. One set includes overlapping oligos with 4-nucleotide tiling representing an arbitrarily selected "consensus" sequence (consensus-oligos), the other includes oligos specific for known SNP within the same genomic region (variant-oligos). Fluorescence-labeled DNA amplified from a homozygous source identical to the consensus represents the reference target and is co-hybridized with a differentially-labeled test sample. Lack of hybridization of the test sample to consensus- with simultaneous hybridization to variant-oligos designates a known allele. Lack of hybridization to consensus- and variant-oligos indicates a new allele. Detection of unknown variants in heterozygous samples depends upon fluorimetric analysis of signal intensity based on the principle that homozygous samples generate twice the amount of signal. This method can identify unknown SNP in heterozygous conditions with a sensitivity of 82% and specificity of 90%. This strategy should dramatically increase the efficiency of SNP detection throughout the human genome and will decrease the cost and complexity of applying genomic wide analysis in the context of clinical trials.
Background
The human genome project provides the first reference sequence of all human chromosomes with the remaining challenge of characterizing the frequency of deviations from this reference among individuals [1]. It is estimated
that 1.42 million SNP are distributed throughout the human genome and about 60,000 SNP fall within exons [2]. Detection of SNP due to genetic variation in a given population (polymorphisms) or epigenetic changes throughout life (mutations) is important since it often has Published: 20 August 2003
Journal of Translational Medicine 2003, 1:4
Received: 02 July 2003 Accepted: 20 August 2003
This article is available from: http://www.translational-medicine.com/content/1/1/4
whether the prevalence of common diseases can be truly attributed, at least in part, to SNP because of the incom-plete information available about SNP prevalence throughout the genome. The completion of the human genome project could not provide comprehensive knowl-edge about sequence variations because sequences are based on information derived from randomly chosen individuals [1,2] and there are only few examples of sys-tematic searches for genetic variants within a specific genomic region [7]. However, in the context of clinical research a large number of individuals may need to be screened when investigating associations between genetic variation and disease susceptibility. In such an endeavor, a tool capable of efficiently identifying known and flag-ging unknown SNP could dramatically increase the effi-ciency of the study of human pathology through direct application of genome-derived information [8].
Known SNP can be readily detected using oligo-array-based techniques [9–12] or comparable high-throughput systems [13]-[14,15]. Detection of unknown SNP,
how-ever, is not as readily achievable because most current methodologies are based on the utilization of probes encompassing only known variant sequences [16,17]. Thus, identification of unknown SNP has relied on high-throughput sequencing which is burdened by high cost and demanding requirements for sample preparation. To improve the efficiency of SNP detection, high-density oli-gonucleotide arrays have been proposed that cover all possible sequence permutations of the genomic region of interest [7,9,18,19]. These arrays are characterized by extreme accuracy not only for detecting but also in provid-ing definitive sequence information about SNP [9]. How-ever, for each genomic region a complex SNP array needs to be assembled as for the 4L (length of nucleotide) oli-gomer probes [9]. These arrays are composed of olioli-gomer probes that query sequential positions in the genome spanning the length of the probe each one overlapping the previous one of one base. For each position a set of four oligos is prepared identical except at a single, gener-ally central, position systematicgener-ally substituted with each of the four nucleotides. Thus for a given genomic region a number of oligos equal to the number of bp investigated times 4 is spotted to the array. To query a 16,569-base pairs (bp) sequence 66,276 probes were necessary [9]. Similarly others have investigated BRCA1 and ATM genes using 96,600 and >90,000 oligonucleotides for genomic regions encompassing 3,450 and 9,170 bp respectively [10,19]. Although this approach could potentially cover the full genome, it might not be justified for genomic areas with no polymorphism [9]. In addition, preparation of these arrays would be disproportionate for genomic
tiled arrays or other comprehensive high-throughput sys-tems. Finally, this approach would not be justifiable in sit-uation where SNP occur extremely rarely in a given population. In those cases a tool that could identify the rare individuals carrying SNP could indicate few instances where routine sequencing of a limited genomic region could be more appropriate than the preparation of com-plex high-density arrays. Thus, a simplified screening tool that could discriminate conserved from polymorphic genomic regions or identify rare individuals carrying unu-sual SNP could dramatically restrict the use of throughput sequencing or guide the production of high-density 4L tiled arrays.
Results
refer to the various combinations by specifying ad hoc
whether we are referring to the whole gene or a specific region of the same gene.
To illustrate this strategy, we selected a region of the human genome spanning exon 2 of the Human Leukocyte Antigen (HLA)-A locus, which contains multiple poly-morphic sites (Figure 1). This gave us the opportunity to identify different homo- heterozygous combinations using genomic DNA from previously classified HLA-typed Epstein-Barr virus-transformed B lymphoblastoid (EBV) cell lines obtained from the European Collection of Ani-mal Cell Cultures. The HLA type of all cell lines was
veri-fied using sequence-based typing methods [20]. According to conventional display, the HLA-A*0101 sequence was chosen as the consensus http://www.antho nynolan.com/HIG/data.html. A set of 75 18-mer oligos with 4-nucleotide tiling were selected to cover the HLA-A*0101 allele from position 71 to 343. In addition, sev-eral variant oligos relevant to the HLA phenotype of the EBV lines tested were designed (Figure 2) with the SNP in the centermost position to enhance the power of discrim-ination caused by single nucleotide mismatch. Other known SNP close to the 3' region were not covered by var-iant oligos to test the capability to detect unknown vari-ants ("unknown SNP" displayed in black in Figure 1). HLA-A Locus, Exon II nucleotide sequence alignment of alleles relevant to the discussion of this manuscript
Figure 1
HLA-A Locus, Exon II nucleotide sequence alignment of alleles relevant to the discussion of this manuscript. The consensus sequence is shown in green in areas containing polymorphic sites and in yellow at conserved areas (k oligos). Genomic regions covered by variant oligos are indicated by boxes with colored borders (red: HLA-A*02; violet: sub-types of HLA-A*02 differ-ent from A*0201; green: HLA-A*0301, purple: HLA-A*2301; blue: HLA-A*29) corresponding to the sequences shown in Fig-ure 2. Dashed borders indicate overlapping oligos. Dotted borders indicate variant oligos 1-SP-A-02a and b that contain an additional G > A switch in a peripheral region to test the influence of this mismatch in various conditions. In black are SNP in areas for which no variant alleles were designed ("unknown SNP"). The dashed line represents the areas where most "unknown SNP" are present for HLA-A*02 and A*29 (blue) or only for HLA-A*02 (orange).
80 90 100 110 120 130 140 150 160 * * * * * * * * *
A*0101 GCGGGCTCCCACTCCATGAGGTATTTCTTCACATCCGTGTCCCGGCCCGGCCGCGGGGAGCCCCGCTTCATCGCCGTGGGCTACGTGGACG
A*0201 ---T---A ---A*0205 ---T---A---C---A ---A*0206 ---T---A---C---A ---A*0210 ---T---A---C---A ---A*0301 ---A*2301 --A---C---A*2901
---AC---170 180 190 200 210 220 230 240 250 * * * * * * * * *
A*0101 ACACGCAGTTCGTGCGGTTCGACAGCGACGCCGCGAGCCAGAAGATGGAGCCGCGGGCGCCGTGGATAGAGCAGGAGGGGCCGGAGTATT
A*0201 ---G---T ---A*0205 ---G--G---T ---A*0206 ---G---T ---A*0210 ---G---T ---A*0301 ---G ---A*2301 ---G ---A*2901 ---T---G
---A---260 270 280 290 300 310 320 330 340 * * * * * * * * *
A*0101 GGGACCAGGAGACACGGAATATGAAGGCCCACTCACAGACTGACCGAGCGAACCTGGGGACCCTGCGCGGCTACTACAACCAGAGCGAGGACG
A*0201 ---GG ---AG---C---T-G---C—-A*0205 ---GG ---AG---C---T-G---C—-A*0206 ---GG---AG---C---T-G---C— A*0210 ---GG ---AG---C---T-G---C--A*0301 ---G---G ---T-G---C--A*2301 ---G---G----AG---A ---C---T-GC--T-C---C--A*2901
In case of a,a homozygosity, similar fluorescence intensity is expected in both channels with a theoretical Cy5/Cy3 fluorescence intensity ratio = 1 (LogRatio = 0). This can be experimentally tested by arbitrarily selecting genomic fragments within the investigated region that, based on available information, are most likely conserved in every potential test sample (displayed in yellow in Figure 1) [2]. In this region, reference and test samples can be predicted to be a,a homozygous. Consistent deflection from 0 of
LogRatios in these oligos denotes biases of labeled target or
reference. Thus, the average of the LogRatio for these oligos is used as a normalization factor, constant (k), to correct the bias of both channels in the rest of the data set. The unlikely occurrence of SNP within the constant region could still be detected since in such cases, the LogRatio of one oligo will diverge from the rest of the constant region oligos.
After normalization, individual oligos are investigated. Homozygosity (a,a) is characterized by LogRatio ~0, digit-ally displayed as yellow in the array image (Figure 3, row I). Conversely, in the context of homozygosity different from the consensus (b,b), specific hybridization of the test sample to the variant oligo results in strong red (Cy5) sig-nal (Va1 in Figure 3, row II) while the consensus oligo spanning the same region reveals strong green signal caused by hybridization of the reference sample only (Fig-ure 3, row II). Non-specific low affinity hybridization to an irrelevant variant oligo spanning the same regions is similar for both reference and test sample resulting in flu-orescence intensity ratios close to 1 (LogRatio ~0) (Va2 in
Figure 3, row II).
[image:4.612.83.511.140.401.2]Since human genomes are diploid, polymorphisms can occur in combinations and, therefore, detection of SNP Variant oligos used in this study
Figure 2
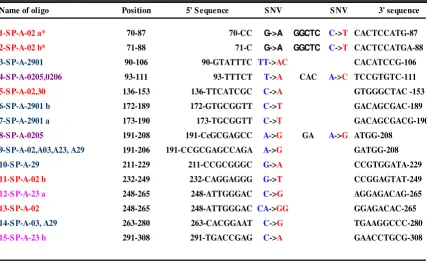
Variant oligos used in this study. Oligos are color coded to correspond to the regions described in Figure 1. *1-SP-A-02a and 1-SP-A-02b contain one HLA-A*0201-specific mismatch and one additional mismatch (G > A in position 72).
Name of oligo Position 5' S equence S NV S NV 3' sequence
1-S P-A-02 a* 70-87 70-CC G->A GGCTC C->T CACTCCATG-87
2-S P-A-02 b* 71-88 71-C G->A GGCTC C->T CACTCCATGA-88
3-S P-A-2901 90-106 90-GTATTTC TT->AC CACATCCG-106
4-S P-A-0205,0206 93-111 93-TTTCT T->A CAC A->C TCCGTGTC-111
5-S P-A-02,30 136-153 136-TTCATCGC C->A GTGGGCTAC -153
6-S P-A-2901 b 172-189 172-GTGCGGTT C->T GACAGCGAC-189
7-S P-A-2901 a 173-190 173-TGCGGTT C->T GACAGCGACG-190
8-S P-A-0205 191-208 191-CcGCGAGCC A->G GA A->G ATGG-208
9-S P-A-02,A03,A23, A29 191-206 191-CCGCGAGCCAGA A->G GATGG-208
10-S P-A-29 211-229 211-CCGCGGGC G->A CCGTGGATA-229
11-S P-A-02 b 232-249 232-CAGGAGGG G->T CCGGAGTAT-249
12-S P-A-23 a 248-265 248-ATTGGGAC C->G AGGAGACAG-265
13-S P-A-02 248-265 248-ATTGGGAC CA->GG GGAGACAC-265
14-S P-A-03, A29 263-280 263-CACGGAAT C->G TGAAGGCCC-280
should be possible in the context of heterozygosity. This discrimination can be achieved through fluorimetric assessment of the hybridization pattern based on the gen-eral principle that homozygous samples (two identical alleles) will generate twice the amount of signal for a given sequence than a heterozygous sample (Figure 3, rows III-VII). In the context of heterozygosity, a single allele hybridization to variant oligos generates a weaker
signal than in the homozygous condition resulting in a lower LogRatio (specific hybridization over background). (Figure 3, row III-V Va1 and row IV Va2). Competitive
hybridization to consensus oligos will lead to two pat-terns. In a,b heterozygosity (portrayed as lighter green by the digital image) at least one allele of the test sample will hybridize to the consensus resulting in LogRatio depres-sion of lesser magnitude (lighter green) than in b,b
Principle of fluorimetric detection of SNP by proportional hybridization to oligonucleotide arrays in homozygous and hetero-zygous conditions
Figure 3
Principle of fluorimetric detection of SNP by proportional hybridization to oligonucleotide arrays in homozygous and hetero-zygous conditions. Portrait of proportional hybridization (of differentially labeled reference (Cy3) and test (Cy5) sample to overlapping oligos encompassing an arbitrarily chosen "consensus" sequence (consensus oligos = CO) or variant-specific oligos (Va1 and Va2...., see Figures 1 and 2). The homozygous reference sample consists of two alleles identical to the consensus sequence (HLA-A*0101). Differentially fluorescence-labeled reference and test samples are co-hybridized to an array slide spotted with the 18-nucleotide overlapping consensus oligos and variant oligos. Four consensus oligos representing a "con-served" region (k) were used to normalize the data set (see text). Reference sample consistently hybridizes to CO and never to Va oligos. Hybridization of test sample will determine variability in ratio of fluorescence intensity as portrayed by the digital images from a GenePix scanner. Possible combinations are: I) a,a type homozygosity (row I); II) b,b homozygosity (row II); III)
a,b heterozygosity with one known allele (row III) and one unknown allele (row VII); IV) b,c heterozygosity with two known alleles (row IV), one known and one unknown allele (row V) and two new alleles (row VI). Question marks represent the hypothetical discovery of new allele(s).
Reference consensus DNA from homozygous source
two identical alleles CO1and CO2
Test DNA
two alleles:
Test
1and Test
2Fluorescence intensity
+
=
Va
2….……..I)
II)
III)
IV)
V)
VI)
VII)
Va
1-
-co
k
-a,ahomozygosity
b,bhomozygosity
a,bheterozygosity
a,?heterozygosity b,cheterozygosity
b,?heterozygosity
homozygosity where none of the test samples hybridizes to the consensus (Figure 3, row III and VII). In b,c hetero-zygosity none of the alleles hybridizes to consensus oligos and, therefore, a situation similar to b,b homozygosity occurs in the consensus oligos with strongly depressed
LogRatios (Figure 3, row IV-VI).
[image:6.612.78.542.105.457.2]Hybridization conditions were optimized at variable incubation times (Figure 4a) and temperatures (Figure 4b). Temperatures of 47°C for at least 4 hours yielded the best hybridization results that were adopted thereafter. Target density had no major repercussion on fluorescence intensity ratio beyond 80 ng (data not show). Labeling bias was assessed in conditions of a,a homozygosity by co-hybridizing samples from an HLA-A*0101 source dif-Effect of hybridization time (a) and temperature (b) in conditions of b,b type homozygosity (HLA-A*2091 labeled with Cy5 vs HLA-A*0101 labeled with Cy3)
Figure 4
Effect of hybridization time (a) and temperature (b) in conditions of b,b type homozygosity (HLA-A*2091 labeled with Cy5 vs
ferentially labeled with Cy5 and Cy3 (Figure 4c). Good correlation of Cy5 with Cy3 signal intensity was observed based on individual oligo although the kinetics of hybrid-ization varied remarkably among different oligos Figure 4d. In general, the hybridization efficiency correlated to the theoretical expectation that the variant oligos (red in the scatter plot) should have low affinity for HLA-A*0101 targets. However, exceptional variant oligos with strong hybridization affinity to HLA-A*0101 and, conversely, a cluster of consensus oligos (average CG content = 75%, range 67 to 94%) with poor hybridization kinetics (blue in the scatter plot) were noted. Strong hybridization of the reference sample to a variant oligo could be associated with GC rich oligo or a T → A or T → C replacement, while decreased hybridization of reference sample to consensus oligo could be caused by self-annealing of GC rich sequences. These, fluctuations in strength of hybridization had, however, little impact on the analysis, since differential hybridization could still be easily detected when samples from different genotypes were tested (clusterogram in Figure 4d). For instance, reciprocal labeling in the context of b,b homozygosity or b,c hetero-zygosity demonstrated perfect symmetry in hybridization to variant and consensus oligos.
Data could be ordered sequentially into genotypic profiles according to sequence position. The a,a homozygosity phenotype was characterized by LogRatios with minimal deviation from 0 (Figure 5a,5F). Conversely, b,b homozy-gosity yielded extremely high LogRatios in variant oligos and strongly depressed LogRatio in the corresponding
con-sensus oligos (Figure 5b). Noteworthy is the pattern of proportional hybridization to the variant oligo p (p = oligo 13-SP-A-02 at position 248–265) that encompasses a double nucleotide variant from CA → GG in position 256–257. The oligo containing this double mismatch fur-ther reduced the hybridization affinity to the reference sample, proportionally enhancing the affinity of the test sample leading to higher LogRatio for oligo p in Figure 5b.
The "unknown" SNP (from position 250 to 310) was revealed by absence of variant-specific hybridization but highly depressed LogRatios of the corresponding consen-sus region oligos (orange asterisks and dashed line in Fig-ure 5b). This phenomenon may exemplify the ability of this method to detect allelic variants in the absence of var-iant-specific oligos. Even in conditions of a,b heterozygos-ity (Figure 5c), "unknown" SNP could be suspected due to the relatively reduced LogRatios (0.5 ~1) in variant oligos and more characteristically less depressed LogRatios in cor-responding consensus oligos compared with b,b homozy-gosity (Figure 5b). Noteworthy is the exceptional behavior of the variant oligo p that contains a double nucleotide variant (p in Figure 5c) which leads to higher
LogRatios even in the context of a,b heterozygosity.
How-ever, the corresponding consensus oligos are not affected
by the double nucleotide variant and, therefore, display a typical a,b heterozygosity pattern distinguishable from b,b homozygosity since one allele in the test sample is identical to the reference.
Heterozygosity with both alleles different from the con-sensus (b,c) represents the most complex situation (Figure 5d). In this case, heterozygous samples such as A*0201, 2901, LogRatios behave as in b,b homozygosity at this spe-cific region since both alleles hybridize to the same variant oligo and neither to the correspondent consensus oligos. The discriminatory power of this phenomenon can be better illustrated by comparing the hybridization pattern of the same oligo in conditions of b,b homozygosity (HLA-A*2901 homozygous) and a,b heterozygosity (HLA-A*0101,2901 heterozygous) (x in Figure 6). In this case, differential hybridization pattern is marked by dou-bling and halving of LogRatios in variant and consensus oligos respectively (see also Table in Figure 6). Thus, vari-able types of heterozygosity in the test sample may affect differently the proportional hybridization to the corre-spondent consensus oligos. An extreme example occurs when one allele of the test sample hybridizes to the vari-ant oligo (14-SP-A*29; position 263–280) while an unknown SNP is present in the other allele within the same region (HLA-A*0201, y in Figure 5d). This exempli-fies a case of b,c heterozygosity in which one SNP is unknown as theorized in row V, Figure 3. In this case, a reduced LogRatio in the variant oligo associated with extremely depressed LogRatios in the corresponding con-sensus oligo are observed because both test alleles are dif-ferent from the consensus. The power of discrimination
a,b and b,c heterozygosity in regions with "unknown " SNP is underlined by the dashed line in Figure 5d. The blue line highlights polymorphisms occurring in both alleles (A*0201,2901). Thus, the corresponding consen-sus oligos display strongly depressed LogRatios compara-ble to b,b type homozygosity. In the following region, the dashed orange line indicates polymorphisms occurring only in one allele (A*0201 and not 2901) resulting in less depressed LogRatios in the corresponding consensus oligos as in the case of a/b heterozygosity.
Occurrence of more than one SNP within an oligo could complicate the data analysis. For instance, in the case described in Figure 5d, two regions with a double mis-match are observed which are characterized by LogRatios
the case of polymorphism q representing A*2901 variant, the same A*0201 region is identical to the consensus and, therefore, a,b heterozygosity pattern is observed.
An unexplainable finding was observed where specific hybridization to a variant oligo is not associated with depressed LogRatios of the correspondent consensus oligo
(z in Figure 5d). A purposeful mismatch, a C → A switch, may have less repercussions on the hybridization pattern of this oligo. Indeed, even in homozygous conditions (z
in Figure 6) the LogRatios are only minimally depressed in this case. In these relatively rare occurrences (only case in our study) an "unknown" polymorphism would not be detected.
Profiling by proportional hybridization of HLA-A exon 2 Figure 5
Profiling by proportional hybridization of HLA-A exon 2. Four patterns are described: a,a homozygosity (A); b,b homozygosity (B); a,b heterozygosity (C) and b,c heterozygosity (D). Each bar represents the LogRatio for individual oligos sequentially posi-tioned in 3' to 5' direction. Variant oligos are nested between homologous consensus oligos and appear as bright (LogRatio >1) or light red (LogRatio > 0.5 and ≤ 1). LogRatio for any oligo between ≤ 0.5 or ≥ -0.5 are shown in yellow. Consensus oligos in various conditions of mismatch with test DNA are shown as light (LogRatio < -0.5 and ≤ -1) or dark (LogRatio < -1) green. The orange lines delimit LogRatio between 1 and -1. The letter p points to a variant oligo with a double nucleotide variant (CA → GG at 256–257). Another double mismatch-containing oligo is pointed out by q (CA → AC at 99–100). The letter x points to a variant oligo (9-SP-A-02) spanning a region of b,c type heterozygosity (HLA-A*0201 and A*2901 differ A → G from the con-sensus). The letter y points to a situation where a variant oligo (14-SP-A-03, A29 at 263–280) encompasses also a "unknown" SNP present in the other allele (HLA-A*0201). z shows a variant oligo (10-SP-A-29 at 211–229) whose increased LogRatio is not associated with decreased LogRatio in the homologous consensus oligo. The orange asterisks and the dashed lines show a genomic region in which "unknown" A*0201 polymorphisms are associated (blue) or not associated (orange) with HLA-A*2901 polymorphic sites.
Log
Cy
5
/Cy3 rat
io
A*0101,0201/A*0101 a,b heterozygosity
-4 -3 -2 -1 0 1 2 3 4
**** ***
p
A
-4 -3 -2 -1 0 1 2 3 4
A*0101/A*0101 a,ahomozygosity
D
-4 -3 -2 -1 0 1 2 3 4
1
**** *** q
A*0201,2901/A*0101 b,cheterozygosity
p
x
y
z
C C
B A*0201/A*0101
b,b homozygosity
-4 -3 -2 -1 0 1 2 3 4
**** ***
p
To statistically assessed the ability of this method to dis-criminate differences between a,a homozygosity from other combinations in conditions of unknown SNP, we analyzed the behavior of consensus oligos only in various experimental conditions. For each 18-mer probe, starting from 3rd base and ending at 16th base, if the test target
contained at least one single nucleotide different for the consensus sequence HLA-A*0101, we considered this spe-cific region SNP(+); otherwise it was SNP(-). Various com-binations were tested as shown in Figure 7. In all permutations tested (given appropriate sample size) the set of 4-nucleotide tiling consensus oligo alone demon-strated a high SNP discriminatory power. In particular,
even the theoretically most problematic combination (a,b
vs a,a), least divergent from the consensus, could be easily significantly discriminated in all permutations tested.
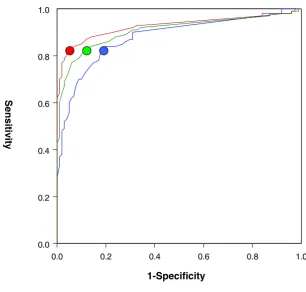
We then tested the sensitivity and specificity of this strat-egy by examining the relationship between LogRatio and the actual SNP condition via ROC (Relative Operating Characteristics) analysis [21]. The ROC curves in Fig. 5 were composed of 3 different groupings. As it could be expected, optimal threshold for detection of polymor-phism related sensitivity and specificity varied according to the allelic combination. When the test sample is most different from the consensus reference as for b,b an b,c
[image:9.612.68.485.121.440.2]Genomic "fingerprinting" using proportional hybridization Figure 6
Genomic "fingerprinting" using proportional hybridization. Description of individual genotype combinations. Four allelic combi-nations are described here using graphics similar to the ones described in Figure 5. The data for each allelic combination repre-sent the average LogRatio ± SDev of three separate tests. In the accompanying Table, the LogRatio in variant oligos and corresponding homologous consensus oligo are shown for b,b homozygosity (HLA-A*2901 vs reference HLA-A*0101) and a,b
higher accuracy with sensitivity 82% and specificity 96% is observed (red line). The worst accuracy was noted when test and reference samples were closest as in the case of a,b
heterozygosity (sensitivity 82% and specificity of 82%) (blue line). The most informative analysis was, however, provided using data from all the possible combinations (green line in Figure 8) since in most common experimen-tal condition the relationship between test and consensus sample is not known and, therefore, all possible allelic combinations should be expected. In that case an optimal threshold of LogRatio ≤ -0.62 yielded sensitivity at 82% and specificity at 89%. Thus, this strategy may identify 4 out of 5 SNP with 90% accuracy with the highest chance of discriminating false positive result when an a,b hetero-zygous sample is tested.
Discussion
[image:10.612.79.520.160.410.2]In this study, we describe a simplified strategy for the detection of known and unknown SNP that, because of the decreased cost, could be applied to large clinical studies. A flow chart describing the algorithm for the iden-tification of SNP using this method is shown in Figure 9. Although this strategy was conceived to identify SNP in genes for which little is known about their polymor-phism(s), it could also be used for routine typing of known alleles. This could be achieved by preparing allele-specific profiles and matching test results with known per-mutations collected in databases compiling repeated hybridization profiles as template to eliminate possible false interpretations. Annotation of the test sample geno-type will be reported after comparison with established templates. The HLA alleles and corresponding oligos used Degree of discrimination among different HLA alleles using proportional hybridization to oligonucleotide arrays
Figure 7
Degree of discrimination among different HLA alleles using proportional hybridization to oligonucleotide arrays. Two sample t -tests were used to differences between two means. P-values were calculated for each (a,b) vs.(a,a); (a,b) vs. (b,b); and (b,b) vs. (a,a)
t-test comparison of Log2Ratio differences among various allele combinations
Allelic Combination #samples Allelic
Combination
#samples df p-value
(b,b) (a,a)
A0201 2 A0101, A0101 4 4 0.00001
A0301 1 A0101, A0101 4 3 0.0008
A2301 1 A0101, A0101 4 3 0.0002
A2901 8 A0101, A0101 4 10 0.0003
(a,b) (a,a)
A0101,0201 1 A0101,A0101 4 3 0.0015
A0101,0301 1 A0101,A0101 4 3 0.0025
A0101,2301 2 A0101,A0101 4 4 0.0015
A0101,2901 5 A0101,A0101 4 7 0.0008
(b,b) (a,b)
A0201 2 A0101,0201 1 1 0.0819
A2301 1 A0101,2301 2 1 0.0554
here were selected to exemplify various combinations. Various permutations of homozygosity and heterozygos-ity can be observed that produce complex hybridization patterns highly specific for a particular phenotype. In these highly polymorphic conditions, each haplotype combination maintains a highly reproducible profile characterized by minimal variance. This allows the
crea-tion of "genotypic masks" within narrow ranges of varia-tion to "fingerprint" known haplotype permutavaria-tions for high-throughput typing of highly polymorphic genes.
[image:11.612.135.441.133.425.2]We, therefore, describe a potentially powerful and effi-cient strategy for high-throughput screening of genes for which little is known about their polymorphism. This Sensitivity and specificity analysis of the strategy
Figure 8
Sensitivity and specificity analysis of the strategy. 18-mer probes were assigned to SNP (+) if the sequence of the test channel probe of a specific spot contained at least one single nucleotide different from the sequence A*0101. The other probes were considered SNP(-). ROC (Relative Operating Characteristic) analysis [21] of curves for 3 different allelic combinations. The red line represents a ROC curve generated from 448 spots in 7 b,b homozygosity and b,c heterozygosity experiments with 269 SNP(-) and 179 SNP(+) spots. The blue line represents ROC curves generated from 265 spots in a,b heterozygosity experi-ments with 169 SNP(-) and 87 SNP(+) spots. The green line represents a ROC curve from 704 spots in all experiexperi-ments with a total of 438 SNP (-) and 266 SNP (+) spots. The dots on the curves stand for optimal threshold in each group. Threshold for
LogRatio were based on ROC analysis to balance sensitivity and specificity. For the group with b,b and b,c heterozygosity (red line) experiments the optimal threshold was a LogRatio ≤ -0.91. The sensitivity using this threshold was 82% and specificity 96%. The optimal threshold for the a,b heterozygosity (blue line) was LogRatio ≤ -0.43 with a sensitivity of 82% but a specificity drop to 82%. For the analysis combined all the data (green line) the optimal threshold was LogRatio ≤ -0.62 with a sensitivity at 82% and specificity at 89%. This last ROC exemplifies the most common experimental condition where the relationship between test and reference sample is not known and, therefore, all possible allelic combinations should be expected.
0.0 0.2 0.4 0.6 0.8 1.0
0.0 0.2 0.4 0.6 0.8 1.0
1-Specificity
Sensitiv
strategy could also be used to identify mutations in dis-ease processes or for typing known allelic variants of well-characterized genes such as HLA. This, however, would require specialized design of numerous oligos encom-passing known variants and supportive software for effi-cient data interpretation. Various scenarios are best exemplified by using as a model a highly polymorphic region of the human genome such as exon 2 of the HLA-A locus. The simplest case would be the investigation of a gene characterized by minimal or no polymorphism. In this case, screening of samples from different ethnic groups would yield a pattern described as a,a type homozygosity, similar to the one shown in Figure 8a. Another possibility would be the investigation of a gene with few but relatively common polymorphism(s). In this case the occurrence of b,b type homozygosity would be common as depicted in Figure 8b. In the same situation,
a,b type heterozygosity would also frequently occur as shown in Figure 8c. Finally, a most complex scenario, likely to occur only for genes characterized by high poly-morphic prevalence is portrayed in Figure 8d. In this case,
b,c type heterozygosity should occur frequently as it might be expected for the HLA loci. However, SNP occur in the human genome on average every 600 – 2,000 bases [1,2]. Therefore, most genes are characterized by a relatively narrow range of polymorphism that would allow a rela-tively simple design of oligo-array chips and interpreta-tion of results. Independently of the genomic region investigated, this strategy can identify unknown variants through observation of disproportionably depressed
LogRatios in consensus oligos.
Flow chart summarizing the proposed algorithm to screen for known or novel SNP using proportional hybridization to oligo-nucleotide arrays
Figure 9
Flow chart summarizing the proposed algorithm to screen for known or novel SNP using proportional hybridization to oligo-nucleotide arrays.
Test DNA Reference DNA*
Hybridization to consensus oligos
Balanced Unbalanced
No SNP Hybridization to known SNP oligos
Positive
Known SNP
Negative
New SNP
Identification by sequencing of polymorphic region
Conclusions
The SNP detection system described her may provide a great improvement in the ability to screen different genes for the frequency and location of polymorphic sites, which ca be confirmed by site directed sequencing limited to the region of interest. Thus, the best application of this strategy stems from the clinical need to rapidly segregate genes characterized by presence or lack of polymorphisms in their coding or regulatory regions that may affect clini-cal behaviors. A good example of such application is the screening of cytokines, chemokines and their receptors whose polymorphism(s) have been associated to individ-ual predisposition to immune pathology, survival of transplanted organs and predisposition to cancer [16,22– 25].
Material and methods
Oligo nucleotide probe designThe HLA-A locus exon 2 region from position 73–346, allele A*01011, was used for the design of consensus oligos (Figure 1). Allele-specific (variant) oligos were designed based on single or double nucleotide variants according to alignment to the arbitrarily selected consen-sus sequence (HLA-A*0201). Variant and consenconsen-sus oligos consisted of 18-mers with a 5' amino-modifier hav-ing a six-carbon spacer for immobilization (Operon Tech-nologies, Inc, Alameda, CA). The polymorphic site in the variant oligos was designed in the centermost position. Melting temperatures of oligo probes were maintained as close as possible to a range of 56–60°C. 350–400 pmol/µ l oligo probes synthesized in 96-well format were dried and re-suspended in 3 × SSC for printing.
Oligonucleotide array printing and post process of slides Probes were spotted onto a 3D-link activated slide for cov-alent immobilization (Motor roller) using OmniGrid robotic printer (Genemachine) with four printing pins picking up 0.25 µl of probe solution and depositing 0.6 nl per spot (TeleChem International, Inc.). Each spot was quadruplicated to minimize printing bias and test repro-ducibility. Spot diameter was 90–100 µm, spaced at 250 µm to prepare 4 × 16 × 6 spot/arrays. After printing, slides were kept in a sealed humidifier chamber at room temper-ature overnight and blocked with 50 mM ethanolamine, 0.1 M Tris, pH9 and 0.1% SDS at 50°C for 15 minutes fol-lowed with rinsing in water twice, washing with 4 × SSC/ 0.1% SDS 50°C for 45 minutes, rinsing with water briefly and centrifuging at 800 rpm for 3 minutes with micro-plate carriers. Arrays were then stored in a desiccator until use.
Test and consensus reference samples
Genomic DNA was isolated from EBV transformed B cell line. 12 heterozygous or homozygous samples were tested for oligo nucleotide array hybridization and confirmed by
sequence-based typing using the ABI Prism 3700-96 Analyzer.
Preparation of target nucleic acids
In order to generate single strand DNA, PCR products from Exon 1 to Exon 5 of the HLA-A locus were amplified with an attachment of T7 promoter to the 5' end using 5' T7-EX1A-6 primer 5'AAACGACGGCCAGTGAATACGACTCACTATAGGCGC CAGACGCCGAGGATGGCC3') and three 3' primers (3' EX 5-A 993-1 CAT TGC TGG CCT GGT TCT CC; 3' EX 5-A 993-2 CAT TGC TGG CCT GGT TCT CTT; 3' EX 5-A 993-3 CAT TGC TGG CCT AGT TCT CTT). PCR reaction was mixed with 25 µl of HotStart PCR reagents (Qiagen, CA), 5 ng-0.5 µg of genomic DNA, 5 µl of 15 µM 5'primer, 5 µl of 15 µM 3'primer mix and H2O to a 50 µl final volume. The reaction was cycled at 95°C for 10 minutes, 96°C for 35 seconds, 65°C for 45 seconds, 72°C for 3 minutes, 4 cycle; 96°C for 30 seconds, 60°C for 40 seconds, 72°C for 3 minutes, 19 cycles and 96°C for 30 seconds, 55°C for 40 seconds, 72°C for 2 minutes, 9 cycles. One µl of PCR product from each sample was analyzed using a Bioana-lyzer on DNA7500 chip (Agilent Biotechnology). Approximately 2,000 bp amplicons from each sample were amplified. The PCR products were then precipitated with EtOH at room temperature and re-suspended in DEPC-treated H2O at 0.1 µg/µl concentration. In vitro
transcription (IVT) was performed using an Ambion T7 Megascript Kit (Cat. #1334). For each sample, the follow-ing reaction mixture was made: 4 µl of each 75 mM NTP (A, G, C and UTP), 4 µl reaction buffer, 4 µl enzyme mix (RNase inhibitor and T7 phage polymerase) and 1 µg purified PCR product in 16 µl DEPC-treated H2O. The reactions were then incubated at 37°C for six hours to per-mit transcription. Amplified RNA was then purified using TRIzol reagent according to manufacture instruction (Gib-coBRL) and re-suspended in 40 µl of DEPC water. RNA concentrations were estimated by using a Bioanalyzer on RNA 6000 chip (Agilent Biotechnology).
Target labeling and hybridization
Publish with BioMed Central and every scientist can read your work free of charge "BioMed Central will be the most significant development for disseminating the results of biomedical researc h in our lifetime."
Sir Paul Nurse, Cancer Research UK
Your research papers will be:
available free of charge to the entire biomedical community peer reviewed and published immediately upon acceptance cited in PubMed and archived on PubMed Central yours — you keep the copyright
Submit your manuscript here:
http://www.biomedcentral.com/info/publishing_adv.asp
BioMedcentral was then applied to Bio-6 column according to the
man-ufacturer's instructions. The flow through mixed with 200 µl 1 × TE was concentrated to 20–40 µl using Microcon YM-30 column (Millipore) and further concentrated to 8 ul using speed-vacuum.
Cy3- and Cy5-labeled probes were combined (1:1 ratio) and 5 µl 20 × SSC, 0.5 µl 10% SDS and 0.5 µl of 4 mg / ml salmon sperm DNA were added to the probe for hybridization. The samples were then heated for two min-utes at 99°C. Prepared probe mixture was applied to an array slide with cover slid and hybridized at 47°C for dif-ferent amounts of time as described in the text. Slides were washed with 4 × SSC, 2 × SSC with 0.1 % SDS, 1 × SSC, 0.2 × SSC and 0.05 × SSC sequentially for one minute each step and dried by centrifugation at 800 rpm for 3 minutes. The slides were then scanned for fluorescent signal using a GenePix 4000B scanner and the results analyzed using GenePix Pro3 software (Axon Instruments, Inc.).
References
1. Wang DG, Fan J-B, Siao C-J, Berno A, Young P and Sapolsky R et al.: Large-scale identification, mapping and genotyping of single-nucleotide polymorphisms in the human genome. Science
1998, 280:1077-1082.
2. The International SNP Map Working Group: A map of human genome sequence variation containing 1.42 million single nucleotide polymorphisms.Nature 2001, 409:928-933. 3. Cooper DN, Ball EV and Krawczak M: The human gene mutation
database.Nucleic Acids Res 1998, 26:285-287.
4. Ng PC and Henikoff S: Accounting for human polymorphisms predicted to affect protein function. Genome Res 2002, 12:436-446.
5. Collins FS, Brooks LD and Chakravarti A: A DNA polymorphism discovery resource for research on human genetic variation.
Genome Res 1998, 8:1229-1231.
6. Schafer AL and Hawkins JR: DNA variation and the future of human genetics.Nature Biotech 1998, 16:33-39.
7. Patil N, Berno AJ, Hinds DA, Barrett WA, Doshi JM and Hacker CR
et al.: Blocks of limited haplotype diversity revealed by high-resolution scanning of human chromosome 21.Science 2001, 294:1719-1723.
8. Kwok PY: Genetic association by whole-genome analysis. Sci-ence 2001, 294:2669-1670.
9. Chee M, Yang R, Hubbell E, Berno A, Xiaohua C and Stern D et al.: Accessing genetic information with high-density DNA arrays.Science 1996, 274:610-614.
10. Hacia JG, Brody LC, Chee MS, Fodor SP and Collins FS: Detection of heterozygous mutations in BRCA1 using high density oli-gonucleotide arrays and two-colour fluorescence analysis [see comments].Nat Genet 1996, 14:441-447.
11. Saiki RK, Walsh PS, Levenson CH and Erlich HA: Genetic analysis of amplified DNA with immobilized sequence-specific oligo-nucleotide probes.Proc Natl Acad Sci U S A 1989, 86:6230-6234. 12. Lockhart DJ, Dong H, Byrne MC, Folliette MT, Gallo MV and Chee
MS et al.: Expression monitoring of hybridization to high-den-sity oligonucleotide arrays.Nature Biotechnol 1996, 14:1675-1680. 13. Chen J, Iannone MA, Li M-S, Taylor JD, Rivers P and Nelsen AJ et al.: A microsphere-based assay for multiplex single nucleotide polymorphism analysis using single base chain extension.
Genome Res 2000, 10:549-557.
14. Tong AK and Ju J: Single nucleotide polymorphism detection by combinatorial fluorescence energy transfer tags and biotinylated dideoxynucleotides.Nucleic Acids Res 2002, 30:e19.
cytokine and receptor genes using SNaPshot.Hum Immunol
2002, 63:508-513.
17. Guo Z, Gatterman MS, Hood L, Hansen JA and Petersdorf EW: Oli-gonucleotide arrays for high-throughput SNPs detection in the MHC class I genes: HLA-B as a model system.Genome Res
2002, 12:447-457.
18. Hacia JG: Resequencing and mutational analysis using oligonu-cleotide microarrays.Nature Genetics 1999, 21:42-47.
19. Hacia JG, Sun B, Hunt N, Edgemon K, Mosbrook D and Robbins C et al.: Strategies for mutational analysis of the large multiexon ATM gene using high-density oligonucleotide arrays.Genome Res 1998, 8:1245-1258.
20. Adams SD, Barracchini KC, Simonis TB, Stroncek D and Marincola FM: High throughput HLA sequence-based typing utilizing the ABI prism 3700 analyzer.Tumori 2001, 87:s41-s44. 21. Swets JA: Measuring the accuracy of diagnostic systems.
Sci-ence 1988, 240:1285-1293.
22. Keen LJ: The extent and analysis of cytokine and cytokine receptor gene polymorphism.Transpl Immunol 2002, 10:143-146. 23. McCarron SL, Edwards S, Evans PR, Gibbs R, Dearnaley DP and Dowe A et al.: Influence of cytokine gene polymorphism on the development of prostate cancer. Cancer Res 2002, 62:3369-3372.
24. Howell WM, Turner SJ, Bateman AC and Theaker JM: IL-10 pro-moter polymorphisms influence tumour development in cutaneous malignant melanoma.Genes Immun 2001, 2:25-31. 25. Howell WM, Bateman AC, Turner SJ, Collins A and Theaker JM: