This is a repository copy of
Controlled Structure Evolution of Graphene Networks in
Polymer Composites
.
White Rose Research Online URL for this paper:
http://eprints.whiterose.ac.uk/128906/
Version: Published Version
Article:
Boothroyd, S.C., Johnson, D.W., Weir, M.P. orcid.org/0000-0001-8283-1040 et al. (6 more
authors) (2018) Controlled Structure Evolution of Graphene Networks in Polymer
Composites. Chemistry of Materials, 30 (5). pp. 1524-1531. ISSN 0897-4756
https://doi.org/10.1021/acs.chemmater.7b04343
[email protected] https://eprints.whiterose.ac.uk/
Reuse
This article is distributed under the terms of the Creative Commons Attribution (CC BY) licence. This licence allows you to distribute, remix, tweak, and build upon the work, even commercially, as long as you credit the authors for the original work. More information and the full terms of the licence here:
https://creativecommons.org/licenses/
Takedown
If you consider content in White Rose Research Online to be in breach of UK law, please notify us by
Controlled Structure Evolution of Graphene Networks in Polymer
Composites
Stephen C. Boothroyd,
†,#David W. Johnson,
†,#Michael P. Weir,
‡Carl D. Reynolds,
†James M. Hart,
†Andrew J. Smith,
§Nigel Clarke,
‡Richard L. Thompson,
†and Karl S. Coleman
*
,††
Department of Chemistry, University of Durham, Durham DH1 3LE, United Kingdom
‡
Department of Physics and Astronomy, The University of Sheffield, Hicks Building, Hounsfield Road, Sheffield S3 7RH, United
Kingdom
§
Diamond Light Source Ltd., Harwell Science and Innovation Campus, Diamond House, Didcot OX11 0DE, U.K.
*
S Supporting InformationABSTRACT: Exploiting graphene’s exceptional physical properties in polymer composites is a significant challenge because of the
difficulty in controlling the graphene conformation and dispersion.
Reliable processing of graphene polymer composites with uniform and consistent properties can therefore be difficult to achieve. We
demonstrate distinctive regimes in morphology and nanocomposite properties, achievable through systematic control of shear rate and shear history. Remarkable changes in electrical impedance unique to composites of graphene nanoplatelets (GNPs) are observed. Low shear rates≤0.1 s−1break up the typical GNP agglomerates found in
graphene composites, partially exfoliate the GNPs to few-layer graphene, and reduce orientation, enhancing electrical conductivity
in the composite materials, whereas at higher shear rates GNP orientation increases and the conductivity reduces by four orders of magnitude, as the graphenefiller network is broken down. The structure of the composite continues to evolve, reflected in
further changes in conductivity, after the shear force has been removed and the process temperature maintained. This work provides critical insights for understanding and controlling GNP orientation and dispersion within composites and will have important consequences in the industrial processing of graphene polymer composites via the informed design and choice of processing conditions.
■
INTRODUCTIONPolymer compositesfilled with graphene have received a great
deal of attention due to the extraordinary physical properties of graphene, such as electrical and thermal conductivity, mechanical strength, and barrier properties, which are hoped to be transferred to the composite material. Unlocking these enhancements, while retaining the ease of processing of the host polymer matrix, remains a significant challenge within the
polymer environment. A loss of interface due to aggregation,1 poor dispersion of the graphene within the composite, graphene orientation, and poor interaction between the polymer and the filler particle can all have a negative impact
on the composite performance. Therefore, key to achieving the desired material properties is an understanding of how various processing techniques affect the end product. For example,
aligning graphene platelets within a composite can almost
double the Young’s modulus when compared to a randomly
oriented sample.2 Composites with highly aligned graphene platelets have shown potential as electromagnetic interference shielding materials3and in gas/liquid barrier applications.4,5In contrast, for electrical conductivity to be established throughout the composite after processing induced alignment, annealing to
restore a random orientation and percolated network is important.6
The effect of processing on the conductivity of polymers filled with carbon nanotubes (CNTs)7−12 and carbon black
(CB)13 has shown that shear can break down a conducting
network within the polymer composite, followed by a subsequent recovery process upon cessation of the shearing. Similarly, graphite in polycarbonate composites has been seen to align following injection molding, followed by gradual disorientation of the graphite improving conductivity.6For 2D layered materials, processing effects on the network structure
can be even more complex,14−21 though few studies have
reported these effects in graphene based composites.
The direct monitoring of flow effects on the electrical
properties of graphene composites is highly valuable for understanding how the graphene structure and composite properties change under deformation. Despite this, very little work has been done on this so far. Our work focuses on the
Received: October 16, 2017
Revised: February 14, 2018
Published: February 14, 2018
Article
pubs.acs.org/cm
Cite This:Chem. Mater.2018, 30, 1524−1531
steady-shear processing of composites of polystyrene (PS) and graphene nanoplatelets (GNPs). We study the impedance of our composite across a range of shear rates and, with it,find a
number of different processes occurring during the shear and
subsequent relaxation stages. We relate the change in impedance of the composite to changes in the GNP structure, orientation, and dispersion and show how processing can be used to control this. We support our conclusions with in situ small-angle X-ray scattering measurements. Our results present a significant step forward in understanding and designing
appropriate processing conditions in order to achieve the desired enhancements in the properties of polymer−graphene
composites.
■
MATERIALS AND METHODSPolystyrene was supplied from Sigma-Aldrich (SKU 441147, measured
Mw = 273,000 g mol −1, M
n = 113,000 g mol
−1, see Supporting
Information). GNPs were supplied by XG Sciences (xGNP Graphene nanoplatelets grade M, 5μm particle diameter, 5 nm thick). Carbon black was supplied by Sigma-Aldrich (SKU 699624), graphitized with a particle size < 500 nm.N-Methyl-2-Pyrrolidone (NMP) was supplied by Fisher Scientific (127630025 Acros Organics 99% extra pure). All
materials were used as supplied.
Composite Preparation.Nanocomposite samples were prepared by solvent processing in NMP. Polystyrene was dissolved in NMP to a
final concentration of 10 wt % polymer. The appropriate amount of
GNPs or carbon black was added to the polymer solution to produce a
final composite concentration of 5 vol %filler to polystyrene, and the
sample transferred to a roller for 18 h. The sample was then sonicated with a solid probe sonicator (300 W, 20 min, 5 s pulses, Cole Parmer 750) to disperse thefiller in the polymer solution. Sonication was done
on no more than 50 mL of the dispersion at a time. The composite solution was then immediately precipitated dropwise into methanol (10 volume excess to NMP). The resulting precipitate was stirred in methanol for 30 min then isolated byfiltration. This was then stirred
again in fresh methanol (18 h) before being isolated byfiltration again.
The resulting powder was then dried in vacuo (50°C, 10-2mbar, 18
h).
To prepare samples for testing in the rheometer with in situ impedance or small-angle X-ray scattering measurements, the composites were heat pressed at a temperature of 160 °C with a load of 6 T for 30 min into 25 mm diameter discs of thickness approximately 0.5 mm.
Combined Rheometry and Impedance Spectroscopy. The pressed discs were tested in a TA Instruments AR 2000 rheometer at 200°C using the environmental test chamber (ETC) with a nitrogen atmosphere. The bottom geometry comprised a ring electrode of outer diameter 25 mm and inner diameter 19 mm so as to have a better defined shear rate for the impedance measurements. The top plate
acted as the sense electrode.
The impedance of the samples was recorded as a function of time using a Zurich Instruments HF2IS impedance spectrometer with an HF2TA transimpedance amplifier in the four wire mode. A voltage of
0.1 V was oscillated at a frequency of 10 Hz, and the gain of the amplifier matched to the requirements of the sample being measured.
All samples were subject to an initial preshear for 5 min at a rate of 0.01 s−1, and then annealed for 30 min to standardize their structure
following pressing and loading in the rheometer. The samples were then sheared for 5 min before the relaxation of the stress was measured by the rheometer upon cessation of the shear, and the impedance measured by the HF2IS as a function of time over the course of the shear and relaxation steps. A median filter was applied to the GNP
composite impedance data using Origin 8.6. Fits to the stress relaxation data were also performed using Origin 8.6 (seeSupporting Information).
Small-Angle X-ray Scattering. SAXS experiments were con-ducted on beamline I22 at Diamond Light Source. The TA Instruments AR 2000 rheometer was aligned within the beamline
and equipped with an electrically heated plate (EHP) in the parallel plate set up with a diameter of 25 mm. The X-ray beam was aligned 1 mm from the edge of the sample to ensure the beam was fully located within the sample while minimizing the path length. The high electron density of the GNPs gives good contrast for X-ray scattering in the polymer matrix. Experiments were conducted using a q range of 0.0018−0.128 Å−1 with a beam energy of 12.4 keV and a sample
detector distance of 7.629 m, and the data acquired for 0.1 s. The detector image was radially integrated into 45 bins using the Data Analysis WorkbeNch22 (DAWN) and the orientation determined
using this software from the Cinader and Burghardt equation, where the orientation factor is given by the weighted average of the second moment tensor of u:23
β β β β β β
⟨ ⟩ = ⟨ ⟩ ⟨ ⟩ ⟨ ⟩ ⟨ ⟩ ⎡ ⎣ ⎢ ⎢ ⎤ ⎦ ⎥ ⎥
uu cos sin cos
sin cos sin
2 2 (1) where ∫ ∫ β β β β β ⟨ ⟩ = π π I
I( )d( )
( )d( ) 0
2
0 2
(2)
anduis a unit vector representing a point on the azimuthal scan,βis the azimuthal angle, andI(β) is the azimuthal intensity distribution.
Samples were subjected to the same shear procedure as for the impedance measurements.
■
RESULTS AND DISCUSSIONThrough the use of shear and relaxation processing, it is possible to control the structure of GNPs within the polymer composite. Such control is extremely important for achieving the best possible properties, and the complex nature of polymer−graphene interactions means that there may be little
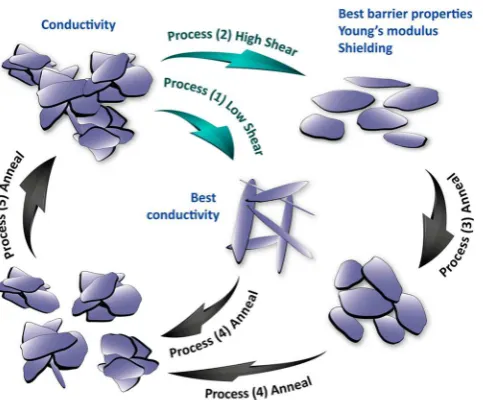
or no enhancement in the properties of the composite if the processing is inappropriate. We have developed a model describing the processes that occur within the composite during processing, as shown inFigure 1.
Our interpretation was developed following the combination of impedance spectroscopy with rheometry, enabling us to monitor changes in the composite electrical properties as a function of shear and subsequent annealing. In addition, we used in situ small-angle X-ray scattering (SAXS) under these conditions to support the model. Initially (top left), the composite starts as an agglomerated structure with a poor GNP dispersion. This secondary agglomeration of the GNPs forms an interconnected network, which provides a conducting path through the composite. At low shear rates (1) of≤0.1 s−1, GNP
particles are released from the agglomerates, dispersing more GNPs through the composite, while graphene is also exfoliated from the GNPs. This increases the interfacial area of the GNPs within the composite, and their alignment is also reduced. This
establishes a more effective GNP network, increasing the
conductivity of the composite to its highest level. Following this shear, the GNP network will reagglomerate under annealing, with the conductivity reducing to levels seen prior to the shearing process. Above a critical shear rate (≥0.3 s−1) the
response to the shear changes (2). Instead of enhancing the network structure of the GNPs within the composite and increasing the conductivity, the conductivity decreases. This is a consequence of alignment of the GNPs. While the agglomer-ates themselves may be broken up and better dispersed within the composite at the higher shear rates, when aligned with the shearflow a conducting path is lost. Increasing shear rate leads
to greater losses in the conductivity. Such aligned structures are,
Chemistry of Materials Article
DOI:10.1021/acs.chemmater.7b04343
however, preferable for enhancing the Young’s modulus of the composite,2,24improving barrier properties,4,5and for electro-magnetic radiation shielding.3Upon cessation of the shear, an initial rapid reduction in the impedance is observed upon relaxation of the polymer stress. This is ascribed to a rapid reorientation of the GNP particles (3), facilitated by the polymer stress relaxation.25,26This effect peaks after 10−20 s of
annealing at 200 °C. The impedance of the composite then increases again, a consequence of further agglomeration of the GNPs within the composite into isolated agglomerates (4). This leads to a minimum in the composite conductivity, but with further annealing the conductivity begins to increase again (5). This shows a re-establishment of a network structure. This is driven by the formation of secondary agglomerates, giving interconnected domains. The process is cyclic, and further generation of the network under repeated shear is possible. This ability to vary the composite processing in order to control the structure of the GNPs is extremely important for achieving the best possible improvements in the desired property of the composite.
A schematic of the rheometer geometry developed to incorporate simultaneous measurements of impedance
spec-troscopy is shown in Figure 2. The bottom plate of the
geometry acts as the source electrode, and the impedance is measured through the sample to the top plate, which acts as the sense electrode. A sliding contact was used on the top plate so that continuous shear could be applied. A ring electrode was
used on the bottom plate11 so that the impedance was
measured at a well-defined shear rate near the edge of the
sample (Figure 2a). This set up allows evaluation of how the electrical properties of the composite changes as a function of shear conditions and history, with different structures giving
different responses. For example, a well-developed network of
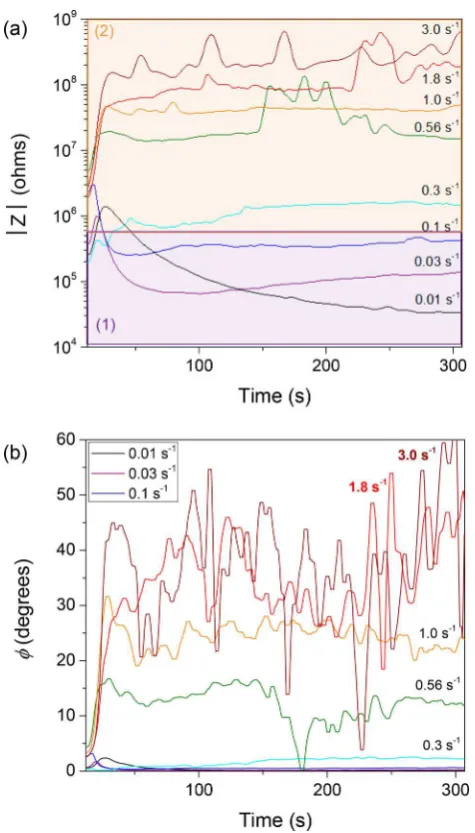
the GNPs would have low impedance and high conductivity (Figure 2b). GNP particles aligned in the shear direction would have high impedance when the conducting path through the composite is broken (Figure 2c). The samples were sheared for 5 min at a constant shear rate. Upon cessation of the shear, the change in impedance continued to be monitored while annealed in the rheometer. The change in the impedance of the GNP composites during shear is shown in Figure 3a. A complex range of behaviors is observed, with a distinct shift between shear rates. For PS + 5 vol % GNPs, at shear rates
≤0.1 s−1 the impedance of the composite is reduced during
shear, enhancing the conductivity. This is consistent with the effects observed by Beckert et al. when shearing composites of
PS/PS-grafted-functionalized graphite oxide with a small oscillation.27 At rates ≥0.3 s−1 the impedance is increased
and the conductivity is reduced. These states are highlighted by zones (1) and (2) inFigure 3a and correspond with processing steps (1) and (2) inFigure 1.
The increase in conductivity at the low shear rates is likely to be driven by both the breakup of GNP agglomerates and a partial exfoliation of graphene from the GNPs, increasing the conductivity. It has been shown that intercalation of the polymer between silicate layers in polymer−clay composites
that break up larger, isolated aggregates, can lead to network build up by the formation of smaller percolated aggregates.14In addition, we calculate a critical shear rate of 0.04 s−1
for exfoliation of graphene from the GNPs. The conductivity of our samples improves at rates≤0.1 s−1and is most efficient at a rate
of 0.01 s−1, These shear rates are of the same order of
magnitude as our estimated exfoliation rate, and this process has been observed previously in clay14−16 and graphene27 nanocomposites. The required shear rate, γ̇, for graphene
exfoliation can be estimated as28
γ̇ = −
η
E E
[ ]
L S G, S L, 2
[image:4.625.285.560.53.272.2](3) Figure 1.Schematic of processing effects on the GNP structure within
the composite: Initially the composite has an agglomerated structure that has formed a network. Under low shear (1), this can break apart the agglomerates and exfoliate graphene, forming a more effective
network, enhancing the conductivity. At higher shear rates (2), the conductivity reduces with increasing alignment of the GNPs. During annealing the aligned GNPs begin to relax, increasing the conductivity (3), but with more annealing the GNPs will reagglomerate into discrete agglomerates of GNPs, decreasing the conductivity (4). Eventually a secondary agglomeration of the GNPs occurs, forming a connected network, and enhancing the conductivity again (5). The best processing steps for particular properties are highlighted.
Figure 2.Schematic of the rheo-impedance device: (a) ring electrode acts as the bottom plate, giving a well-defined shear rate for the
[image:4.625.63.305.65.266.2]whereES,GandES,Lare the surface energies of the graphene and the polystyrene, respectively, η is the viscosity, and L is the GNP length. The zero shear viscosity of the polymer is
∼18,000 Pa s (see Supporting Information), L = 5 μm,
ES,G = 71 mJ m−2,28
and ES,L = 42 mJ m−2.29
The process of exfoliation and the release of GNP particles from agglomerates would increase the interface of thefiller within the composite,
helping to build a more effective network, and increasing the
conductivity of the composite.
At higher shear rates (≥0.3 s−1) the impedance of the
composite is increased, with the magnitude of the change increasing with the shear rate. This shows a loss of the conducting network within the composite. Following shear at 3 s−1for 5 min the impedance of the composite is four orders of
magnitude greater than that of the composite following shear at a rate of 0.01 s−1. This is also reflected by an increase in the
[image:5.625.62.300.64.481.2] [image:5.625.326.562.285.696.2]phase angle of the network during shear. This can be seen in
Figure 3b, where the phase angle of the composite increases
from a value of∼2.5 degrees at rest to values over 40 degrees
during shear. Such a change reveals a switch from predominantly resistive behavior to one with increasingly high capacitive contributions. This shows a change in the composite structure under shear. Alignment of the GNPs, parallel to the rheometer plates, at higher shear rates would result in the loss of a resistive network and the formation of a layered structure of polymer and aligned GNPs. This produces
a capacitive structure,3 where the impedance is measured
between the rheometer’s parallel plates, and would account for such an increase in the phase angle.
The impedance of the composite immediately following cessation of the shear is shown inFigure 4a (zones 1 and 2). Following an initial lag of ∼7 s after the shear, the aligned
samples show a reduction in the impedance, as highlighted by zone 3. The magnitude of this drop is dependent on the preceding shear rate: the faster the shear, the larger the drop in the impedance observed. This unprecedented change in impedance is consistent with the relaxation of shear induced
Figure 3.Polystyrene + 5 vol % GNPs during shear: (a) change in the impedance,|Z|, during shear at rates of 0.01−3 s−1. (b) Change in the
phase angle of the impedance,ϕ, during shear. Different stages in the
processing are highlighted in (a), corresponding to the steps inFigure 1. The relative contributions of the resistance and reactance of the network are shown inSupporting Information, Figure S7.
Figure 4.Polystyrene + 5 vol % GNPs during annealing at 200°C: (a) change in the impedance, |Z|, and (b) the phase angle of the impedance, ϕ, following cessation of shear as a function of the preceding shear rate. Different stages in the processing are highlighted
in (a) and (b), corresponding to the steps inFigure 1.
Chemistry of Materials Article
DOI:10.1021/acs.chemmater.7b04343
alignment within the composite, establishing a more effective
conducting network. This is also supported by a decrease in the phase angle of the composite (Figure 4b), which suggests a change from an aligned capacitive structure to a more randomly oriented, resistive network structure.
We calculate the rotational diffusivity,Θ, of our GNPs to be ∼2.5 × 10⁻⁹ s−1. Remarkably we see the relaxation process
occur over the course of∼10 s, which exceeds the calculated
reorientation rate for GNPs under quiescent conditions by approximately eight orders of magnitude. We estimateΘfrom
the equation for rotational diffusion of ellipsoid particles:26
πη
Θ = ⎡ ⎜ ⎟−
⎣⎢ ⎛ ⎝
⎞ ⎠
⎤ ⎦⎥
kT
a
a
b 3
16 2 ln
2 1 matrix
3
(4)
where k is the Boltzmann constant, η the matrix viscosity
(∼18000 Pa s),athe diameter (5μm), andbthe thickness (5 nm) of the GNPs. Rapid losses in alignment of clay particles in polymer composites have previously been linked to the polymer stress relaxation,26or a coupling between the polymer chains and the clay accelerating the particle relaxation.25Here, we have observed the relaxation of the polymer stress following cessation of the shear over the course of the time scale observed
for the change in impedance measured (see Supporting
Information). The relaxation of the polymer stress may therefore lead to an initial rapid orientation relaxation of the GNPs within the composite. Gradually, however, following this initial decrease, the impedance increases to a maximum. This is also seen at the lower shear rates (zone 4) before then reducing again to levels below that seen immediately following the shear step. Clearly there are multiple structural evolutions within the composite during the relaxation stage. Following any random-ization of the GNPs, we propose that a two-step agglomeration process occurs. Initially there is a loss of network structure and a collection of discrete agglomerates, which reduces the composite conductivity. A secondary agglomeration step results in the formation of an interconnected network of the discrete agglomerates, and the formation of a conducting network (5). Changes in the dispersion of graphene in polypropylene
composites upon annealing at 200 °C have shown the
formation of an interconnected, macroscopic network from smaller aggregates, increasing composite conductivity,30 while recovery of conductivity following deformation in graphene based composites has been observed following various tensile, bending, compression, and oscillatory shear tests.27,31,32 Oscillatory shear can have markedly different effects on the
conductivity of polymer composites than steady shear, as
network deformation can be reversible,9 described as an
agglomerated network memory effect.33 Using steady-shear,
our results are more akin to processing conditions than oscillation. The complexity of relaxation behavior seen in our work has not been observed before and is unique to these GNP composites. A control composite made with carbon black did not show this relaxation behavior, instead showing monotonic reductions in impedance following all the preceding shear rates
studied (see Supporting Information). As with the rapid
disorientation (step 3) the time scale for the GNP agglomeration processes is much quicker than expected by Brownian motion and is likely to be driven by attractive interparticle interactions in the polymer matrix. Similar conclusions were formed from the structural evolution of polypropylene−clay nanocomposites, but this is the first time
that such behavior has been verified through dramatic changes
to impedance.17,18
The processing is seen to be cyclic. For example, Figure 5
shows the change in the impedance of the composite under
repeated shear and annealing steps. During step (1) the composite is sheared at a rate of 0.3 s−1, resulting in an increase
in the impedance of the composite (and a reduction in conductivity). Upon cessation of the shear, the sample is annealed (2). During this stage the impedance increases to a maximum, before decreasing again, as previously described. In stage (3) the sample is sheared at a rate of 0.01 s−1. There is a
brief spike in the impedance upon start-up of the shear, before the impedance of the composite is reduced over the course of the shear to its lowest level during the experiment, increasing the composite conductivity. This matches with the behavior described inFigure 3a. Once this shear stage is stopped, (4) we
find the impedance increases to a maximum under annealing,
before then reducing again.
Direct confirmation of the internal orientation of GNPs
during shear processing was determined by SAXS. Our rheometer was aligned within the beamline I22 at Diamond Light Source to measure the SAXS of the composite samples 1 mm from their edge while being sheared or annealed. Graphene
materials have been shown to have different structures
depending on the scattering length scale observed.34 Here, we monitor the orientation at our largest length scale, in theq range 0.002−0.0035 Å−1 (length scale of ∼2000 Å) so as to
avoid the contribution of wrinkles or edges to the scattering.34 GNP orientation factors were calculated using the Cinader and
Burghardt equation.23 A value of +1 indicates perfect
orientation in the flow direction, −1 perfect orientation in
the transverse direction, and a value of zero indicates no alignment. The results show a number of interesting effects.
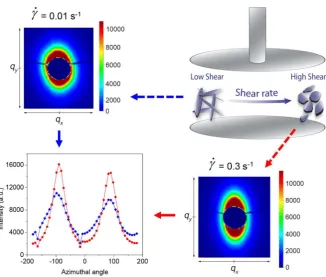
Following shear at 0.01 s−1, where the sample has its highest
conductivity, it is apparent from the detector image there is some alignment present in the sample (Figure 6). A randomly oriented sample would give a perfectly isotropic scattering pattern. At a shear rate of 0.3 s−1, it can be seen that the
anisotropy of the scattering has increased (Figure 6). Two peaks are observed at angles of−90°and +90°as the scattering
[image:6.625.323.566.116.265.2]intensity is plotted as a function of the azimuthal angle. This highlights the orientation of the GNPs within the composite and shows the increase in alignment of the sample following Figure 5.Impedance,|Z|, of polystyrene + 5 vol % GNPs during cyclic processing at 200°C during (1) 0.3 s−1shear, (2) annealing, (3) 0.01
shear at 0.3 s−1. The calculated orientation factor increases from
0.27 to 0.47 at 0.01 and 0.3 s−1shear, respectively.
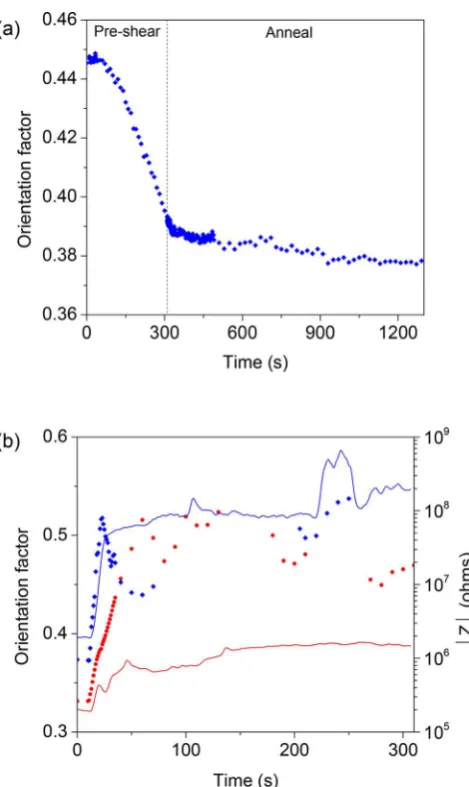
Interestingly, we find that shearing the sample at the lowest
rates reduces the pre-existing alignment of the GNPs within the composite. It can be seen inFigure 7a that before the preshear stage the composite retains a high degree of alignment from the initial pressing. Upon start-up of the shear at a rate of 0.01 s−1,
the orientation initially increases slightly before reducing for the rest of the shear stage. Upon cessation of the shear the orientation monotonically decays, but at a much lower rate than during shear. Further shear of the sample at 0.01 s−1 reduces
the composite alignment further. The reduction in alignment corresponds with the decrease in impedance of the composite (Figure 3a) at this shear rate and highlights GNP structural changes leading to increasing conductivity.
At higher shear rates, the orientation increases during shear. The speed at which the orientation increases is also seen to increase with the shear rate, as shown inFigure 7b. Upon start-up of the shear, the orientation factor increases instantly and is much quicker at a shear rate of 1.8 s−1
than at 0.3 s−1
. This is also matched by the impedance response of the composite, where the 0.3 s−1shear impedance increases at a lower rate than
the 1.8 s−1 sample. The impedance eventually plateaus, while
the orientation factor at both rates seems to average around a plateau of ∼0.5, suggesting a limit to the orientation of the
GNPs in the system. The higher impedance at a shear rate of 1.8 s−1
compared to 0.3 s−1
shear rate is also likely to be a consequence of increased breakup of GNP networks, in addition to the increase in alignment. The orientation of the GNPs under the action of shear, however, suggests that these actions are closely linked to the effect on the impedance of the
composites during processing.
The changes in alignment of the GNPs at different shear
rates shows the importance of the shear processing to the structure of the composite, which directly relates to the ability to enhance various properties of the polymer.
■
CONCLUSIONSWe have shown a series of property changes through continuous shear and anneal processing in composites filled
with GNPs. We have combined impedance spectroscopy with rheometry and used small-angle X-ray scattering to investigate the GNP orientation within the composites during these processing steps. They have a huge impact on the composite impedance, with reversible changes of several orders of magnitude, and the conductivity of the composite can be enhanced or diminished. Low shear rates help to build a network, improving conductivity, while higher rates break the network and align the GNPs, reducing conductivity. Upon annealing post-shear, several more changes are observed comprising disorientation and agglomeration steps. Our insights are important for understanding how the GNP structure evolves and can be controlled within the polymer environment. If the composite structure is fixed at specific
points through the processing cycle, it will be possible not only to gain control over the electrical properties of the composite, but to optimize production for a whole range of different
properties. These results therefore present a significant
advancement in our understanding of the relationship between processing, structure, and properties in polymer−graphene
[image:7.625.150.477.62.339.2]composites. As our insights hinge predominantly on the physical shape and aspect ratio of the GNP (rather than its precise chemical interactions with the matrix), it presents a model system with wide applicability and impact upon the Figure 6.SAXS of polystyrene + 5 vol % GNPs composites at 200°C; 2D scattering patterns following 0.01 s−1shear and 70 s of 0.3 s−1shear.
Anisotropy in the scattering pattern shows the alignment of the GNPs in the composite, which increases following the increased shear. The scattering intensity as a function of the azimuthal angle in theqrange 0.002−0.0035 Å−1is plotted. Samples following 0.01 s−1(blue) and 0.3 s−1
(red) shear are shown, calculated from the 2D scattering patterns. Zero degrees represents the 3-o’clock position on the detector image, and the angle increases in the clockwise direction. The orientation factor increases from 0.27 to 0.47 between these shear rates.
Chemistry of Materials Article
DOI:10.1021/acs.chemmater.7b04343
family of composites formed from two-dimensional filler
materials, platelets, and nanoparticles.
■
ASSOCIATED CONTENT*
S Supporting InformationThe Supporting Information is available free of charge on the
ACS Publications website at DOI: 10.1021/acs.chemma-ter.7b04343.
Rheo-impedance measurements for composites of PS +
carbon black, used as a control sample. Effect of
temperature on the processing of PS + GNP composites. Zero shear viscosity measurement for the PS. Composite stress relaxation times as a function of shear rate. Size exclusion chromatography of the PS. Rheological and impedance data for percolation of as pressed samples. Resistance and reactance of impedance under shear (PDF)
■
AUTHOR INFORMATIONCorresponding Author
*E-mail: [email protected].
ORCID
Andrew J. Smith:0000-0003-3745-7082
Karl S. Coleman:0000-0001-9091-7362
Author Contributions
#
S.C.B. and D.W.J. contributed equally to this work.
Notes
The authors declare no competingfinancial interest.
■
ACKNOWLEDGMENTSEPSRC (U.K.) is acknowledged for supporting this work through grant reference number EP/K016784/1. We thank Diamond Light Source for access to beamline I22 (proposal SM15187) that contributed to the results presented here. This work benefited from the use of DAWN v2.3.1 for analysis of the
small-angle X-ray scattering results. We kindly thank TA Instruments for use of their Electrically Heated Plates for the SAXS measurements.
■
REFERENCES(1) Weir, M. P.; Johnson, D. W.; Boothroyd, S. C.; Savage, R. C.; Thompson, R. L.; King, S. M.; Rogers, S. E.; Coleman, K. S.; Clarke, N. Distortion of Chain Conformation and Reduced Entanglement in Polymer-Graphene Oxide Nanocomposites.ACS Macro Lett.2016,5
(4), 430−434.
(2) Li, Z.; Young, R. J.; Wilson, N. R.; Kinloch, I. A.; Valles, C.; Li, Z.́
Effect of the Orientation of Graphene-Based Nanoplatelets upon the Young’s Modulus of Nanocomposites.Compos. Sci. Technol.2016,123, 125−133.
(3) Yousefi, N.; Sun, X.; Lin, X.; Shen, X.; Jia, J.; Zhang, B.; Tang, B.; Chan, M.; Kim, J. K. Highly Aligned Graphene/polymer Nano-composites with Excellent Dielectric Properties for High-Performance Electromagnetic Interference Shielding. Adv. Mater. 2014, 26 (31), 5480−5487.
(4) Yoo, B. M.; Shin, H. J.; Yoon, H. W.; Park, H. B. Graphene and Graphene Oxide and Their Uses in Barrier Polymers.J. Appl. Polym. Sci.2014,131(1), 1−23.
(5) Compton, O. C.; Kim, S.; Pierre, C.; Torkelson, J. M.; Nguyen, S. T. Crumpled Graphene Nanosheets as Highly Effective Barrier Property Enhancers.Adv. Mater.2010,22, 4759−4763.
(6) Kim, H.; Macosko, C. W. Processing-Property Relationships of Polycarbonate/graphene Composites.Polymer2009,50(15), 3797− 3809.
(7) Alig, I.; Skipa, T.; Engel, M.; Lellinger, D.; Pegel, S.; Pötschke, P.
Electrical Conductivity Recovery in Carbon Nanotube-Polymer Composites after Transient Shear. Phys. Status Solidi B 2007, 244
(11), 4223−4226.
(8) Alig, I.; Skipa, T.; Lellinger, D.; Bierdel, M.; Meyer, H. Dynamic Percolation of Carbon Nanotube Agglomerates in a Polymer Matrix: Comparison of Different Model Approaches. Phys. Status Solidi B
2008,245(10), 2264−2267.
(9) Alig, I.; Pötschke, P.; Lellinger, D.; Skipa, T.; Pegel, S.; Kasaliwal,
G. R.; Villmow, T. Establishment, Morphology and Properties of Carbon Nanotube Networks in Polymer Melts.Polymer2012,53(1), 4−28.
(10) Kharchenko, S. B.; Douglas, J. F.; Obrzut, J.; Grulke, E. A.; Migler, K. B. Flow-Induced Properties of Nanotube-Filled Polymer Materials.Nat. Mater.2004,3(8), 564−568.
[image:8.625.62.297.63.457.2](11) Obrzut, J.; Douglas, J. F.; Kharchenko, S. B.; Migler, K. B. Shear-Induced Conductor-Insulator Transition in Melt-Mixed Polypropy-lene-Carbon Nanotube Dispersions. Phys. Rev. B: Condens. Matter Mater. Phys.2007,76(19), 195420.
Figure 7.Orientation factors calculated for composites of polystyrene + 5 vol % GNPs from SAXS under shear at 200°C. (a) Orientation factor of GNPs during a preshear at a rate of 0.01 s−1and subsequent
annealing step. (b) Orientation factors (symbols) and impedance|Z|
(12) Moon, D.; Obrzut, J.; Douglas, J. F.; Lam, T.; Koziol, K. K.; Migler, K. B. Three Dimensional Cluster Distributions in Processed Multi-Wall Carbon Nanotube Polymer Composites.Polymer2014,55
(15), 3270−3277.
(13) Starý, Z.; Krückel, J.; Schubert, D. W. Conductivity of Carbon
Black-Based Polymer Composites under Creep in the Molten State.
Polymer2014,55(16), 3980−3986.
(14) Reyna-Valencia, A.; Deyrail, Y.; Bousmina, M. Situ Follow-up of the Intercalation Process in a Clay/polymer Nanocomposite Model System by Rheo-XRD Analyses.Macromolecules2010,43(1), 354− 361.
(15) Wang, X.; Sun, P.; Xue, G.; Winter, H. H. Late-State Ripening Dynamics of a Polymer/clay Nanocomposite.Macromolecules2010,43
(4), 1901−1906.
(16) Bousmina, M. Study of Intercalation and Exfoliation Processes in Polymer Nanocomposites. Macromolecules2006,39 (12), 4259− 4263.
(17) Solomon, M. J.; Almusallam, A. S.; Seefeldt, K. F.; Somwangthanaroj, A.; Varadan, P. Rheology of Polypropylene/Clay Hybrid Materials.Macromolecules2001,34, 1864−1872.
(18) Treece, M. A.; Oberhauser, J. P. Soft Glassy Dynamics in Polypropylene-Clay Nanocomposites.Macromolecules2007,40, 571− 582.
(19) Bonn, D.; Kellay, H.; Tanaka, H.; Wegdam, G.; Meunier, J. Laponite:What Is the Difference between a Gel and a Glass?Langmuir
1999,15(14), 7534−7536.
(20) Abou, B.; Bonn, D.; Meunier, J. Aging Dynamics in a Colloidal Glass.Phys. Rev. E: Stat. Phys., Plasmas, Fluids, Relat. Interdiscip. Top.
2001,64(2), 21510.
(21) Bonn, D.; Tanase, S.; Abou, B.; Tanaka, H.; Meunier, J. Laponite: Aging and Shear Rejuvenation of a Colloidal Glass. Phys. Rev. Lett.2002,89(1), 15701.
(22) Basham, M.; Filik, J.; Wharmby, M. T.; Chang, P. C. Y.; El Kassaby, B.; Gerring, M.; Aishima, J.; Levik, K.; Pulford, B. C. A.; Sikharulidze, I.; Sneddon, D.; Webber, M.; Dhesi, S. S.; Maccherozzi, F.; Svensson, O.; Brockhauser, S.; Naray, G.; Ashton, A. W. Datá
Analysis WorkbeNch (DAWN).J. Synchrotron Radiat.2015,22, 853− 858.
(23) Cinader, D. K.; Burghardt, W. R. Mixed Orientation State Induced by Expansion Flow of a Thermotropic Liquid-Crystalline Polymer.Macromolecules1998,31(25), 9099−9102.
(24) Fornes, T. D.; Paul, D. R. Modeling Properties of Nylon 6/clay Nanocomposites Using Composite Theories.Polymer2003,44, 4993− 5013.
(25) Schmidt, G.; Nakatani, A. I.; Butler, P. D.; Karim, A.; Han, C. C. Shear Orientation of Viscoelastic Polymer-Clay Solutions Probed by Flow Birefringence and SANS.Macromolecules2000,33(20), 7219− 7222.
(26) Lele, A.; Mackley, M.; Galgali, G.; Ramesh, C. In Situ Rheo-X-Ray Investigation of Flow-Induced Orientation in Layered Silicate− syndiotactic Polypropylene Nanocomposite Melt. J. Rheol.2002,46
(5), 1091.
(27) Beckert, F.; Held, A.; Meier, J.; Mülhaupt, R.; Friedrich, C.
Shear- and Temperature-Induced Graphene Network Evolution in Graphene/polystyrene Nanocomposites and Its Influence on Rheo-logical, Electrical, and Morphological Properties.Macromolecules2014,
47(24), 8784−8794.
(28) Paton, K. R.; Varrla, E.; Backes, C.; Smith, R. J.; Khan, U.; O’Neill, A.; Boland, C.; Lotya, M.; Istrate, O. M.; King, P.; Higgins, T.; Barwich, S.; May, P.; Puczkarski, P.; Ahmed, I.; Moebius, M.; Pettersson, H.; Long, E.; Coelho, J.; O’Brien, S. E.; McGuire, E. K.; Sanchez, B. M.; Duesberg, G. S.; McEvoy, N.; Pennycook, T. J.; Downing, C.; Crossley, A.; Nicolosi, V.; Coleman, J. N. Scalable Production of Large Quantities of Defect-Free Few-Layer Graphene by Shear Exfoliation in Liquids.Nat. Mater.2014,13(6), 624−630.
(29) Briggs, D.; Range, D. G.; Briscoe, B. J.Comprehensive Polymer Science: Polymer Properties, First.; Booth, C., Price, C., Eds.; Pergamon Press: Oxford, 1989; Vol.2.
(30) Zhao, S.; Chen, F.; Zhao, C.; Huang, Y.; Dong, J.-Y.; Han, C. C. Interpenetrating Network Formation in Isotactic Polypropylene/ graphene Composites.Polymer2013,54(14), 3680−3690.
(31) Lin, Y.; Dong, X.; Liu, S.; Chen, S.; Wei, Y.; Liu, L. Graphene− Elastomer Composites with Segregated Nanostructured Network for Liquid and Strain Sensing Application. ACS Appl. Mater. Interfaces
2016,8(36), 24143−24151.
(32) Boland, C. S.; Khan, U.; Ryan, G.; Barwich, S.; Charifou, R.; Harvey, A.; Backes, C.; Li, Z.; Ferreira, M. S.; Möbius, M. E.; Young, R.
J.; Coleman, J. N. Sensitive Electromechanical Sensors Using Viscoelastic Graphene-Polymer Nanocomposites. Science 2016, 354
(6317), 1257−1260.
(33) Lellinger, D.; Skipa, T.; Böhm, W.; Alig, I. Spatial Decorrelation
of the Conductive Nanotube Network in a Polymer Melt.Phys. Status Solidi B2009,246(11−12), 2667−2670.
(34) Weir, M. P.; Johnson, D. W.; Boothroyd, S. C.; Savage, R. C.; Thompson, R. L.; Parnell, S. R.; Parnell, A. J.; King, S. M.; Rogers, S. E.; Coleman, K. S.; Clarke, N. Extrinsic Wrinkling and Single Exfoliated Sheets of Graphene Oxide in Polymer Composites.Chem. Mater.2016,28(6), 1698−1704.
Chemistry of Materials Article
DOI:10.1021/acs.chemmater.7b04343