Int. J. Electrochem. Sci., 7 (2012) 5754 - 5764
International Journal of
ELECTROCHEMICAL
SCIENCE
www.electrochemsci.org
Temperature Effect on the Corrosion Behaviour of Alloy 31 in
polluted H
3PO
4and Analysis of the Corrosion Products by
Laser Raman Microscope
C. Escrivà-Cerdán1
, E. Blasco-Tamarit1, D.M. García-García1, J. García-Antón1,*, A. Ben-Bachir2
1 Ingeniería Electroquímica y Corrosión (IEC). Departamento de Ingeniería Química y Nuclear. ETSI
Industriales. Universitat Politècnica de Valencia. Calle Camino de Vera s/n, 46022 Valencia, Spain.
2
Laboratoire de Corrosion-Electrochimie, Faculté des Sciences, Université Mohammed V-Agdal, BP 1014 Rabat, Morocco.
*
E-mail: [email protected]
Received: 3 April 2012 / Accepted: 5 June 2012 / Published: 1 July 2012
Electrochemical behaviour of Alloy 31, a highly alloyed austenitic stainless steel (UNS N08031), in a 40 wt.% H3PO4 solution polluted with 2 wt.% H2SO4, 0.06 wt.% KCl and 0.6 wt.% HF was evaluated
by cyclic potentiodinamic curves at different temperatures (20, 40, 60 and 80 ºC). Temperature was found to favour both cathodic and anodic reactions. The corrosion products forming on the surface of Alloy 31 were indentified in situ by Laser Raman microscope. Corrosion products were mainly iron and chromium oxides, although phosphates were also included as a corrosion product on the surface of Alloy 31.
Keywords: Stainless steel, Phosphoric acid, Temperature, Laser Raman microscope
1. INTRODUCTION
The behaviour of stainless steels in aqueous acid solutions has been widely studied. In this sense, there are many references on the literature regarding to the corrosion behaviour of austenitic stainless steels in sulphuric acid solutions [4-8]. The corrosion behaviour of stainless steels has also been studied in phosphoric acid solutions [9-12] and other results [3, 13, 14] have been reported for the electrochemical behaviour of stainless steels in mixtures of chloride and fluoride aqueous solutions. However, only very limited information is available on the corrosion behaviour of super-austenitic stainless steels in phosphoric acid solution polluted with various aggressive ions, such as chloride and fluoride.
The aim of this research was to study the corrosion behaviour of the UNS N08031 (Alloy 31), a highly-alloyed austenitic stainless steel, in phosphoric acid medium polluted with sulphate, chloride and fluoride ions, simulating typical industrial conditions [15]. The effect of the solution temperature (at 20, 40, 60 and 80 ºC) on the electrochemical behaviour was evaluated by cyclic potentiodinamic curves. Finally, the corrosion products forming on the surface of Alloy 31 were characterised by using Laser Raman microscope.
2. EXPERIMENTAL PROCEDURE
2.1. Material, specimen preparation and solution
The material tested was the high-alloyed austenitic stainless steel UNS N08031 (Alloy 31) provided by Thyssen Krupp VDM. The composition of this alloy is: 26.75% Cr, 31.85% Ni, 31.43% Fe, 6.6% Mo, 1.50% Mn, 1.21% Cu, 0.193% N, 0.1% Si, 0.005% C, 0.002% S, 0.017% P. Alloy 31 electrodes were cylindrically shaped (8 mm in diameter and 55 mm long) and covered with a polytetrafluoroethylene (PTFE) coating. The area exposed to the solution was 0.5 cm2.
The electrodes were abraded with wet emery paper of decreasing grit size (500 - 4000). After polishing, samples were rinsed with distilled water and dried with a stream of air just before the immersion.
Samples were tested in a polluted 40 wt.% phosphoric acid solution with 2 wt% of H2SO4, 0.06
wt.% KCl and 0.6 wt.% HF, typical concentrations for the phosphoric acid industry [15].
2.2. Electrochemical tests
Three different electrochemical tests were performed in a PTFE vertical three-electrode cell held at a constant temperature. Silver/silver chloride (Ag/AgCl) 3 M potassium chloride (KCl) electrode was used as a reference electrode and a platinum (Pt) wire as a counter electrode. The solution was deaerated by bubbling N2 into the solution for 20 min before the test, and then the
2.2.1. Open Circuit Potential measurements
The open circuit potential was measured for 1 hour in the test solution. The average value of the potentials recorded during the last 300 seconds was the value of the OCP according to ASTM G-5 [16].
2.2.2. Potentiodynamic tests
Cyclic potentiodynamic curves were determined by using a Solartron 1278 potentiostat. Before each polarisation measurement, the working electrodes were initially polarised in four steps from the OCP values to 0 VAg/AgCl. This potential was maintained for 1 hour in order to remove the passive film
formed previously and to create reproducible initial conditions. Then the sample was polarised anodically from 0 VAg/AgCl to the anodic direction at a scan rate of 0.1667 mV/s (ASTM G-5 [16]).
Electrochemical characteristic parameters were estimated from these curves: corrosion current density (icorr) and corrosion potential (Ecorr) were obtained. In addition, the transpassive potential (Etr) was defined as the potential at which the current density abruptly increases. The current density before Etr is almost constant which belongs with the passive current density (ip) within this region. Therefore, information about general electrochemical behaviour of Alloy 31 in the polluted H3PO4 solution was
obtained.
2.3. In situ Raman spectroscopy analysis
Raman spectra were recorded using a WITec high resolution Raman spectrometer (ALPHA300 M+). Excitation was provided by a He-Ne high power laser (632.750 nm) through a Nikon microscope with a long distance objective at 500x for in situ measurements. Laser power was 0.1 mW to prevent further transformation of the product due to the laser heating. Detection was achieved with a cooled charge coupled device (CCD) detector. Acquisition and basic treatment of spectra were performed with WITec Control software.
3. RESULTS AND DISCUSSION
3.1. Open Circuit Potentials
which is a passivable element. Thus, during the OCP test the passive film containing Cr2O3 grew on
the electrode surface, shifting the OCP value to higher potentials [18].
0 50 100 150 200 250 300 350
0 900 1800 2700 3600
Time (s)
E
(m
VAg/AgCl
)
[image:4.596.124.461.139.353.2]20ºC 40ºC 60 ºC 80 ºC
Figure 1. Evolution of the open circuit potential with time for the Alloy 31 registered during 1 hour at 20, 40, 60 and 80 ºC in 40 wt.% polluted phosphoric acid solution.
[image:4.596.69.519.568.614.2]The OCP values of Alloy 31 in the phosphoric acid solution are summarised in Table 1. It can be seen that OCP values shifted towards more positive values as temperature increases. This increase is justified by the passive nature of Alloy 31. It is well known that temperature favours the kinetics of corrosion reactions [19-23], however it also promotes the fast growth of passive films on metallic surfaces [24-26], which causes the ennoblement of the metal.
Table 1. OCP values for Alloy 31 in the studied H3PO4 solution at different temperatures.
Temperature (ºC) 20 40 60 80
OCP (mVAg/AgCl) 220.4 277.3 302.2 320.1
3.2. Potentiodynamic tests
-9 -7 -5 -3 -1
0.0 0.4 0.8 1.2
E (VAg/AgCl)
log
Ii
I
(A
/cm
2 )
20 ºC 40 ºC 60 ºC 80 ºC
Figure 2. Potentiodynamic curves of Alloy 31 in polluted 40 wt.% H3PO4 with 2 wt.% H2SO4, 0.06
wt.% KCl and 0.6 wt.% HF at different temperatures.
Temperature affects the cathodic reaction as it can be observed on the potentiodynamic curves, since the cathodic current densities increased with temperature (Figure 2). This shows that temperature favours the cathodic reaction [19, 27] and more specifically, it favours the hydrogen evolution reaction (HER) which leads to an increase of H2 generation. Temperature also favours the kinetics of the
corrosion reactions, and especially the anodic dissolution of the metal, since the anodic current densities are higher as temperature increases. Polarisation curves show that Alloy 31 passivated at all temperatures since a passivation range is observed. In this sense, a stable current density is registered during this range of potentials at 20 and 40 ºC; however, current density values slightly and progressively increased at 60 and 80 ºC. This fact indicates that the increase of temperature affects on the passivity range of the material [28]. As a consequence, the abrupt increase of current density, which indicates the loss of passivity of Alloy 31, occurs at lower potentials as temperature increases.
Table 2. Electrochemical parameters for Alloy 31 in the studied H3PO4 solution at different
temperatures.
T (ºC) Ecorr (mV) icorr (A/cm2) ip (A/cm2) Etr (mV)
20 235 1.27 7.35 1142
40 289 1.78 12.6 1124
60 322 3.33 26.0 969
[image:5.596.125.447.77.294.2] [image:5.596.54.545.621.747.2]
The presence of aggressive ions, such as chloride, sulphates and fluorides in the solution, accelerates the anodic process; therefore, the harmful effect of temperature is greater in this solution because these ions should make the oxide dissolution easier [9, 29-31].
From the potentiodynamic polarisation curves, corrosion potentials (Ecorr), corrosion current densities (icorr), passive current density (ip) and the transpassive potential (Etr) were obtained (Table 2). It can be observed that Ecorr and icorr increase with temperature, as well as ip showed an increase with temperature.
The increase of Ecorr and icorr seems to be related with the increase in both, cathodic and anodic current densities with temperature. The increase in cathodic branch has been attributed to the enhancement of the cathodic reaction (HER) with temperature [19, 32, 33] and the effect of temperature in this solution is greater due to the presence of aggressive ions, as a result, these ions affect the anodic branch [9, 29-31]. The corrosion potentials followed the same tendency as the OCP values, although Ecorr values are slightly lower, indicating that the OCP values of Alloy 31 in this solution are close to the cathodic-anodic transition. This phenomenon suggests that Alloy 31 under these conditions will be close to the equilibrium potential. This behaviour was also reported for steels in fluoride containing solutions [2]. Although the icorr values are observed to increase with temperature; this parameter abruptly increases from 40 ºC, suggesting an accelerating effect of aggressive ions at elevated temperatures.
The trend of the passivation current densities, ip increasing with temperature, is explained by the fact that the increase of temperature favours the growth of the passive film, since temperature favours the kinetic reaction [19]. The passive film on Alloy 31 consists of an inner layer, which the main compound might be Cr2O3 [29, 34, 35], since Alloy 31 contains high Cr content. The outer layer
of the passive film is probably enriched in iron phosphates. In this context, several studies have reported that phosphates species are incorporated into the outer part of the passive film during the passivation process [36-39].
Transpassive potential, Etr is observed to decrease as temperature increases; consequently, Alloy 31 is less corrosion resistant as temperature increases in the phosphoric acid solution polluted with 2% H2SO4, 0.06% KCl y 0.6% HF. These results reveal that the passive films formed at lower
temperatures are significantly less defective and more resistant to film breakdown than those formed at higher temperatures, as reported by several authors [12, 17, 19, 25, 32, 33, 40].
The Alloy 31 surface was observed after the potentiodynamic curves in order to study the corrosion attack on its surface by using an optical LEICA microscope. Figure 3 shows the images of the surface after having performed the tests at different temperatures.
steels in solutions with fluoride and chloride ions, associating the growth of these pits with general corrosion [44].
50 m 50 m
(a) (b)
50 m 50 m
[image:7.596.115.483.131.451.2](c) (d)
Figure 3. Images of Alloy 31 surface taken at the end of the potentiodynamic test at (a) 20, (b) 40, (c) 60 and (d) 80 ºC (100X).
Therefore, the small pits formed during the polarisation curves (Figure 3) are due to the presence of chloride ions in the solution. Further growth of these pits will generate general corrosion as a consequence of fluorides, although this is not clearly observed in the images presented in Figure 3.
3.3. In situ Raman spectroscopy analysis
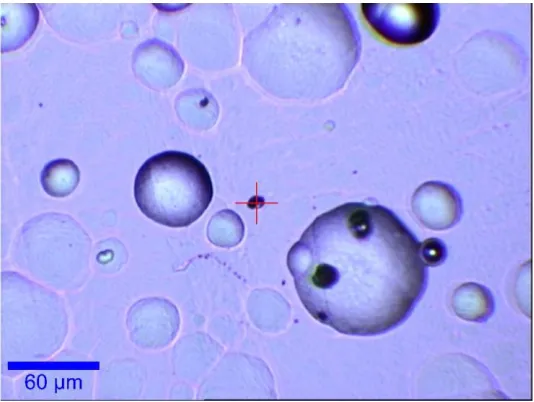
In situ Raman spectroscopy was used in order to characterise the corrosion products forming during the polarisation process of the samples at 80 ºC, which were the most extreme conditions.
Figure 4. Image of Alloy 31 taken after the polarisation curve at 80 ºC in the Raman microscope (500X).
The Raman spectrum of the corrosion products on Alloy 31 in the 100 to 500 cm-1 region is reported in Figure 5a. According to data found in the literature, the position of Raman peak at 290 has been attributed to the presence of haematite (Fe2O3) [45, 46] which is the most stable kind of iron
oxide. In this sense, the Raman spectra obtained for haematite has shown this peak [45, 46], belonging to -Fe2O3. The other peaks depicted in this spectral region (Figure 5a) correspond to the phosphate
bending modes. The set of band observed at 397, 413 and 448 cm-1 are attributed to the 2 bending
modes of the HOPO32- units [47]. A series of Raman bands are observed in the far low wavenumber
region (at 198, 219 and 243 cm-1) are simply described as lattice modes, since in this spectral region bands are not normally tabulated in databases [47].
The Raman spectrum of corrosion products on Alloy 31 in the 500-800 cm-1 region is shown in Figure 5b. In this case, one band is only depicted at around 520 cm-1 which belongs to the chromium oxide (III) [45, 46].
Apart from the presence of chromium and iron oxides, one could expect contributions of Ni as NiO at the surface layer. In this sense, the reported value for the heat of formation of NiO was -243.19 kJ mol-1 where as the same for FeO and Fe2O3 were -266.28 and -824.60 kJ mol-1, respectively [48].
Cr2O3 has more negative heat of formation, i.e. -1058.58 kJ mol-1 [49]. Hence, Fe and Cr would
[image:8.596.165.432.69.270.2]
100 200 300 400 500
Wavenumber / cm-1
Ra
ma
n
In
tensity
/
a.u
. Fe
2O3
448 413 397 198
219
243
500 600 700 800
Wavenumber / cm-1
Raman Intensity / a.
u.
Cr2O3
[image:9.596.63.516.69.356.2](a) (b)
Figure 5. Raman spectrum of Alloy 31 after the polarisation curve at 80 ºC over the (a) 100-500 cm-1 and (b) 500-800 cm-1 range.
Therefore, these results clearly supported the fact that phosphate compounds are included in the passive film formed on Alloy 31, as reported by other authors [37, 38, 52, 53]. Fe and Cr oxides were detected on the corroded surface of Alloy 31 after the cyclic potentiodynamic treatment, while in passive films Ni was not detected by Raman study, although its presence could not be ruled out [49]. The presence of MoO3 (1005 cm-1) was not detected either. According to Pardo el al. [54], the
presence of MoO3 oxide would be expected, since the strong acidic conditions favours the precipitation
of molybdenum as MoO3 oxide. However, Laser Raman microscopic studies performed by Ramya et
al. [49] on austenitic stainless steels confirmed that MoO3 on the corroded samples was not detected,
which suggests that Laser Raman microscope did not detect its presence on Alloy 31. Taking into account the composition of Alloy 31 (section 2.1.), the contributions of other elements apart from Fe, Cr, Mo and Ni were not expected to be detected in surface layer, since their content in the alloy was low.
4. CONCLUSIONS
Passive current densities (ip) increased with temperature, since temperature also favours the anodic process and the presence of the aggressive ions accelerates the anodic dissolution, leading to the loss of passivity of Alloy 31. This fact was revealed on the transpassive potential (Etr), which decreased as solution temperature increases.
Finally, the Raman spectra of the pits showed that the corrosion products forming during the polarisation curves at 80 ºC were mainly Fe2O3 and Cr2O3. Moreover, phosphate species were also
incorporated into the passive film formed on Alloy 31. Ni and MoO3 were not detected by Raman
analysis.
ACKNOWLEDGEMENTS
Authors express their gratitude to the MAEC of Spain (PCI Mediterráneo C/8196/07, C/018046/08, D/023608/09 and D/030177/10), to Programa de Apoyo a la Investigación y Desarrollo de la UPV (PAID-06-09) and to the Generalitat Valenciana (GV/2011/093) for the financial support, to Ministerio de Ciencia e Innovación for its help in the Laser Raman Microscope acquisition (UPOV08-3E-012) and to Dra. Asunción Jaime for her translation assistance.
References
1. B. Lochel, H. H. Strehblow, M. Sakashita, J. Electrochem. Soc., 131 (1984) 522. 2. I.Sekine, H. Usui, S. Kitagawa, M. Yuasa, L. Silao, Corros. Sci., 36 (1994) 1411. 3. J. M. Bastidas, C. Fosca, B. Chico, E. Otero, Corros. Sci., 38 (1996) 559.
4. G. T. Burstein, B. T. Daymond, Corros. Sci., 51 (2009) 2249.
5. B. Jegdic, D. M. Drazic, J. P. Popic, J. Serb. Chem. Soc., 71 (2006) 543. 6. D. A. Jones, N. D. Greene, Corrosion, 22 (1966) 198.
7. K. S. Raja, D. A. Jones, Corros. Sci., 48 (2006) 1623.
8. B. Stypula, D. Kasprzyk, M. Hajos, Arch. Metall. Mater., 54 (2009) 305.
9. H. Iken, R. Basseguy, A. Guenbour, A. B. Bachir, Electrochim. Acta, 52 (2007) 2580.
10.A.Guenbour, M. A. Hajji, E. M. Jallouli, A. B. Bachir, Appl. Surf. Sci., 253 (2006) 2362-2366. 11.A.Bellaouchou, A. Guenbour, A. Benbachir, Bull. Electrochem., 16 (2000) 166.
12.C. Escrivà-Cerdán, E. Blasco-Tamarit, D. M. García-García, J. García-Antón, A. Guenbour, Corros. Sci., 56 (2012) 114.
13.M. C. Li, C. L. Zeng, H. C. Lin, C. N. Cao, Br. Corros. J., 36 (2001) 179. 14.J. M. Bastidas, C. Fosca, B. Chico, E. Otero, Mater. Corros., 48 (1997) 26.
15.Pierre Becker, Phosphates and phosphoric acid. Raw materials, technology, and economics of the wet process, M. Dekker, New York, 1989.
16.ASTM G-5. Test Method for Making Potentiostatic and Potentiodynamic Anodic Polarization Measurements. ASTM, (2004).
17.E. A. Abd El Meguid, A. A. Abd El Latif, Corros. Sci., 49 (2007) 263.
18.G. Lothongkum, S. Chaikittisilp, A. W. Lothongkum, Appl. Surf. Sci., 218 (2003) 203.
19.E. Blasco-Tamarit, A. Igual-Muñoz, J. García Antón, D. García-García, Corros. Sci., 50 (2008) 1848.
20.L. F. Garfias-Mesias, J. M. Sykes, Corros. Sci., 41 (1999) 959.
21.A.Igual Muñoz, J. García Antón, S. López Nuévalos, J. L. Guiñón, V. Pérez Herranz, Corros. Sci., 46 (2004) 2955.
23.A.Pardo, E. Otero, M. C. Merino, M. D. Lopez, M. V. Utrilla, F. Moreno, Corrosion, 56 (2000) 411.
24.D. H. Hur, Y. S. Park, Corrosion, 62 (2006) 745.
25.A.Igual-Muñoz, J. García-Antón, J. L. Guiñón, V. Pérez-Herranz, Corros. Sci., 48 (2006) 3349. 26.C. O. A. Olsson, D. Landolt, Electrochim. Acta, 48 (2003) 1093.
27.M. Ibáñez-Ferrándiz, M. Blasco-Tamarit, D. M. García-García, J. García-Antón, A. Guenbour, S. Bakour, A. Benckokroun, ECS Trans., 25 (2010) 49.
28.A.Guenbour, H. Iken, N. Kebkab, A. Bellaouchou, R. Boulif, A. B. Bachir, Appl. Surf. Sci., 252 (2006) 8710.
29.M. V. Cardoso, S. T. Amaral, E. M. A. Martini, Corros. Sci., 50 (2008) 2429. 30.S. Zor, M. Soncu, L. Aapan, J. Alloys Compd., 480 (2009) 885.
31.A.M. M. Ibrahim, S. S. Abd El Rehim, M. M. Hamza, Mater. Chem. Phys., 115 (2009) 80. 32.E. Blasco-Tamarit, D. M. García-García, J. García-Antón, Corros. Sci., 53 (2011) 784. 33.A.Neville, T. Hodgkiess, Corros. Sci., 38 (1996) 927.
34.M. Drogowska, H. Menard, L. Brossard, J. Appl. Electrochem., 26 (1996) 217. 35.M. Drogowska, L. Brossard, H. Menard, J. Appl. Electrochem., 28 (1998) 491. 36.H. Wang, J. A. Turner, J. Power Sources, 180 (2008) 803.
37.M. Reffass, R. Sabot, M. Jeannin, C. Berziou, P. Refait, Electrochim. Acta, 54 (2009) 4389. 38.S. R. Moraes, D. Huerta-Vilca, A. J. Motheo, Prog. Org. Coat., 48 (2003) 28.
39.H. Bouchemel, A. Benchettara, Mater. Chem. Phys., 115 (2009) 572.
40.R. Sánchez-Tovar, M. T. Montañés, J. García-Antón, Corros. Sci., 52 (2010) 722.
41.A.Pardo, M. C. Merino, A. E. Coy, F. Viejo, R. Arrabal, E. Matykina, Corros. Sci., 50 (2008) 1796.
42.H. H. Strehblow, Corrosion mechanisms in theory and practice, P.Marcus and J.Oudar, New York, (1995).
43.B. R. Tzaneva, L. B. Fachikov, R. G. Raicheff, Corros. Eng. Sci. Technol., 41 (2006) 62.
44.Pardo Gutierrez del Cid.A., Otero Huerta E., Merino Casals M.C., Lopez González M.D., Utrilla Esteban M.V., Rev. Metal. Madrid, 37 (2001) 499.
45.M. Bouchard, D. C. Smith, Spectrochim. Acta Part A, 59 (2003) 2247.
46.A.Srisrual, S. Coindeau, A. Galerie, J. P. Petit, Y. Wouters, Corros. Sci., 51 (2009) 562. 47.R. L. Frost, S. J. Palmer, Y. Xi, Spectrochim. Acta Part A, 82 (2011) 132.
48.Handbook of Chemistry and Phsics, CRC Press, Boca Raton, Florida, (1989). 49.S. Ramya, T. Anita, H. Shaikh, R. K. Dayal, Corros. Sci., 52 (2010) 2114. 50.X. Tian, R. K. Y. Fu, L. Wang, P. K. Chu, Mater. Sci. Eng. A, 316 (2001) 200. 51.B. Garke, C. Edelmann, R. Günzel, J. Brutscher, Surf. Coat. Technol., 93 (1997) 318.
52.E. Almeida, D. Pereira, M. O. Figueiredo, V. M. M. Lobo, M. Morcillo, Corros. Sci., 39 (1997) 1561.
53.M. Lakatos-Varsányi, F. Falkenberg, I. Olefjord, Electrochim. Acta, 43 (1998) 187.
54.A.Pardo, M. C. Merino, A. E. Coy, F. Viejo, R. Arrabal, E. Matykina, Corros. Sci., 50 (2008) 780.