3D structure of individual nanocrystals
in solution by electron microscopy
The Harvard community has made this
article openly available.
Please share
how
this access benefits you. Your story matters
Citation Park, J., H. Elmlund, P. Ercius, J. M. Yuk, D. T. Limmer, Q. Chen, K. Kim, et al. 2015. “3D Structure of Individual Nanocrystals in Solution by Electron Microscopy.” Science 349 (6245) (July 16): 290–295. doi:10.1126/science.aab1343.
Published Version 10.1126/science.aab1343
Citable link http://nrs.harvard.edu/urn-3:HUL.InstRepos:33758685 Terms of Use This article was downloaded from Harvard University’s DASH
repository, and is made available under the terms and conditions applicable to Other Posted Material, as set forth at http://
Submitted Manuscript: Confidential 12 March 2015
Title: 3D Structure of Individual Nanocrystals in Solution By
Electron Microscopy
Authors:
Jungwon Park† 1, 2, 3
, Hans Elmlund† 4, 5
, Peter Ercius†6
, Jong Min Yuk 7, 8, 9
, David T. Limmer 10
, Qian Chen 1, 8
, Kwanpyo Kim 11
, Sang Hoon Han 12
, David A. Weitz 2, 3
, A. Zettl 7, 8, 9
, and A. Paul Alivisatos 1, 8, 9
*
Affiliations:
1 Department of Chemistry, University of California, Berkeley, CA 94720, USA.
2 Department of Applied Physics, Harvard University, Cambridge, MA 02138, USA.
3 School of Engineering and Applied Sciences, Harvard University, Cambridge, MA 02138, USA.
4 Department of Biochemistry and Molecular Biology, School of Biomedical Sciences, Monash
University, Clayton, VIC 3800, Australia.
5 ARC Centre of Excellence for Advanced Molecular Imaging, Clayton, VIC 3800, Australia.
6 The Molecular Foundry, Lawrence Berkeley National Laboratory, Berkeley, CA 94720, USA.
7 Department of Physics, University of California, Berkeley, CA 94720, USA.
8 Materials Sciences Division, Lawrence Berkeley National Laboratory, Berkeley, CA 94720,
USA.
9 Kavli Energy NanoScience Institute, Berkeley, CA 94720, USA.
10 Princeton Center for Theoretical Science, Princeton University, Princeton, NJ 08540 USA.
11 Department of Physics, Ulsan National Institute of Science and Technology (UNIST), Ulsan
689-798, South Korea .
12 Amore-Pacific Co. R&D Center, Yongin 446-829, South Korea.
†These authors contributed equally to this paper.
Abstract:
Understanding structural details of colloidal nanoparticles is required to bridge our knowledge about their synthesis, growth mechanisms, and physical properties. We introduce a method for determining 3D structures of individual nanoparticles in solution. We combine a graphene liquid cell, high-resolution transmission electron microscopy, a direct electron detector, and an algorithm for single-particle 3D reconstruction originally developed for analysis of biological molecules to produce two near-atomic resolution 3D structures of individual Pt nanocrystals. Since our method derives the 3D structure from images of individual nanoparticles rotating freely in solution, it enables the analysis of heterogeneous populations of potentially unordered nanoparticles that are synthesized in solution, thereby providing a means to understand the structure and stability of defects at the nanoscale.
Main Text:
Electron tomography is routinely used for 3D analysis of materials (5–9). This method cannot be applied to individual particles in a liquid because it relies on acquisition of images of a single object at many different tilt angles over 2 to 5 hours, assuming the object is static during the entire acquisition. Single particle cryo-electron microscopy (cryo-EM) is a common method for the determination of 3D structures in biological sciences. The average 3D Coulomb potential map (density) of a protein is reconstructed from tens of thousands of TEM images of randomly oriented copies of the same protein embedded in vitreous ice (10). The unknown 3D projection angles of the images are determined by computational methods (11). Single-particle cryo-EM has succeeded in reconstructing biological molecules with nearly 3 Å resolution (10, 12). A similar approach was recently applied to reconstruct the atomic structure of homogeneous ultra-small gold clusters (13). However, the single-particle method is not readily applicable to 3D reconstruction of colloidal nanoparticles due to their intrinsic structural inhomogeneity at the atomic level.
TEM has undergone significant technical improvements in the past decades (5, 14–17). The image resolution has been improved with the introduction of electron lens aberration correctors (15). The development of direct electron detectors is providing a significant enhancement to single-particle cryo-EM due to improvements in image quality and rapid acquisition of movies that allow for the compensation for beam-induced specimen motion (18).
resolution of the rotating nanocrystals (18), and (3) a theory for ab initiosingle-particle 3D reconstruction used to solve the inverse problem of recovering the unknown 3D orientations of the individual noisy nanocrystal projections (11). The resulting hybrid technique called SINGLE (3D Structure Identification of Nanoparticles by Graphene Liquid Cell EM) was used to separately reconstruct the 3D structures of two individual Pt nanocrystals in solution.
Pt nanoparticles were chosen because of their high electron scattering strength, because their detailed atomic structure is important for catalysis, and because earlier graphene liquid cell studies have shown that they grow by nanoparticle aggregation, resulting in complex structures that are not possible to determine by any previously developed method. Pt nanocrystals with sub-2 nm diameter were prepared in solution. Two graphene sheets were grown by the chemical vapor deposition method and used to entrap solvated nanocrystals (3). The graphene provides an ultra-thin covering of material to maintain liquid conditions in the TEM vacuum and presents an inert surface onto which the nanoparticles do not adsorb. The translational and rotational motions of the particles in liquid pockets with sub-50 nm diameter were imaged in situ using TEAM I, a TEM instrument with geometrical and chromatic aberration-correction, operated at 300 kV using a direct electron detector (see schematic illustration in Fig. 1 (A)). The corrector was set to apply a slightly negative spherical aberration coefficient of about -10 μm. Under these imaging conditions, we produced white atom contrast when using a small under-focus value of 30 – 50 Å.
a single rotating particle were recovered computationally using an ab initio 3D reconstruction algorithm adapted from one originally developed to recover orientations from cryo-EM images of many identical individual particles (11).
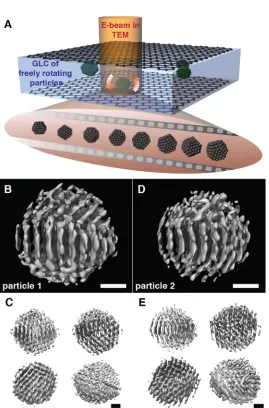
Although the TEM movies contain many particles, not all particles could be used for reconstruction due to overlap with other particles and insufficient rotation. Here, we present the two most reliable 3D reconstructions from a 1561 image series (particle 1 in Fig. 1 (B), (C), and Movie S1) and a 1171 image series (particle 2 in Fig. (D), (E), and Movie S2). Fig. 1 (B) to (E) show the EM density maps of the two Pt nanocrystals. The rendered particle volumes/diameters are 5,300 Å3
/22 Å (particle 1) and 4,800 Å3
/20 Å (particle 2). Along with the direct visualization of the spatial distribution of Pt atomic-planes, external and internal structures of the particle are uncovered. Each reconstruction shows three distinct crystal domains in both of the Pt particles. In Fig. 1 (B) and (D), we show views of the EM maps in an orientation that reveals distinct lattice planes of the core domain. Differently oriented 3D density maps are shown in Fig. 1 (C), (E), Movie S1, and Movie S2.
Our 3D reconstruction methodology produced near-atomic resolution reconstructions from relatively small sets of noisy experimental TEM images of nanocrystals in random orientations. We tested the validity of SINGLE using 1000 multislice TEM simulations of a randomly oriented Pt nanocrystal with dodecahedral symmetry and corresponding size. A near-atomic resolution reconstruction was obtained from images with a signal-to-noise ratio (SNR) roughly corresponding to that of the experimental images (see Fig. S1). This verified that the experimental images can conform to the projection-slice theorem with ideal microscope conditions (20).
coverage throughout the image series revealed that each particle continuously undergoes small local rotations followed by rapid orientation changes, often accompanied by lateral movement. The noise variance in the individual frames of the movie exceeds the signal variance approximately fivefold, despite the strong scattering from the heavy Pt atoms (Movie S3 and S4 show 200 raw TEM images). Although sufficiently thin to observe atomic detail, the liquid between the graphene sheets introduces a granular background, making it difficult to distinguish the facets of the nanocrystal in the individual frames. To enhance the image contrast and allow accurate 3D orientation determination, we averaged the image series in sets of five consecutive frames, resulting in a time resolution of ~100 ms. After frame averaging, we carefully scanned the image series to remove a small fraction (~ 20 %) of those averages that did not show any lattice contrast because the particles had moved out of the narrow ideal focal plane of the aberration corrected microscope.
To initialize the 3D reconstruction process, we assigned the random orientations to images, producing a feature-less spherical density map. The random orientations were refined by stochastic optimization of the correlation between the images and re-projections of the density map, using information from 30 Å to 3 Å and a discrete search space of orientations. The resulting initial model had a resolution of 2.5 Å according to the 0.143 Fourier shell correlation (FSC) criterion (21). We extended the PRIME algorithm by introducing a continuous orientation search space and used stochastic optimization to determine a continuous distribution of weights that related the continuous distribution of orientation parameters to the 3D reconstruction. Each round of the PRIME iterative alignment procedure involved determination of orientation weights for all particle images, followed by a weighted 3D reconstruction by direct Fourier reconstruction using a Kaiser-Bessel interpolation kernel. A few hundred iterations were executed, and in every round the FSC was calculated and used to construct a 3D Wiener filter that filters the map such that the optimal SNR is obtained at the current resolution (22). The resolution of the final refined maps was measured to 2.10 Å (particle 1) and 2.14 Å (particle 2), respectively.
larger number of frames, indicating that the current resolution can be improved by acquisition of longer movies that cover a wider range of rotational orientations.
We had anticipated that the Pt nanocrystals would have at least two-fold rotational symmetry, perhaps even cubic symmetry. Remarkably, the reconstructions appeared asymmetrical and attempts to apply C2, C4, C5, and D2 point-group symmetry by aligning the images to the principal symmetry axis and doing symmetric orientation refinement failed to improve the correlation between the re-projections and the images. This suggests that the Pt nanocrystals do not possess icosahedral, cubic, or pentagonal symmetry but are intrinsically asymmetrical. Reconstruction by the traditional single-particle cryo-EM technique, using an initial model based on a faceted face-centered-cubic (FCC) nanoparticle, would suffer severe initial model bias and would not reproduce the true asymmetrical multi-domain structure.
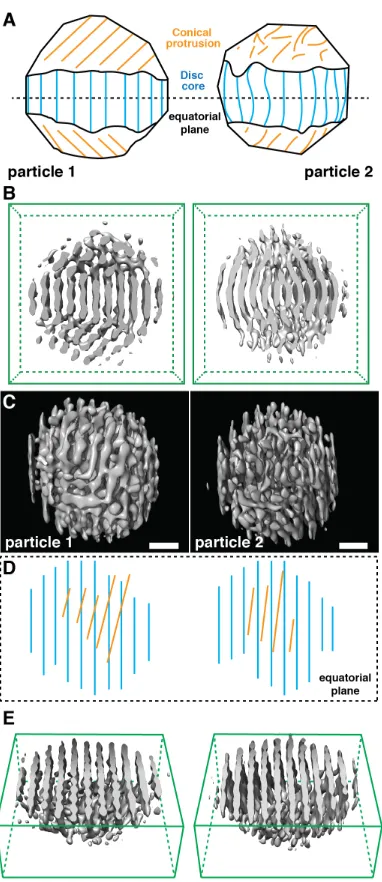
reconstructions perpendicular to the equatorial plane (Fig. 2 (C)) and a schematic illustration (Fig. 2 (D)) show the overlaid lattices of the core (blue lines) and protrusions (yellow lines) with different tilting angle for particle 1 (14O
) and 2 (7O
). The cross-sectional views along the equatorial plane (Fig. 2 (E)) for particle 1 and 2 show similar arrangements of the {111} lattice planes, but cross-sectional images along the horizontal planes below and above the equatorial plane for the two particles (particle 1 in Fig.3 (C), (D), and (E) and particle 2 in Fig. S5) indicate the two particles are assembled by multiple domains but in unique geometries. The multiple domains and twisted grain boundaries that are present in the reconstructions are similar to previous observations of Pt nanocrystal growth trajectories, where small particles joined along surfaces with low ligand coverage (3). The multi-domain arrangement is also supported by other tomography reconstructions of larger Pt nanocrystals containing multiply twinned domains with decahedral symmetry and central screw dislocations (3, 5). Multi-domain structures are common in many other colloidal metal nanoparticles, which likely evolve due to multiple coalescence events during growth (3, 24–26). Our observation of heterogeneously structured Pt nanoparticles formed in the same solution confirms that individual particles from the same synthesis follow different nucleation and growth trajectories.
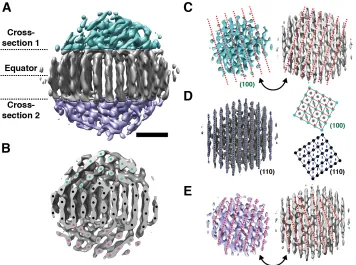
cross-sections along horizontal planes named cross-section 1, equator, and cross-section 2 are indicated in Fig. 3 (A). Cross-sections 1 and 2 are positioned near the interface between the central disk and the upper/lower conical protrusions, respectively. Cross-section 1 exposes two facing surfaces from the upper and core domains (blue and gray densities in Fig. 3 (C), respectively). Cross-section 1 shows a (100) surface with red dashed lines that trace the {111} planes exposed on the (100) surface. The cross-section at the equator (Fig. 3 (D)) exhibits a (110) surface, and blue dashed lines indicate the {111} planes exposed to the (110) surface. The red and blue lines are mapped onto the pseudo-atomic illustration of (100) and (110) surfaces with the proper orientation (a 14O
rotation angle) in the right image of Fig. 3 (D). At cross-section 2, near the interface between the central disk and the lower conical protrusion, a surface structure with pseudo (100) patterns traced by red dotted lines is exposed from the core and lower domains (gray and purple densities in Fig. 3 (E), respectively), which deviate from the ideal FCC structure. Fig. 3 shows that the conical protrusions and the core join along (100) and (110) surfaces with distortions at the interface. Multiple domains merging along the low index crystal planes, such as (100) and (110), are presumably formed by coalescence events between small particles during the particle growth as a route to minimize excess surface energy. We have previously observed a similar scenario: two small Pt particles join along the (111) surfaces during growth (3). Presumably, coalescence along the low index surfaces and the following evolution of the interface structure are mechanisms by which the nanocrystals reduce free energy.
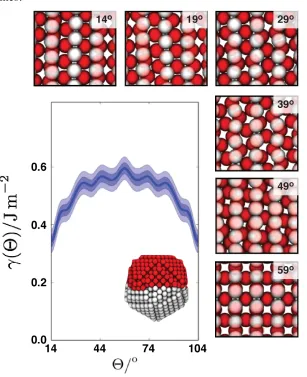
To examine whether there is a thermodynamic rationale for the multi-domain structures that we observed, we computed the free energies for the grain boundary formation and for the ligand exposed surfaces. This was done using the Frenkel-Ladd method (27) for an embedded atom model of Pt (28), using an appropriate thermodynamics integration path (Fig. S6). We found that for low-angle-misalignments, like those observed in particle 1 (14O
nanoparticle with N = 1200 atoms is 0.3 J/m2
, and increases to 0.55 J/m2
for misalignment angles of up to 59o
(Fig. 4). Small rotational relaxation of the crystal grains is found to be energetically viable these interfaces, which may explain the orientation of the side protrusions in particle 1 with respect to its central section.
The surface free energy for the ligand-exposed interfaces was computed to be 2.8 J/m2 as
averaged over the (100) and (111) surfaces, weighted appropriately for the cuboctahedral shape. The disparity of scales between the grain boundary free energies and the much larger exposed surface free energies confirms that there is a large thermodynamic driving force for coalescence, even when such events result in grain boundary formation. As the free energy gain upon coalescence is much larger than thermal energies, initial aggregations is likely irreversible. The resultant grain boundaries are then kinetically arrested over laboratory time scales (additional information is found in Supplementary Materials).
Figures:
Fig. 1. Schematic illustration of in situ TEM imaging of Pt nanocrystals freely rotating in a graphene liquid cell (GLC) and3D EM density maps calculated from individual Pt nanoparticles in solution. (A) A movie of the single rotating Pt nanocrystal provides 2D projected TEM still snapshots in many orientations for ab initio particle reconstruction.
Fig. 2. The underlying structural principle of the small Pt nanoparticles studied here. (A)
of the top view of particle 1 and 2 shown in (C). (E) Cross-sectional view of the EM density map of particles 1 and 2 along the equatorial plane.
Fig. 3. Cross-sectional study of particle 1. (A) 3D density map of particle 1 with color coding to highlight the three sections. Cross-section 1 and 2 are in arbitrary positions near crystal domain interfaces. Scale bar represents 0.5 nm. (B) Slab through the 3D reconstruction of particle 1 along the vertical plane with tentative atomic positions indicated. ABC repeats of {111} planes are visible. (C) Slab along cross-section 1. The exposed (100) surface of the FCC Pt crystal is shown consistently in both exposed surfaces. Intersections with {111} planes in the top domain are displayed by red dashed lines. (D) Slab along the equatorial plane of (A) exposes a (110) plane. The intersections with {111} planes are shown by blue dashed lines. Pseudo-atomic structure (right) demonstrates the rotation angle (14O
[image:16.612.92.448.162.427.2]Intersections with pseudo {111} planes in the bottom domain are displayed by red dashed lines.
Fig. 4. Twist grain boundary free energies as a function of misalignment angle for the (110)-(100) crystal planes of a 𝑁 = 1135 atom nanocrystal. Shaded regions indicate error bars of 1 and 2 standard deviations. The inset shows a relaxed nanocrystal with an initial misalignment angle of 14o
[image:17.612.94.401.121.498.2]References and notes:
1. D. Mocatta et al., Heavily doped semiconductor nanocrystal quantum dots.
Science. 332, 77–81 (2011).
2. H. Zhang, T. Watanabe, M. Okumura, M. Haruta, N. Toshima, Catalytically highly active top gold atom on palladium nanocluster. Nat. Mater.11, 49–52 (2012). 3. J. M. Yuk et al., High-resolution EM of colloidal nanocrystal growth using
graphene liquid cells. Science. 336, 61–64 (2012).
4. H. Zheng et al., Observation of single colloidal platinum nanocrystal growth trajectories. Science. 324, 1309–1312 (2009).
5. C.-C. Chen et al., Three-dimensional imaging of dislocations in a nanoparticle at atomic resolution. Nature. 496, 74–77 (2013).
6. P. A. Midgley, R. E. Dunin-Borkowski, Electron tomography and holography in materials science. Nat. Mater.8, 271–280 (2009).
7. P. A. Midgley, M. Weyland, 3D electron microscopy in the physical sciences: the development of Z-contrast and EFTEM tomography. Ultramicroscopy. 96, 413– 431 (2003).
8. C. Zhu et al., Towards three-dimensional structural determination of amorphous materials at atomic resolution. Phys. Rev. B. 88, 100201 (2013).
9. S. Van Aert, K. J. Batenburg, M. D. Rossell, R. Erni, G. Van Tendeloo, Three-dimensional atomic imaging of crystalline nanoparticles. Nature. 470, 374–377 (2011).
10. Y. Cheng, T. Walz, The advent of near-atomic resolution in single-particle electron microscopy. Annu. Rev. Biochem.78, 723–742 (2009).
11. H. Elmlund, D. Elmlund, S. Bengio, PRIME: probabilistic initial 3D model generation for single-particle cryo-electron microscopy. Structure. 21, 1299–1306 (2013).
13. M. Azubel et al., Electron microscopy of gold nanoparticles at atomic resolution.
Science. 345, 909–912 (2014).
14. B. Goris et al., Atomic-scale determination of surface facets in gold nanorods. Nat. Mater.11, 930–935 (2012).
15. M. C. Scott et al., Electron tomography at 2.4-ångström resolution. Nature. 483, 444–447 (2012).
16. A. Leis, B. Rockel, L. Andrees, W. Baumeister, Visualizing cells at the nanoscale.
Trends Biochem. Sci.34, 60–70 (2009).
17. C. V Robinson, A. Sali, W. Baumeister, The molecular sociology of the cell.
Nature. 450, 973–982 (2007).
18. M. Battaglia et al., A rad-hard CMOS active pixel sensor for electron microscopy.
Nucl. Instruments Methods Phys. Res. Sect. A Accel. Spectrometers, Detect. Assoc. Equip.598, 642–649 (2009).
19. Q. Chen et al., 3D motion of DNA-Au nanoconjugates in graphene liquid cell electron microscopy. Nano Lett.13, 4556–4561 (2013).
20. B. N., Strip integration in radio astronomy. Aust. J. Phys.9, 198–217 (1956). 21. M. Van Heel, M. Schatz, Fourier shell correlation threshold criteria. J. Struct. Biol.
151, 250–262 (2005).
22. P. B. Rosenthal, R. Henderson, Optimal determination of particle orientation, absolute hand, and contrast loss in single-particle electron cryomicroscopy. J. Mol. Biol.333, 721–745 (2003).
23. W. O. Saxton, W. Baumeister, The correlation averaging of a regularly arranged bacterial cell envelope protein. J. Microsc.127, 127–138 (1982).
24. M. Takesue, T. Tomura, M. Yamada, Size of elementary clusters and process period in silver nanoparticle formation. J. Am. Chem. Soc.133, 14164–14167 (2011).
26. J. Polte et al., Nucleation and Growth of Gold Nanoparticles Studied via in situ Small Angle X-ray Scattering at Millisecond Time Resolution. ACS Nano. 4, 1076–1082 (2010).
27. D. Frenkel, A. J. C. Ladd, New Monte Carlo method to compute the free energy of arbitrary solids. Application to the fcc and hcp phases of hard spheres. J. Chem. Phys.81, 3188–3193 (1984).
28. H. W. Sheng, M. J. Kramer, A. Cadien, T. Fujita, M. W. Chen, Highly optimized embedded-atom-method potentials for fourteen FCC metals. Phys. Rev. B. 83, 134118 (2011).
29. D. Wolf, Correlation between energy and volume expansion for grain boundaries in FCC metals. Scr. Metall.23, 1913–1918 (1989).
30. H.-G. Liao et al., Facet development during platinum nanocube growth. Science.
345, 916–919 (2014).
31. A. Gómez-Rodríguez, L. M. Beltrán-del-Río, R. Herrera-Becerra, SimulaTEM: Multislice simulations for general objects. Ultramicroscopy. 110, 95–104 (2010). 32. E. G. Castro, R. V. Salvatierra, W. H. Schreiner, M. M. Oliveira, A. J. G. Zarbin, Dodecanethiol-stabilized platinum nanoparticles obtained by a two-phase method: Synthesis, characterization, mechanism of formation, and electrocatalytic
properties. Chem. Mater.22, 360–370 (2010).
33. W. Regan et al., A direct transfer of layer-area graphene. Appl. Phys. Lett.96, 113102 (2010).
34. P. Ercius, M. Boese, T. Duden, U. Dahmen, Operation of TEAM I in a User Environment at NCEM. Microsc. Microanal.18, 676–683 (2012).
35. E. Ringe, R. P. Van Duyne, L. D. Marks, Wulff construction for alloy nanoparticles. Nano Lett.11, 3399–3403 (2011).
36. M. S. Daw, S. M. Foiles, M. I. Baskes, The embedded-atom method: a review of theory and applications. Mater. Sci. Reports. 9, 251–310 (1993).
37. G. Weihs, T. Jennewein, C. Simon, H. Weinfurter, A. Zeilinger, Optimized Free-Energy Evaluation Using a Single Reversible-Scaling Simulation. Phys. Rev. Lett.
38. D. Wolf, Effect of interatomic potential on the calculated energy and structure of high-angle coincident site grain boundaries—I. (100) twist boundaries in
aluminum. Acta Metall.32, 245–268 (1984).
Acknowledgment:
Supplementary Materials:
Captions for Movies S1 to S4 Molecular Dynamics Simulation Materials and Methods
![Carrefours Newsletter [Forward Studies Unit] December 1996 No 4](data:image/gif;base64,R0lGODlhAQABAIAAAP///wAAACH5BAEAAAAALAAAAAABAAEAAAICRAEAOw==)