Absolute Properties of the
Low-Mass Eclipsing Binary CM Draconis
The Harvard community has made this
article openly available.
Please share
how
this access benefits you. Your story matters
Citation
Morales, Juan Carlos, Ignasi Ribas, Carme Jordi, Guillermo Torres,
Jose Gallardo, Edward F. Guinan, David Charbonneau, et al. 2009.
Absolute properties of the low-mass eclipsing binary CM Draconis.
Astrophysical Journal 691(2): 1400-1411.
Published Version
doi:10.1088/0004-637X/691/2/1400
Citable link
http://nrs.harvard.edu/urn-3:HUL.InstRepos:4341698
Absolute properties of the low-mass eclipsing binary CM Draconis
Juan Carlos Morales
1, Ignasi Ribas
1,2, Carme Jordi
1,3, Guillermo Torres
4, Jos´e Gallardo
5,
Edward F. Guinan
6, David Charbonneau
4, Marek Wolf
7, David W. Latham
4, Guillem
Anglada-Escud´e
8, David H. Bradstreet
9, Mark E. Everett
10, Francis T. O’Donovan
11,
Georgi Mandushev
12and Robert D. Mathieu
13Accepted for publication October 3rd, 2008
ABSTRACT
Spectroscopic and eclipsing binary systems offer the best means for determining accurate physical properties of stars, including their masses and radii. The data available for low-mass stars have yielded firm evidence that stellar structure models predict smaller radii and higher effective temperatures than observed, but the number of systems with detailed analyses is still small. In this paper we present a complete reanalysis of one of such eclipsing systems, CM Dra, composed of two dM4.5 stars. New and existing light curves as well as a radial velocity curve are modeled to measure the physical properties of both components. The masses and radii determined for the components of CM Dra are M1 = 0.2310±0.0009 M⊙, M2 = 0.2141±0.0010 M⊙,
R1= 0.2534±0.0019 R⊙, andR2= 0.2396±0.0015 R⊙. With relative uncertainties well below
the 1% level, these values constitute the most accurate properties to date for fully convective stars. This makes CM Dra a valuable benchmark for testing theoretical models. In comparing our measurements with theory, we confirm the discrepancies reported previously for other low-mass eclipsing binaries. These discrepancies seem likely to be due to the effects of magnetic activity. We find that the orbit of this system is slightly eccentric, and we have made use of eclipse timings spanning three decades to infer the apsidal motion and other related properties.
Subject headings: binaries: eclipsing — binaries: spectroscopic — stars: late-type — stars: fundamental
parameters — stars: individual: CM Dra
1
Institut d’Estudis Espacials de Catalunya (IEEC), Edif. Nexus, C/Gran Capit`a 2-4, 08034 Barcelona, Spain; [email protected]
2
Institut de Ci`encies de l’Espai (CSIC), Campus UAB, Facultat de Ci`encies, Torre C5 - parell - 2a planta, 08193 Bellaterra, Spain
3Departament d’Astronomia i Meteorologia, Institut de
Ci`encies del Cosmos, Universitat de Barcelona, C/ Mart´ı i Franqu`es 1, 08028 Barcelona, Spain
4
Harvard-Smithsonian Center for Astrophysics, 60 Gar-den St., Cambridge, MA 02138, USA
5
Departamento de Astronom´ıa, Universidad de Chile, Casilla 36-D, Santiago, Chile
6Department of Astronomy and Astrophysics, Villanova
University, PA 19085, USA
7
Astronomical Institute, Charles University, CZ-180 00 Praha 8, Czech Republic
8
Carnegie Institution of Washington, 5241 Broad Branch Road NW, Washington DC, 20015, USA
9Department of Astronomy and Physics, Eastern
Col-1. Introduction
Late-type stars are the most common objects in the Galaxy, yet their fundamental properties are still not well understood, in part because their accurate measurement is challenging. Double-lined eclipsing binary systems (hereafter EBs)
lege, St. Davids, PA 19087, USA
10
Planetary Science Institute, 1700 E. Fort Lowell Rd., Suite 106, Tucson, AZ 85719, USA
11
NASA Postdoctoral Program Fellow, Goddard Space Flight Center, 8800 Greenbelt Rd Code 690.3, Greenbelt, MD 20771, USA
12
Lowell Observatory, 1400 West Mars Hill Road, Flagstaff, AZ 86001, USA
13
have proven to be the best source of accurate properties for low-mass stars, and a number of those systems have already been studied in de-tail (see Ribas 2006 for a review). These anal-yses have revealed that low-mass stars in EBs have radii that are∼10% larger and effective tem-peratures that are ∼5% cooler than the predic-tions of stellar structure models. On the other hand, their luminosities seem to agree well with model calculations. These discrepancies have been attributed to the effects of magnetic activ-ity on the component stars (e.g., Torres & Ribas 2002; L´opez-Morales & Ribas 2005; Torres et al. 2006; L´opez-Morales 2007; Morales et al. 2008; Ribas et al. 2008). Additional systems with ac-curately known stellar properties that cover the entire range of sub-solar masses are needed to bet-ter constrain the differences between models and observations.
CM Draconis (hereafter CM Dra, GJ 630.1A,
αJ2000.0 = 16h34m20.s35,δJ2000.0 = +57◦09′44.′′7)
is a V = 12.9 mag EB system at a distance of 14.5 pc from the Sun, which forms a common proper motion pair with aV = 15 mag white dwarf (GJ 630.1B, αJ2000.0 = 16h34m21.s57, δJ2000.0 =
+57◦10′09.′′0) at a separation of∼26 arcsec. This
common proper motion pair moves at a relatively large angular speed of roughly 2 arcsec per year, which may be indicative of Population II mem-bership. Because of this, it has been considered a useful system for estimating the primordial helium abundance of the Universe through the detailed study of its components (Paczy´nski & Sienkiewicz 1984).
CM Dra was first investigated spectroscopically and photometrically by Lacy (1977), and more recently by Metcalfe et al. (1996). Both studies indicate the system is composed of two similar dM4.5 stars with masses of about 0.23 and 0.21 M⊙, orbiting each other with a period of 1.27 days.
Viti et al. (1997, 2002) estimated a metallicity of
−1.0 < [M/H] < −0.6 for the system, and in-ferred an effective temperature of 3000 < Teff <
3200 K. In this paper we describe new observa-tions of this binary that add significantly to the body of existing measurements. The unique posi-tion of CM Dra as the best known binary system composed of fully convective stars makes it ex-ceptionally important for testing models of such objects, and fully justifies a reanalysis in the light
of our new observations.
An important feature of this system is that, un-like other well-known low-mass EBs, its orbit has a small but measurable eccentricity. The precise measurement of eclipse timings over a sufficiently long period can thus potentially lead to the detec-tion of apsidal modetec-tion. The rate of this modetec-tion can be used to infer the internal structure constantk2
(Kopal 1978; Claret & Gim´enez 1993), with which further tests of the models are possible. In addi-tion, the investigation of the times of eclipse can also reveal the presence of third bodies in the sys-tem through the light-time effect. Atsys-tempts to detect planets around CM Dra in this way have been carried out in the context of the Transit of Extrasolar Planets Project (TEP, Deeg et al. 1998, 2000; Doyle et al. 2000; Deeg et al. 2008), although no compelling evidence of such objects has been found as yet.
In this paper we present a thorough reanalysis of CM Dra to determine the fundamental proper-ties of its components, including the masses, radii and effective temperatures. Additionally, we have measured the rate of advance of the line of ap-sides, which turns out to be dominated by the General Relativity contribution. In the following we describe first all available photometric and ra-dial velocity measurements. A combined analysis of all the information using the Wilson-Devinney code (hereafter WD, Wilson & Devinney 1971) is discussed in §3, and in§4 the times of minimum are used to estimate the apsidal motion. The ab-solute properties of each component and the age and metallicity of the system are derived in §5, and compared with stellar model predictions in
§6. Finally, we summarize our conclusions in§7.
2. Time-series data for CM Dra
2.1. Light curves
Table 1: DifferentialR- andI-band photometry for CM Dra from FCAPT. Dates are given in helio-centric Julian days on the TT time scale (HJED). The full version is available electronically.
HJED ∆R HJED ∆I
2450172.99766 0.0243 2450172.99780 0.0651 2450173.00000 0.0525 2450173.00015 0.0712 2450173.00182 0.0297 2450173.00197 0.0604 2450174.99836 0.0553 2450175.00271 0.0589 2450175.00065 0.0711 2450175.96655 0.0513 2450175.00257 0.0516 2450175.96882 0.0734 2450175.96641 0.0036 2450175.97067 0.0569 2450175.97052 0.0033 2450176.93331 0.0566 2450176.93317 0.0230 2450176.93516 0.0612 2450176.93502 0.0425 2450181.93217 0.0727
335 nights. The photometry was typically con-ducted using the Cousins R and I filters. The pri-mary comparison and check stars were HD 238580 and HD 238573, respectively. Integration times of 20-sec were used and the typical precision of the delta-R and -I band measures was 0.014 mag and 0.011 mag, respectively. The relatively large un-certainties arise mainly from the faintness of the CM Dra and uncertainties in centering the vari-able star using blind-offsets (rather than direct ac-quires).
An additional light curve in the r-band was gathered with the Sleuth telescope located at the Palomar Observatory in southern Califor-nia. Sleuth was one of three telescopes that together made up the Trans-atlantic Exoplanet Survey (TrES), and its primary use was to dis-cover transiting planets orbiting stars brighter than V = 13 (e.g., O’Donovan et al. 2006a, 2007; Mandushev et al. 2007). Sleuth consists of a lens with a physical aperture of 10 cm that images a field of view of size 5.7 degrees-square onto a thinned, back-illuminated CCD with 2048×2048 pixels, corresponding to a plate scale of 10 arc-seconds per pixel. From UT 2004 March 29 to UT 2004 June 6, Sleuth observed (as part of its survey for transiting planets) a field centered on the guide star HD 151613, and this field fortu-itously contained our target CM Dra. Whenever weather permitted operation, the telescope gath-ered exposures in r-band with an exposure time
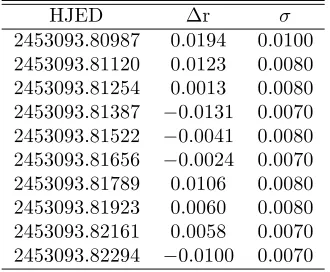
Table 2: Differential r-band photometry for CM Dra from Sleuth. The full version is available electronically.
HJED ∆r σ
2453093.80987 0.0194 0.0100 2453093.81120 0.0123 0.0080 2453093.81254 0.0013 0.0080 2453093.81387 −0.0131 0.0070 2453093.81522 −0.0041 0.0080 2453093.81656 −0.0024 0.0070 2453093.81789 0.0106 0.0080 2453093.81923 0.0060 0.0080 2453093.82161 0.0058 0.0070 2453093.82294 −0.0100 0.0070
of 90 s and a CCD readout time of 27 s, for a cadence of 117 s. We used a photometric aperture of radius 30 arcseconds (3 pixels) to produce the differential photometric time series listed in Table 2 and shown in Fig. 3. The calibration of TrES images, the extraction of the differential photo-metric time series (based on image subtraction methods), and the decorrelation of the resulting light curves is described elsewhere (Dunham et al. 2004; Mandushev et al. 2005; O’Donovan et al. 2006b). The FCAPT and Sleuth data are col-lected in Table 1 and Table 2.
Collectively these light curves cover the observ-ing seasons 1975, 1996–2001, and 2004, and add up to more than 20000 individual measurements. The short orbital period of CM Dra, along with its possibly old age (see below), make it very likely that tidal interactions have forced its components to rotate synchronously with the orbital motion. Thus, although the stars are fully convective, it is not surprising that they show a high level of chro-mospheric activity as indicated, for instance, by the presence of flares (e.g., Eggen & Sandage 1967; Lacy et al. 1976; Nelson & Caton 2007). Surface features (spots) are also conspicuously present and are responsible for modulations in the light curves that change from season to season. This compli-cates the analysis significantly. Prior to combining the different data sets, it is therefore necessary to correct the light curves for these distortions. Ad-ditionally, the large proper motion of CM Dra on the sky is such that the system is approaching an
[image:4.612.336.501.150.286.2]Fig. 1.— POSS-II DSS2 image in the R band showing the position of CM Dra at epoch 1991.5 and its proper motion on the sky. The common proper motion white dwarf companion is labeled “WD”. Tick marks on the path of CM Dra are given in steps of 10 years from 1970 to 2010. North is up and East is left.
Because different photometric apertures have been used to obtain the measurements, the proximity of this star implies that the light curves from dif-ferent instruments may be affected to difdif-ferent de-grees by third light. This contamination must also be removed before the data can be combined.
The correction for these spot effects and third light contribution was performed by carrying out preliminary fits to the light curves in each individ-ual data set using the WD code. This program as-sumes a relatively simple spot model in which the features are circular and uniform. Nevertheless it is adequate as a first-order description. FCAPT
R- and I-band data from the same season were used simultaneously. In the absence of spots, the model parameters in these fits that depend only on light curves are the eccentricity (e), the initial argument of the periastron (ω), the inclination an-gle (i), the temperature ratio (Teff,2/Teff,1, where
subindex 2 indicates the less massive component), the surface pseudo-potentials (Ωi), which are
re-lated to the relative radii (ri), and the
passband-specific luminosity ratio (L2
L1). Properties that rely
on the radial velocities, i.e., the semimajor axis
(a), the mass ratio (M2/M1) and the systemic
radial velocity (γ), were held fixed at the values given by Metcalfe et al. (1996). Limb darkening coefficients for these WD runs were computed for the standard CousinsRandIbands implemented in the code to account for possible corrections of these coefficients according to stellar properties at each iteration. The stellar atmosphere files in our WD implementation do not consider the Sloan r
band. Therefore, we carried out a number of tests to check the adequacy of assuming CousinsRband for the Sleuth light curve. We did so by consider-ing solutions incorporatconsider-ing the differential in the limb darkening coefficients between the CousinsR
band and the Sloanr′ band (compatible to Sloan
r) calculated from Claret (2004). No significant effects were found, owing to the fact that the light curve shape is quite insensitive to small variations in the darkening coefficients in the red bands.
The spot properties that can be solved for us-ing the WD code are their angular radius (rs),
the longitude (φs), latitude (θs), and
tempera-ture contrast relative to the photosphere (Ts/Teff,
where Ts represents the spot temperature).
Be-cause θs, rs, and Ts/Teff are strongly correlated
and can usually not be determined all at once, the procedure to fit the spots was carried out by iterations. We first computed solutions with vari-ableφsandrsfor several fixed values ofθs, trying
both dark and bright spots with moderate temper-ature ratios. Several scenarios with spots on one or both components were tested. Upon reaching convergence, we fixed the values of φs andrs and
solved for θs and Ts/Teff. In cases where
conver-gence was not reached, we selected the fits with fixed values ofθsandTs/Teff yielding the smallest
residuals. In all of these fits third light (ℓ3) was
considered as a free parameter as well. The solu-tions for the spot parameters and third light that give the smallest residuals are shown in Table 3. As seen, the spot configurations change somewhat from season to season, providing some evidence of either redistribution of the features or appear-ances and disappearappear-ances. Third light is also seen to vary from data set to data set for the reasons indicated above. In particular, the much larger value for the Sleuth data reflects the large pixel scale of that instrument, which makes contamina-tion by neighboring stars more likely.
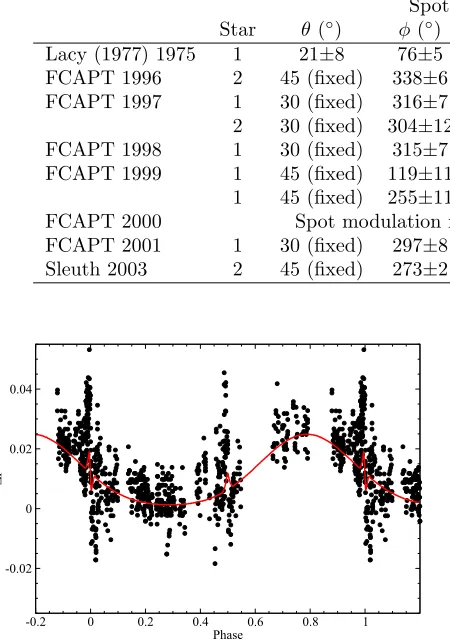
Table 3: Spot and third light parameters from fits to the light curves in each season. Third light is given as the percentage of the total light coming from the system at phase 0.25. Parameters labeled as fixed were obtained from the trial fits giving the best residuals.
Spots ℓ3 (%)
Star θ(◦) φ(◦) r
s (◦) Ts/Teff R band I band
Lacy (1977) 1975 1 21±8 76±5 42±3 0.94±0.02 – 1.3±0.8
FCAPT 1996 2 45 (fixed) 338±6 13±1 1.09 (fixed) 4.1±1.2 2.3±1.2 FCAPT 1997 1 30 (fixed) 316±7 32±6 0.96 (fixed) 3.4±1.2 3.0±1.2
2 30 (fixed) 304±12 12±5 1.09 (fixed)
FCAPT 1998 1 30 (fixed) 315±7 40±2 0.96 (fixed) 4.4±0.8 3.3±0.8 FCAPT 1999 1 45 (fixed) 119±11 15±3 1.09 (fixed) 4.8 (fixed) 2.9 (fixed)
1 45 (fixed) 255±11 19±7 0.96 (fixed)
FCAPT 2000 Spot modulation not significant 5.5±1.7 3.6±1.7
FCAPT 2001 1 30 (fixed) 297±8 23±3 1.09 (fixed) 1.4±1.7 1.6±1.7 Sleuth 2003 2 45 (fixed) 273±2 32±1 0.96 (fixed) 12.3±0.9 –
-0.2 0 0.2 0.4 0.6 0.8 1
Phase -0.02
0 0.02 0.04
∆
I
Fig. 2.— Differential effect of star spots on the
I-band light curve of Lacy (1977). The solid line represents the model described in the text.
season were computed from the difference between the theoretical curves from these full fits and syn-thetic curves calculated with the same geometric and radiative parameters but with no spots and no third light. We then subtracted these effects from the original data. As an example, Fig. 2 shows the differential effect of the spots for the light curve of Lacy (1977).
With these transitory effects removed, the pho-tometric data can be combined more easily for analysis with WD. For practical reasons, we found it convenient to bin the large number of original data points in order to reduce the computing time for the light curve solutions. The relevant
infor-mation resides almost completely in the eclipse phases (it depends mostly on their detailed shape) so that averaging outside of eclipse has essentially no impact on the results. We therefore averaged the observations outside of eclipse from the same instruments into bins of 0.04 in phase. This pro-cedure was applied to the FCAPT observations and the Sleuth observations. The total number of points used in the solutions is 5356. Unit weight was assigned to observations that have no reported errors, as is the case for the FCAPT data and also Lacy (1977), whereas individual weights were used for the Sleuth observations, for which internal er-rors are available. For the out-of-eclipse averages from FCAPT and Sleuth we adopted as weights the number of combined points and the reciprocal of the standard deviation squared, respectively.
2.2. Radial velocity data
For the present study we have made use of the same spectroscopic material discussed by Metcalfe et al. (1996), obtained over a period of nearly 5 years with an echelle spectrograph on the 1.5m Tillinghast reflector at the F. L. Whipple Observatory (Mount Hopkins, Arizona). These observations were taken at a resolving power
λ/∆λ≈35,000, and cover approximately 45 ˚A in a single order centered near the Mg I b triplet at
[image:6.612.62.287.155.476.2]were obtained with TODCOR (Zucker & Mazeh 1994), a two-dimensional cross-correlation algo-rithm. The template for both components was chosen to be an observation of Barnard’s star (GJ 699, M4Ve) taken with a similar instrumental setup, which provides a close match to the spectral type of CM Dra. Unlike the original study, here we have made a special effort to match the rotational broadening of each component by convolving the spectrum of Barnard’s star (assumed to have negli-gible rotation) with a standard rotational profile. The values of the projected rotational velocity of the components (vsini) that provide the best match to the stars are 9.5 ±1.0 km s−1 for the
primary and 10.0±1.0 km s−1 for the secondary.
The average light ratio derived from these spectra isL2/L1= 0.91±0.05 at the mean wavelength of
our observations.
As a test, we experimented with other tem-plates obtained with the same instrumentation to investigate the possibility of systematic errors in the velocities due to “template mismatch” (see, e.g., Griffin et al. 2000), which might bias the mass determinations. The use of a template made from an observation of the star GJ 725 A (M3.5V) produced rather similar velocities, and an orbital solution with nearly identical elements and for-mal uncertainties only slightly higher than our previous fit. The minimum masses from this so-lution were smaller than our previous results by only 0.23% and 0.14% for the primary and sec-ondary, respectively, which are below the formal errors in those quantities. A template from an observation of GJ 51 (M5.0V) gave an orbital so-lution that was significantly worse, and minimum masses 0.67% and 0.72% higher than those from our reference fit. As a measure of the closeness of the match to the real components of CM Dra, we computed for each template the cross-correlation value from TODCOR averaged over all exposures. Both of the alternate templates, which bracket the spectral type of CM Dra, gave average correlation values that were lower than we obtained with the GJ 699 template (particularly for GJ 51), indicat-ing the match is not as good. The results usindicat-ing Barnard’s star are thus preferable, and the above tests indicate template mismatch is unlikely to be significant.
The spotted nature of the CM Dra implies the possibility of systematic effects on the
mea-sured radial velocities that could bias the inferred masses and radii of the stars. In principle the WD code can approximately take into account these ef-fects in solutions that use spectroscopic and pho-tometric observations simultaneously, as long as those observations are contemporaneous. Unfor-tunately, this is not the case here, and as seen in Table 3 the properties of the spots change signif-icantly with time. In order to at least provide an estimate of the effect, we have performed exper-iments in which we perturbed the individual ve-locities by adding the radial-velocity corrections that WD computes for each of the spot configura-tions in Table 3. We then carried out Keplerian fits in each case, and we compared them. The dif-ferences in the key parameters (i.e., the minimum masses Msin3
i, projected semimajor axis asini,
e,ω, andM2/M1) are always within the formal
er-rors. This is not surprising, given that the individ-ual velocity corrections are typically smaller than 0.2 km s−1
. Nevertheless, to be conservative, we have taken half of the maximum difference in each parameter as a measure of the possible systematic effect due to spots, and added this contribution in quadrature to the uncertainties determined from the analysis described in§3.
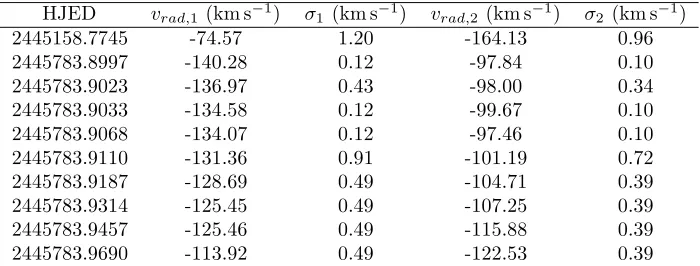
The measured radial velocities in the heliocen-tric frame are listed in Table 4, without any cor-rections. They supersede the measurements re-ported by Metcalfe et al. (1996). The median uncertainties are approximately 1.2 km s−1 and
1.4 km s−1 for the primary and secondary,
respec-tively. Metcalfe et al. (1996) did not report indi-vidual errors for their radial velocities, but we may take the rms residuals from their orbit as repre-sentative values. Compared to those (1.77 km s−1
and 2.33 km s−1for the primary and secondary,
re-spectively), our velocities give significantly smaller residuals (1.30 km s−1
and 1.40 km s−1
; Table 6). We attribute this to our use of templates that bet-ter match the rotational broadening of each com-ponent (see above), whereas Metcalfe et al. (1996) used an unbroadened template.
3. Analysis of light and radial velocity
curves
dis-Table 4: Radial velocity measurements for CM Dra in the heliocentric frame. The full version of this table is available electronically.
HJED vrad,1 (km s−1) σ1 (km s−1) vrad,2 (km s−1) σ2 (km s−1)
2445158.7745 -74.57 1.20 -164.13 0.96
2445783.8997 -140.28 0.12 -97.84 0.10
2445783.9023 -136.97 0.43 -98.00 0.34
2445783.9033 -134.58 0.12 -99.67 0.10
2445783.9068 -134.07 0.12 -97.46 0.10
2445783.9110 -131.36 0.91 -101.19 0.72
2445783.9187 -128.69 0.49 -104.71 0.39
2445783.9314 -125.45 0.49 -107.25 0.39
2445783.9457 -125.46 0.49 -115.88 0.39
2445783.9690 -113.92 0.49 -122.53 0.39
continuities resulting from the more than 30 leap seconds that have been introduced in the interval spanned by the various data sets. For the anal-ysis in this section we used the 2005 version of the 2003 WD code although updates in this ver-sion do not affect the fitting mode used for de-tached binaries. The program models proximity effects in detail, although they are negligible for a well-detached system such as CM Dra. The reflec-tion albedos for both components were held fixed at the value 0.5, appropriate for convective en-velopes, and a gravity brightening coefficient of 0.2 was adopted following Claret (2000). For the limb darkening we adopted the square root law, with coefficients computed dynamically at each iteration from the phoenix atmosphere models
(Allard & Hauschildt 1995), in order to follow the evolution of the components’ properties.
The light and velocity curves were adjusted si-multaneously with WD solving for the epoch of primary eclipse (T0), the eccentricity (e), the
ar-gument of the periastron (ω), the inclination (i), the semimajor axis (a), the systemic radial veloc-ity (γ), the mass ratio (M2/M1), the secondary
effective temperature (Teff,2), the luminosity
ra-tio at each bandpass (L2/L1), and the surface
po-tentials (Ωi). To first order the light curves are
only sensitive to the temperatureratioof the com-ponents. Because the limb darkening coefficients need to be interpolated from theoretical tables, we assumed Teff,1 = 3100 K according to the results
of Viti et al. (1997, 2002) and fitted for the value ofTeff,2.
Given that the data span over 30 years, we
initially attempted also to estimate the period (P) as well as the apsidal motion rate ( ˙ω) with WD directly from the light curves, simultaneously with the other adjustable quantities. We found that this did not yield satisfactory results, and the value for ˙ωwas statistically insignificant com-pared to its large error. We then chose to set
˙
ω to zero and fit each of the light curves sepa-rately in order to minimize the effects of possible changes in ω from epoch to epoch. The period was held fixed at the value found in the analysis of eclipse timings described later in §4, which is
[image:8.612.117.467.139.272.2]Table 5: Light-curve solutions for CM Dra from the different data sets. The period adopted is P = 1.268389985 days.
Parameter Lacy FCAPT Sleuth Average
Physical properties
T0(HJD−2400000) 42958.620510(24) 51134.661970(13) 53127.302690(21) 48042.32743(24)a e 0.00521(56) 0.00686(50) 0.00424(56) 0.0054(13)
ω0 (◦) 108.1(2.2) 101.9(0.9) 113.9(3.8) 107.6(6.3)
i(◦) 89.784(64) 89.770(28) 89.712(62) 89.769(73)
Ω1 15.736(50) 15.877(39) 15.862(61) 15.79(11)
Ω2 15.631(59) 15.506(40) 15.582(75) 15.59(10)
r1b 0.06757(12) 0.06700(12) 0.06690(17) 0.0673(5)
r2b 0.06350(17) 0.06403(12) 0.06377(17) 0.0637(4)
Radiative properties
Teff,1 (K) 3100 (fixed)
Teff,2/Teff,1 0.9984(7) 0.9926(4) 0.9923(5) 0.9960(40)
(L2/L1)R(ph. 0.25) – 0.8721(32) 0.8632(63) 0.8654(89)
(L2/L1)I(ph. 0.25) 0.8764(43) 0.8782(33) – 0.8768(44)
Albedo 0.5 (fixed)
Gravity darkening 0.2 (fixed)
Limb darkening coefficients (square root law)
x1 &y1 R 0.268 & 0.690
x2 &y2 R 0.293 & 0.669
x1 &y1 I −0.043 & 1.011 x2 &y2 I −0.018 & 0.991
Other quantities pertaining to the fits
σR (mag) – 0.0236 0.0137
σI (mag) 0.0071 0.0130 –
Nobs 830 1656 (R) , 1691 (I) 1179
aReference epoch of each light curve corrected to a central epoch. bVolume radii.
to the radial velocity curves are listed in Table 6. The results for the eccentricity and ω are consis-tent with those derived from the light curves. The fitted light and velocity curves are shown in Fig. 3 and Fig. 4.
The parameters from our light curve fits are generally similar to those reported by Lacy (1977) (and Metcalfe et al. 1996, who adopted Lacy’s photometric results), with the exception of the rel-ative radius for the secondary, r2. Our value is
2.1% larger than that determined by Lacy (1977). This discrepancy is significant, corresponding to 2 times the combined uncertainities. One possible explanation is numerical differences in the model-ing techniques: Lacy used the Russell & Merrill (1952) method, whereas we used WD. Another is the treatment of the spots: Lacy assumed the spot modulation to be sinusoidal, whereas we per-formed a more sophisticated modeling with WD.
Significant differences in the shape of the mod-ulation occur near the eclipse phases, as shown in Fig. 2, which can influence the detailed shape of the eclipses on which the relative radii de-pend. Additionally, Lacy considered the orbit of CM Dra to be circular, whereas it is now known to be slightly eccentric. Because of the impact of r2 on the absolute dimensions of the binary,
-0.100 0.10
(O-C)
-0.050 0.05
(O-C)
-0.050 0.05
(O-C)
-0.030 0.03
(O-C)
-0.2 -0.1 0 0.1 0.2 0.3 0.4 0.5 0.6 0.7 0.8 0.9 1 1.1 1.2 Phase
0
0.5
1
1.5
2
2.5
∆
mag
FCAPT R
Sleuth R
FCAPT I
Lacy I
-0.100 0.10
(O-C)
-0.050 0.05
(O-C)
-0.050 0.05
(O-C)
-0.030 0.03
(O-C)
-0.02 -0.01 0 0.01 0.02
Phase 0
0.2 0.4 0.6 0.8 1 1.2 1.4
∆
mag
0.48 0.49 0.5 0.51 0.52
Phase
FCAPT R Sleuth R FCAPT I Lacy I
Fig. 3.— Left: Rectified light curves of CM Dra after subtracting the effects of third light and spots, separated by instrument. Observations outside of eclipse are binned as described in the text. Residuals are shown at the top. Right: Enlargement around the eclipse phases. All light curves are plotted as differential magnitude vs. phase, and residuals are plotted in the same order as the light curves. Note the different scales for the residuals of each instrument.
-50 5
(O-C)
2
-50 5
(O-C)
1
-0.2 -0.1 0 0.1 0.2 0.3 0.4 0.5 0.6 0.7 0.8 0.9 1 1.1 1.2 Phase
-200 -180 -160 -140 -120 -100 -80 -60 -40
vr
(km s
-1)
Fig. 4.— Phase-folded radial velocity curves of CM Dra, with the primary shown with filled sym-bols and the secondary with open symsym-bols. Resid-uals are shown at the top, and the elements of the spectroscopic fit are given in Table 6.
done in our own fits, the results differ somewhat from Lacy’s, particularly inr2 but also slightly in
the sum of the relative radii. The largest differ-ence, however, is seen when abandoning the as-sumption of a circular orbit. We conclude that this effect, with some contribution from the treat-ment of spots, has introduced subtle biases in the results of Lacy (1977) and Metcalfe et al. (1996) that are avoided in the present analysis, and gives us confidence in the accuracy of the absolute
prop-erties described below.
4. Analysis of the times of minimum
4.1. Apsidal motion
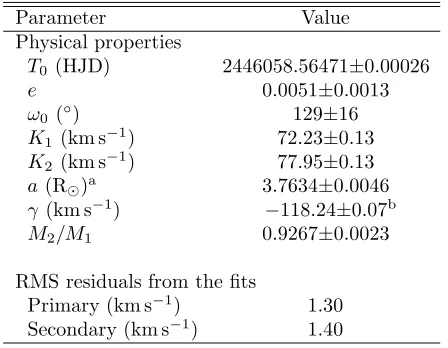
Table 6: Spectroscopic solution for CM Dra. Period is held fixed at the value P = 1.268389985 days.
Parameter Value
Physical properties
T0 (HJD) 2446058.56471±0.00026
e 0.0051±0.0013
ω0 (◦) 129±16
K1 (km s−1) 72.23±0.13
K2 (km s−1) 77.95±0.13
a(R⊙)a 3.7634±0.0046
γ(km s−1)
−118.24±0.07b
M2/M1 0.9267±0.0023
RMS residuals from the fits Primary (km s−1
) 1.30
Secondary (km s−1
) 1.40
aDe-projected by adopting the inclination angle from the light
curve solutions (see Table 5).
bThe true uncertainty ofγmay be larger due to external errors.
with a number of telescope facilities, as follows. A total number ot 20 minima were obtained at the Ondˇrejov observatory with the 65-cm reflect-ing telescope with the Apogee AP-7 CCD camera in primary focus. The measurements were done using the CousinsRfilter with 30 s exposure time. The nearby star GSC 3881.1146 on the same frame was selected as a primary comparison. No correc-tion for differential extinccorrec-tion was applied because of the proximity of the comparison stars to the variable and the resulting negligible differences in airmass. The new precise times of minima and their errors were determined by fitting the light curves with polynomials.
8 CCD minima were obtained during 2007 and 2008 in the Sloan r′ band using the 2.0m
Liver-pool Telescope in La Palma. High quality pho-tometry (3–4 mmag per image) was obtained, with typically 100 photometric points per event. 63 CCD minima were obtained at the Bradstreet Ob-servatory of Eastern University. The equipment consisted of a 41-cm f/10 Schmidt-Cassegrain re-flector coupled to a Santa Barbara Instruments Group ST-8 CCD camera binned so as to give a scale of 0.93′′pixel−1
. All observations were taken
through a Cousins I filter. The comparison star used was GSC 3881.421 which was always con-tained within the same 13′×9′field. The exposure
times were 25 sec in duration, typically resulting in uncertainties of 3 mmag for each data point. Finally, a secondary eclipse of CM Dra was mea-sured with the 1.2-m telescope at the F. L. Whip-ple Observatory in Arizona using a 4K×4K CCD camera (KeplerCam), binned to provide a scale of 0.67′′ pixel−1
. Observations were made through a Harris I filter relative to a set of 30 compari-son stars, and exposure times were 30 sec each. Photometric measurements were performed with IRAF using an aperture of 6′′, and have typical
uncertainties of 2 mmag. In these three latter cases, times of minima were computed by using the Kwee & van Woerden (1956) method.
All of these measurements (including those from the literature) have been converted to the uniform TT scale, and are presented in Table 7, which contains a total of 101 primary timings and 99 secondary timings. Eclipse timing events com-ing from different sources were weight-averaged. These data span approximately 35 years, although there is an unfortunate gap in the coverage of nearly 18 years.
In the presence of apsidal motion the times of minimum can be described following Gim´enez & Bastero (1995) as
Tj=T0+P
E+j−1 2
+
+ (2j−3)A1
eP
2πcosω+O e
2
,
(1)
where j indicates a primary or secondary eclipse (1 or 2, respectively), E is the cycle number, and
A1 is a coefficient dependent on the inclination
and eccentricity. The first two terms represent the linear ephemeris, and the third is the contribution of the apsidal motion. Given that the eccentricity of CM Dra is very small, powers of e2
or higher in these equations have been ignored since they produce corrections only of the order of 0.2 sec, which are much below the measurement errors of the timings.
For CM Dra we find that A1 ≈ 2, since the
inclination is close to 90◦ and the eccentricity is
Table 7: Photoelectric and CCD eclipse timings for CM Dra. The full version of this table is provided in electronic form.
HJED (O−C) (s) Error (s) Prim./Sec. Ref.
2441855.75476 −25.4 30.2 II 2
2442555.90592 −35.6 30.2 II 2
2442557.80955 54.7 30.2 I 2
2442607.91053 18.9 30.2 II 2
2442888.85928 49.9 30.2 I 2
2442893.93299 62.9 30.2 I 2
2442912.95925 98.4 30.2 I 2
2442966.86433 −30.8 30.2 II 2
2442994.76890 −31.6 30.2 II 2
2449494.63438 55.1 2.8 I 4
and a 180◦ phase difference between the primary
and secondary. Assuming the rate of periastron advance is constant, we may writeω=ω0+ ˙ω·E,
where E represents the orbital cycle and ˙ω is the total apsidal motion of the system. The latter can be determined from fits of Eq. 1 to each type of timing measurement. In the approximation of small values of ˙ωE, Eq. 1 can be written as
Tj≃T0+P
E+j−1 2
+
+ (2j−3)A1
eP
2π(cosω0−sinω0·ωE˙ ).
(2)
A linear fit to the timings can thus be performed as
(O−C)j =T0,j+PjE, (3)
where T0,j can be taken to represent an effective
epoch of reference for both minima including the effect of the eccentricity, andPjplays the role of a
period for each type of minimum. The ephemeris for the binary can then be written as
P = P1+P2
2 (4)
T0 =
T0,1+T0,2
2 −
P
4. (5)
Given values for the orbital elements (P, e) and
A1, we may compute ω0 and ˙ω from the linear fit
parametersT0,j andPj as
ω0 = arccos
2π A1eP
T0,2− T0,1−P2
2
!
, (6)
˙
ω =
2π A1ePsinω0
P1− P2
2
. (7)
[image:12.612.76.277.660.720.2]From Eq. 7 it can be seen that a difference in the periods for each type of minimum is an indication of the presence of apsidal motion in the binary.
Fig. 5 shows the O−C values for the primary and secondary minima of CM Dra as a function of the cycle number. There would seem to be a linear trend although the scatter of the measure-ments is fairly large. This scatter may be due in part to random errors, but there could also be biases arising from the presence of spots on the surface of the components. As a test, we sim-ulated light curves for CM Dra with the different spot configurations given in Table 3, and we found that the presence of spots can indeed skew eclipse timing determinations by up to ∼ 15 sec. Simi-lar results were found in a study by Hargis et al. (2000). Because of this effect, observational er-rors in the timings could be significantly underes-timated. We therefore performed linear fits of the times of eclipse with the internal errors doubled, in order to preserve the relative weights between the measures and obtain a reducedχ2
value closer to unity. This yielded more realistic uncertain-ties for the parameters of the fit. The results are shown in Table 8, and indicate an apsidal motion of ˙ω = (2.3±1.4)·10−4 deg cycle−1, i.e., a
-5000 -4000 -3000 -2000 -1000 0 1000 2000 3000 4000 5000 E (cycles)
-100 -80 -60 -40 -20 0 20 40 60 80 100 120
(O-C) (s)
[image:13.612.60.275.106.258.2]Experimental Theoretical
Fig. 5.— Observed minus calculated (O−C) resid-uals from the eclipse timings of CM Dra (filled symbols for the primary, open symbols for the secondary) with respect to a linear ephemeris. The linear fits to apsidal motion (solid line) and the theoretically predicted apsidal motion (dashed line) are shown.
4.2. Third body effects on the eclipse tim-ings
The analysis of times of minimum can also re-veal the presence of third bodies in eclipsing sys-tems through the time-delay effect caused by the orbit of the binary around the barycenter of the system. This produces a sinusoidal modulation of the (O−C) values from the timings. Deeg et al. (2008) have recently reported the possible pres-ence of a third body around CM Dra based on a parabolic fit to their sample of (O−C) values. We find, however, that using our own timings a parabolic fit is essentially indistinguishable from a linear fit to the measurements. Thus, any third body must have a period longer than roughly twice the span of the measurements, or ∼60 years, or must induce a light-time effect below∼15 s which would be undistinguishable from the dispersion of the data due to spot effects.
[image:13.612.309.528.139.322.2]Another indication of the possible presence of a third body is the small eccentricity of the close binary orbit of CM Dra. Systems with periods as short as that of CM Dra are usually assumed to be tidally circularized early on (Mazeh 2008), possi-bly even during the pre-main sequence phase. To explain the present non-zero eccentricity one may invoke the presence of a perturbing component in
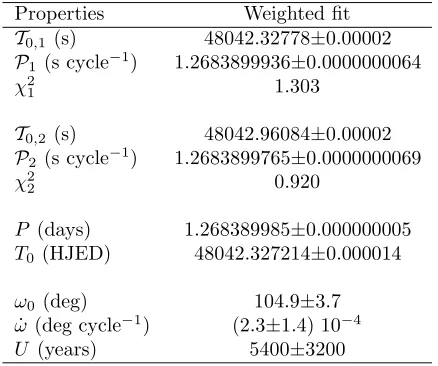
Table 8: Results of the linear fits to the eclipse timings for apsidal motion.
Properties Weighted fit
T0,1 (s) 48042.32778±0.00002 P1(s cycle−1
) 1.2683899936±0.0000000064
χ2
1 1.303
T0,2 (s) 48042.96084±0.00002 P2(s cycle−1) 1.2683899765
±0.0000000069
χ2
2 0.920
P (days) 1.268389985±0.000000005
T0 (HJED) 48042.327214±0.000014
ω0(deg) 104.9±3.7
˙
ω (deg cycle−1
) (2.3±1.4) 10−4
U (years) 5400±3200
a more distant orbit. Such a configuration can pro-duce secular variations of the orbital parameters of the inner orbit, such as an eccentricity modulation with a typical periodUmodgiven by
Umod≃P1,2
a3
a1,2
3
M1+M2
M3
, (8)
where P1,2 and a1,2 are the period and
semima-jor axis of the inner orbit of CM Dra, and a3
and M3 are the semimajor axis of the third body
around the center of mass of the triple system and the mass of the third body, respectively. A third body is actually known in the CM Dra sys-tem (the common proper motion white dwarf com-panion). Adopting a mass for the white dwarf of 0.63 M⊙ from Bergeron et al. (2001), along
with an angular separation from CM Dra of about 26′′ (corresponding to ∼380 AU at the distance
of CM Dra), the modulation period on CM Dra would be roughly 2 Gyr. However, the effect of such a long-period eccentricity pumping would be averaged out over many apsidal motion cycles, and therefore the orbit would remain circular. One may assume that eccentricity pumping by some other body in the system will only be effective if
Umod.5400 years, which is the period of the
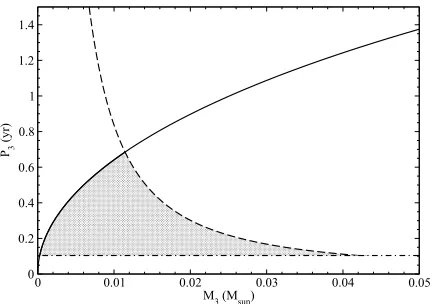
0 0.01 0.02 0.03 0.04 0.05 M3 (Msun)
0 0.2 0.4 0.6 0.8 1 1.2 1.4
P3
[image:14.612.58.274.105.257.2](yr)
Fig. 6.— Allowed region (shaded area) in a mass vs. orbital period diagram for a third body in the CM Dra system according to observational constraints: eccentricity modulation (solid line), light-time effect (dashed line) and stability crite-ria (dot-dashed line).
period) of the companion by accounting for the non-detection of light-time effect above 15 sec and the eccentricity pumping. Also, we consider that
P3/PCM Dra & 30 for stability criteria of
hierar-chical triple systems. As can be seen, a massive planet or light brown dwarf with an orbital period of 50–200 days would fulfill all constraints.
5. Absolute properties of the components
of CM Dra
Based on the fits to the light curves and the ra-dial velocities, the absolute physical properties of the components of CM Dra including the masses and radii can be derived independently of dis-tance or flux calibrations. We report these val-ues in Table 9. With the measured radii, we find that the predicted rotational velocities of the pri-mary and secondary, assuming synchronous ro-tation, are 10.22±0.08 km s−1
and 9.67±0.07 km s−1, respectively. These values are in good
agreement with thevsinimeasurements from our spectra (§2.2).
The effective temperatures of the components are not directly accessible from the light curve analysis, which yields only their ratio as measured by the relative depths of the eclipses. In §3 we adopted a value for the primary Teff from an
ex-ternal source (Viti et al. 1997, 2002), based on a
modeling of the spectrum of CM Dra. It is pos-sible, however, to determine the individual tem-peratures in another way, using information from the light curves along with a combined near-IR magnitude for the system and its trigonometric parallax. Here we have used the 2MASS mag-nitude Ks = 7.796± 0.021, subsequently
con-verted to the Johnson system following Carpenter (2001), and the parallaxπ= 69.2±2.5 mas from van Altena et al. (1995). We chose to rely on a near-IR magnitude because the corresponding bolometric corrections are less dependent on Teff
and chemical composition. We began by adopt-ing the value of Teff = 3100 K as a starting point
for the primary, from which the secondaryTeff
fol-lows from the measured temperature ratio. Bolo-metric corrections for each star were taken from Bessell et al. (1998) as a function of temperature, and averaged since they are virtually identical. The total luminosity was then computed. The ratio of the luminosities can be calculated from the temperature ratio and radius ratio, both of which are measured directly and accurately from the light curves:
L2
L1
=
r
2
r1
2T
eff,2
Teff,1
4
= 0.880±0.022. (9)
Individual bolometric luminosities are thus eas-ily derived, and since the absolute radii are also known, the individual temperatures can be ob-tained. This process was iterated until the cor-rections to the temperatures were below 1 K. The result is independent of the starting point for the primary temperature. The mean bolo-metric correction resulting from the calculation is
BCK = 2.66±0.05, and the total luminosity is
0.0104±0.0009 L⊙. The individual temperatures
and luminosities are listed in Table 9, in which the uncertainties include all measurement errors as well as an assumed uncertainty of 0.05 mag for the bolometric corrections, but exclude systemat-ics that are difficult to quantify. The Teff values,
which have a mean of 3125 K, agree very well with the estimate of Viti et al. (1997, 2002).
As a check, we used the above temperatures and our light ratios in theRandIbands from the light curves to predict the light ratio inV, appropriately scaling the NextGen models (Hauschildt et al. 1999). The result is L2/L1 = 0.86±0.15, which
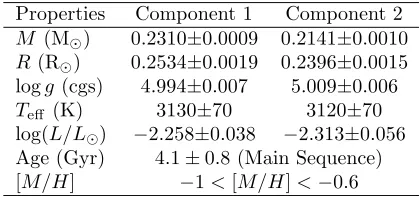
spectro-Table 9: Absolute physical properties of CM Dra. Properties Component 1 Component 2
M (M⊙) 0.2310±0.0009 0.2141±0.0010
R(R⊙) 0.2534±0.0019 0.2396±0.0015
logg (cgs) 4.994±0.007 5.009±0.006
Teff (K) 3130±70 3120±70
log(L/L⊙) −2.258±0.038 −2.313±0.056
Age (Gyr) 4.1±0.8 (Main Sequence) [M/H] −1<[M/H]<−0.6
MBol⊙=4.74 is used to compute luminosities (Bessell et al. 1998).
scopically (§2.2), within the errors. The mean temperature of the system may also be estimated from available color indices for CM Dra, and the recent color/temperature calibration for M dwarfs by Casagrande et al. (2008). We used the V R I
magnitudes of Lacy (1977) and the JHKs
mag-nitudes from 2MASS to construct twelve different color indices (after conversion of the R I magni-tudes from the Johnson system to the Cousins sys-tem following Leggett 1992), which are of course not independent of each other although they do serve to gain a better idea of the scatter among the various calibrations. We obtain a weighted average temperature of 3050±50 K, which is only slightly lower than the estimates above, but has the virtue of being completely independent of the parallax and the light curve parameters.
The age, along with mass and chemical compo-sition, is an indicator of the evolutionary status of a star. When known, it becomes a powerful constraint that can be used in the model com-parisons. For CM Dra we may obtain a rough estimate of its age by considering the proper-ties of its white dwarf companion. According to Bergeron et al. (2001), the cooling age of the white dwarf is 2.84±0.37 Gyr. Given its estimated mass (∼0.63 M⊙) and the initial-final mass relationship
of Catal´an et al. (2008), the mass of the main se-quence progenitor is estimated to be 2.1±0.4 M⊙.
For stars of such mass, stellar evolution models predict a lifetime of about 1.3 Gyr (Girardi et al. 2000). We therefore infer an approximate age for CM Dra of 4.1 Gyr with a 20% uncertainty level coming from uncertainties in the mass of the white dwarf progenitor and its metallicity. This total age indicates that CM Dra is well on the main
sequence.
The chemical composition of CM Dra has been notoriously difficult to determine, which is unfor-tunate for such an important system. It has usu-ally been considered to be metal-poor, although this is based mostly on circumstantial evidence (i.e., its large space motion). Attempts to deter-mine the metallicity by various means have often produced inconsistent results. Gizis (1997) and Leggett et al. (1998) concluded the composition is near solar, while Viti et al. (1997, 2002) found a metal-poor composition (−1.0 <[M/H] <−0.6) by performing fits to the spectral energy distribu-tion and several diagnostic spectral features us-ing stellar atmosphere models. However, some systematic differences between the estimates from optical and near-IR spectra in the latter studies are disconcerting and cast some doubts on the re-sults. Our own checks using the same spectro-scopic material and the most recent version of the NextGen models did not yield an improvement in the results. The various metallicity indicators still show disagreements, and would seem to indi-cate shortcomings in the model atmosphere calcu-lations. Thus, the metallicity of CM Dra remains poorly determined.
Kinematics of the common proper motion group of CM Dra could provide further insight on its age and metallicity. The space velocity com-ponents of the system are U = −106.8 km s−1
,
V = −119.8 km s−1
and W = −35.1 km s−1
[image:15.612.60.270.127.232.2]provide interesting constraints to the mechanisms of star acceleration in the Galaxy.
6. Comparison with theoretical models
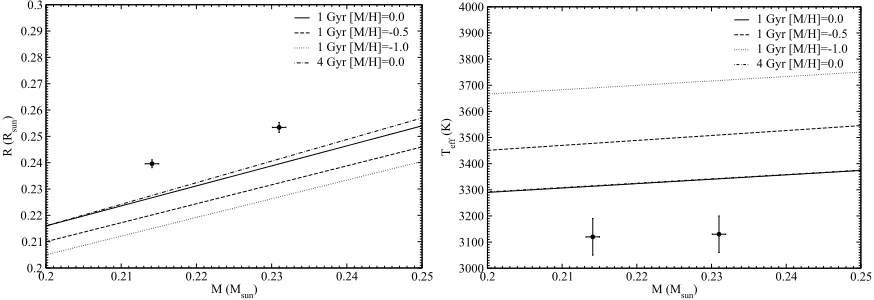
Our mass, radius, and temperature determina-tions for CM Dra are compared in Fig. 7 with the predictions of stellar evolution models from Baraffe et al. (1998). The measurements support a trend found previously for other low-mass EBs, in the sense that the observed radii for both com-ponents are larger than predicted by theory, in this case by ∼4.7% and ∼5.0% for the primary and secondary, respectively. The effective tem-peratures are cooler than the models indicate, by
∼6.8% and∼6.3%. We note also that while these are significantoffsets(compared to the errors), the slope of the models appears substantially correct. These deviations refer strictly to the comparison with solar-metallicity models, and would be even larger if a lower metallicity were assumed. For ex-ample, the offsets would increase to ∼10% in the radii for models with [M/H] =−1.
Magnetic activity on the components of simi-lar low-mass EB systems has often been proposed as an explanation for these discrepancies between models and observations (see§1) . The activity in these typically short-period binaries is associated with the very rapid rotation resulting from tidal synchronization with the orbital motion. One manifestation of this activity is the presence of surface features (spots) that tend to block a frac-tion of the outgoing radiafrac-tion. The star adjusts by increasing its size in order to conserve flux, and at the same time the effective temperature becomes lower than in a spot-free star. Recent work has shown that the same hypothesis appears to ex-plain the differences observed between active and inactive single stars (Morales et al. 2008). The-oretical efforts have had some success in repro-ducing the observations for sub-solar mass binary systems by accounting for stellar activity in the models, at least to first order (e.g., D’Antona et al. 2000; Mullan & MacDonald 2001; Chabrier et al. 2007). In the most recent of these studies the au-thors examined the effects of activity in reducing the convection efficiency as well as in obstruct-ing radiation due to the presence of dark surface features. The first of these effects is equivalent to a reduction in the mixing length parameter
(αML), whereas the second can be parametrized in
terms of the fractional spot coverage. The results show that for stars in the fully convective regime (M .0.35 M⊙) the effect of a reduction in αML
is minimal, while the presence of spots has a sig-nificant effect, and accounting for this can in fact reproduce the properties of CM Dra with a spot fraction of about 30%. For somewhat more mas-sive stars theory predicts that both a reducedαML
and spot coverage lead to similar effects on the global properties. Although further observational and theoretical work is needed, these predictions appear at least qualitatively consistent with the findings of previous EB studies that suggest the radius discrepancies with the models are roughly 5% for stars with M <0.35 M⊙, and about 10%
for higher mass stars with convective envelopes. The implication is that in the former case the de-viations are due only to spots, whereas for stars with radiative cores both spots and the reduction in the convection efficiency are important. A more detailed study of the relationship between activ-ity and the radius discrepancies is underway by a subset of the present authors, including consis-tency checks with all observational constraints for late-type stars in binaries. This work will be pre-sented in a forthcoming paper, placing CM Dra in context with the rest of the low-mass EBs.
The value of the apsidal motion found in §4 provides a different type of test of internal struc-ture models since the rate of classical precession induced by tidal effects depends on the density profile of the stars. Following the prescriptions in (Kopal 1978), tidal apsidal motion is given by:
˙
ωtidal= 360◦(c2,1k2,1+c2,2k2,2), (10)
wherec2,iare coefficients that depend on the
prop-erties of each component, and k2,i are the
in-ternal structure constants dependent on the den-sity profile. Using the internal profile models of Baraffe et al. (1998), we derive logk2,1 = −0.95
and logk2,2 = −0.96 for the primary and
sec-ondary components, respectively. These values yield ωtidal˙ = (1.64±0.04)·10−3 deg cycle−1.
0.2 0.21 0.22 0.23 0.24 0.25 M (Msun)
0.2 0.21 0.22 0.23 0.24 0.25 0.26 0.27 0.28 0.29 0.3
R (R
sun
)
1 Gyr [M/H]=0.0 1 Gyr [M/H]=-0.5 1 Gyr [M/H]=-1.0 4 Gyr [M/H]=0.0
0.2 0.21 0.22 0.23 0.24 0.25
M (Msun) 3000
3100 3200 3300 3400 3500 3600 3700 3800 3900 4000
Teff
(K)
[image:17.612.73.510.108.258.2]1 Gyr [M/H]=0.0 1 Gyr [M/H]=-0.5 1 Gyr [M/H]=-1.0 4 Gyr [M/H]=0.0
Fig. 7.— Comparison of the physical properties for CM Dra with models of Baraffe et al. (1998) in the
M-Rdiagram (left) and theM-Teff diagram (right). Models for different metallicities and ages are shown,
as labeled.
by Gim´enez (1985), and based on the properties derived here for CM Dra, the predicted effect is
˙
ωrel= (2.711±0.005)·10−4deg cycle−1.
Combin-ing the tidal and relativistic contributions, we ob-tain a theoretical value of the total apsidal motion of ωtheo˙ = (1.91±0.04)·10−3 deg cycle−1. This value is incompatible with the observed ωobs˙ = (2.3±1.4)·10−4 deg cycle−1. The discrepancy is
significant, at the 12-σlevel.
A third body may also alter the apsidal motion rate of the binary. Interaction with the distant white dwarf companion needs in principle some consideration. The typical period of the apsi-dal motion resulting from a third-body perturba-tion is given by Eq. 8. As described earlier, for the white dwarf CM Dra companion this modu-lation period is about 2 Gyr, thus the contribu-tion of the white dwarf to the apsidal mocontribu-tion is completely negligible compared to the relativistic contribution, which has a much shorter period of
∼4600 yr. There have been some claims of de-tections of low-mass companions orbiting CM Dra from analyses of the eclipse timings (Deeg et al. 2000, 2008, e.g.,), but the evidence so far does not seem compelling. As we discuss in §4.2 a third body may help to explain the small but signifin-cant eccentricity and remain undetected to via the light-time effect. Given the possible range in mass and orbital period of such putative substellar ob-ject, we estimate that its contribution to the apsi-dal motion of CM Dra may be sufficient (depend-ing on the relative orbital inclination) to explain
the observed differences. Note that scenario has been advocated to resolve the discrepancy found in the eclipsing binary DI Her (Guinan & Maloney 1985).
CM Dra has often been regarded in the past as a favorable system for inferring the primordial helium abundance, assuming that it is a Popula-tion II star. Paczy´nski & Sienkiewicz (1984) de-scribed a method using polytropic stellar mod-els that was followed by Metcalfe et al. (1996), who obtained bulk helium abundances of about 0.3 for both stars. These values are significantly higher than estimates using other methods. An-other analysis by Chabrier & Baraffe (1995) led to a much lower value of 0.25, through a compari-son between their models and the physical proper-ties of the CM Dra components reported by Lacy (1977). Those authors indicated, however, that for masses as low as those of CM Dra the models de-pend only weakly on the helium abundance. The present work shows that standard models are as yet unable to reproduce the observed values of R
andTeff for the components of this binary at their
7. Conclusions
Prompted by significant improvements in eclips-ing binary analysis methods since the most re-cent major photometric study by Lacy (1977), and aided by new photometric observations gath-ered here to complement existing data, as well as improvements in the spectroscopy, we have conducted a thorough reanalysis of the classical low-mass double-lined eclipsing binary CM Dra. The goal has been to provide the best possible de-terminations of the physical properties to enable stringent tests of stellar theory. Our results for the masses and radii of the stars, which we esti-mate to be about 4.1 Gyr old, areM1= 0.2310±
0.0009 M⊙, M2 = 0.2141±0.0010 M⊙, R1 =
0.2534±0.0019 R⊙, andR2= 0.2396±0.0015 R⊙,
with formal relative uncertainties of only ∼0.5%. A special effort has been made in this study to investigate possible sources of systematic error in these quantities and to assess their importance. We have performed a number of tests during the light-curve analysis, the spectroscopic analysis, and the determination of effective temperatures. The resulting uncertainties of these physical prop-erties are thus believed to be realistic, and to offer the best opportunity for carrying out meaning-ful tests of models of stellar evolution and stellar structure for fully convective main-sequence stars. We find that the radii and temperatures of CM Dra show the same sort of discrepancy with model predictions as found previously for other low-mass EBs, which are at the level of ∼5–7% in this particular case. Mounting evidence in-dicates that such differences can be ascribed to magnetic activity effects. Further research is un-derway to estimate the corrections needed in the models in order to reproduce the observations of low-mass EBs, given the prescriptions proposed by Chabrier et al. (2007).
Measurements of the times of minimum for CM Dra clearly show the presence of apsidal mo-tion in the system. However, its value is still poorly determined on account of observational er-rors, other errors due to distortions caused by spots, and the limited time coverage of the data. There also seems to exist a discrepancy bewteen the observational value and that derived from General Relativity and tidal theory. A third body in the system, which may be responsible for the
non-zero eccentricity, could provide an explana-tion to the observed difference. Further measure-ments over the coming years will greatly help to constrain the precession of the line of apsides and separate the two effects more clearly, in addition to providing a better basis for investigating the possible presence of a third body in the system.
We are grateful to J. Kreiner for help with the compilation of eclipse timings. JCM, IR and CJ acknowledge support from the Spanish Ministe-rio de Educaci´on y Ciencia via grants AYA2006-15623-C02-01 and AYA2006-15623-C02-02. GT acknowledges partial support for this work from NSF grant AST-0708229 and NASA’s MASSIF SIM Key Project (BLF57-04). EFG acknowledges support for the FCAPT research under NSF/RUI grant AST05-07536. DC and FTOD acknowl-edge support for the Sleuth Observatory work by the National Aeronautics and Space Administra-tion under grant NNG05GJ29G issued through the Origins of Solar Systems Program. FTOD also acknowledges partial support for this work pro-vided through the NASA Postdoctoral Program at the Goddard Space Flight Center, administered by Oak Ridge Associated Universities through a con-tract with NASA. The investigation of MW was supported by the Grant Agency of the Czech Re-public under grant No. 205/06/0217.
REFERENCES
Allard, F., & Hauschildt, P. H. 1995, ApJ, 445, 433
Baraffe, I., Chabrier, G., Allard, F., & Hauschildt, P. H. 1998, A&A, 337, 403
Bergeron, P., Leggett, S. K., & Ruiz, M. T. 2001, ApJS, 133, 413
Bessell, M. S., Castelli, F., & Plez, B. 1998, A&A, 333, 231
Carpenter, J. M. 2001, AJ, 121, 2851
Casagrande, L., Flynn, C., & Bessell, M. 2008, MNRAS, in press (arXiv:0806.2471)
Catal´an, S., Isern, J., Garc´ıa-Berro, E., & Ribas, I. 2008, MNRAS, 387, 1693
Chabrier, G., Gallardo, J., & Baraffe, I. 2007, A&A, 472L, 17
Claret, A. 2000, A&A, 359, 289
Claret, A. 2004, A&A, 428, 1001
Claret, A., & Gim´enez, A. 1993, A&A, 277, 487
D’Antona, F., Ventura, P., & Mazzitelli, I. 2000, ApJ, 543, L77
Deeg, H. J., Doyle, L. R., Kozhevnikov, V. P., Blue, J. E., Mart´ın, E. L., & Schneider, J. 2000, A&A, 358, L5
Deeg, H. J., Oca˜na, B., Kozhevnikov, V. P., Char-bonneau, D., O’Donovan, F. T., & Doyle, L. R. 2008, A&A, 480, 563
Deeg, H. J., et al. 1998, A&A, 338, 479
Doyle, L. R., et al. 2000, ApJ, 535, 338
Dunham, E. W., Mandushev, G. I., Taylor, B. W., & Oetiker, B. 2004, PASP, 116, 1072
Eggen, O. J., & Sandage, A. 1967, ApJ, 148, 911
Etzel, P. B. 1981, in Photometric and Spectro-scopic Binary Systems, ed. E. B. Carling & Z. Kopal (Dordrecht: Reidel), p. 65
Gim´enez, A. 1985, ApJ, 297, 405
Gim´enez, A., & Bastero, M. 1995, Ap&SS, 226, 99
Girardi, L., Bressan, A., Bertelli, G., & Chiosi, C. 2000, A&AS, 141, 371
Gizis, J. 1997, AJ, 113, 806
Griffin, R. E. M., David, M., & Verschueren, W. 2000, A&AS, 147, 299
Guinan, E. F., & Maloney, F. P. 1985, AJ, 90, 1519
Hargis, J. R. et al. 2000, BAAS, 32, 1480
Hauschildt, P. H., Allard, F., & Baron, E. 1999, ApJ, 512, 377
Kopal, Z. 1978, Dynamics of Close Binary Stars, Reidel Publishing Company
Kwee, K. K., & Woerden, H. 1956, Bull. As-tron. Inst. Netherlands, 12, 327
Lacy, C. H. 1977, ApJ, 218, 444
Lacy, C. H., Moffett, T. J., & Evans, D. S. 1976, ApJS, 30, 85
Leggett, S. K. 1992, ApJS, 82, 351
Leggett, S. K., Allard, F., & Hauschildt, P. H. 1998, ApJ, 509, 836
L´opez-Morales, M. 2007, ApJ, 660, 732
L´opez-Morales, M., & Ribas, I. 2005, ApJ, 631, 1120
Mandushev, G., et al. 2005, ApJ, 621, 1061
Mandushev, G., et al. 2007, ApJ, 667, L195
Mazeh, T. 2008, astro-ph/0801.0134
Metcalfe, T. S., Mathieu, R. D., Latham, D. W., & Torres, G. 1996, ApJ, 456, 356
Morales, J. C., Ribas, I., & Jordi, C. 2008, A&A, 478, 507
Mullan, D. J., & MacDonald, J. 2001, ApJ, 559, 353
Nelson, T. E., & Caton, D. B. 2007, IBVS, 5789, 1
Nordstr¨om, B., et al. 2004, A&A, 418, 989
O’Donovan, F. T., et al. 2006a, ApJ, 651, L61
O’Donovan, F. T., et al. 2006b, ApJ, 644, 1237
O’Donovan, F. T., et al. 2007, ApJ, 663, L37
Paczy´nski, B., & Sienkiewicz, R. 1984, ApJ, 286, 332
Popper, D. M., & Etzel, P. B. 1981, AJ, 86, 102
Ribas, I. 2006, in ASP Conf. Ser. 55, Astrophysics of Variable Stars, ed. C. Sterken & C. Aerts (San Francisco: ASP), 349
Ribas, I., Morales, J. C., Jordi, C., Baraffe, I., Chabrier, G., & Gallardo, J. 2008, Mem. Soc. Astron. Italiana, 79, 562
Russell, H. N., & Merrill, J. E. 1952, Contr. Princeton Univ. Obs., No. 23–26
Torres, G., & Ribas, I. 2002, ApJ, 567, 1140
van Altena, W. F., Lee, J. T., & Hoffleit, E. D. 1995, The General Catalogue of Trigonometric Paralaxes, Yale University Observatory.
Viti, S., Jones, H. R. A., Maxted, P., & Tennyson, J. 2002, MNRAS, 329, 290
Viti, S., Jones, H. R. A., Schweitzer, A., Allard, F., Hauschildt, P. H., Tennyson, J., Miller, S., & Longmore, A. J. 1997, MNRAS, 291, 780
Wilson, R. E., & Devinney, E. J. 1971, ApJ, 166, 605
Zucker, S., & Mazeh, T. 1994, ApJ, 420, 806
This 2-column preprint was prepared with the AAS LATEX