Rochester Institute of Technology
RIT Scholar Works
Theses
Thesis/Dissertation Collections
2001
Analysis of the edge effect of error propagation in
digital halftones
Sunadi Gunawan
Follow this and additional works at:
http://scholarworks.rit.edu/theses
This Senior Project is brought to you for free and open access by the Thesis/Dissertation Collections at RIT Scholar Works. It has been accepted for inclusion in Theses by an authorized administrator of RIT Scholar Works. For more information, please [email protected].
Recommended Citation
SIMG http://www.cis.rit.edu/research/thesis/bs/2001/gunawan/title.htm
SIMG-503
Senior Research
Analysis of the Edge Effect of
Error Propagation in Digital Halftones
Final Report
Sunadi P Gunawan
Center for Imaging Science
Rochester Institute of Technology
May 2001
Analysis of the Edge Effect of http://www.cis.rit.edu/research/thesis/bs/2001/gunawan/tableofcontent....
Analysis of the Edge Effect of
Error Propagation in Digital Halftones
Sunadi P Gunawan
Table of Contents
Abstract
Copyright
Acknowledgement
Introduction
Background
Theory
The Edge Enhancement Methods
·
Sample Generation
·
Calculating Edge Enhancement
·
The Impact of Noise from Halftone Algorithm
Results
·
Floyd-Steinberg Error Diffusion
·
Omni-Directional Error Diffusion
Discussion
Conclusion
Analysis of the Edge Effect of http://www.cis.rit.edu/research/thesis/bs/2001/gunawan/abstract.htm#ab
Analysis of the Edge Effect of
Error Propagation in Digital Halftones
Sunadi P Gunawan
Abstract
The purpose of this research is to study quantitatively edge enhancement effects of different digital halftone algorithms,
especially on Error diffusion and Linear Pixel Shuffling algorithms. It has been known that by changing the amount of
error and the spread of error when processing original images, different edge enhancement effects are observed. In many
cases sometimes an unsymmetrical edge enhancement phenomenon occurs at the junction of different gray levels. A
new metric for describing edge enhancement effects is introduced. This metric is shown to be consistent and reliable. In
order to describe the unsymmetrical edge enhancement phenomenon in some cases, a new unsymmetrical metric is
introduced. Both of these metrics are expected to provide useful quantitative measurements of edge enhancement effects
in various different halftone algorithms.
Copyright ? 2001 http://www.cis.rit.edu/research/thesis/bs/2001/gunawan/copyright.htm
Copyright ã 2001
Center for Imaging Science
Rochester Institute of Technology
Rochester, NY 14623-5604
This work is copyrighted and may not be reproduced in whole or part without permission of
the Center for Imaging Science at the Rochester Institute of Technology.
This report is accepted in partial fulfillment of the requirement of the course SIMG-503 Senior
Research.
Title: Analysis of the Edge Effect of Error Propagation in Digital Halftones
Author: Sunadi P Gunawan
Project Advisor: Dr. Jonathan S. Arney
SIMG 503 Instructor: Dr. Anthony Vodacek
Analysis of the Edge Effect of http://www.cis.rit.edu/research/thesis/bs/2001/gunawan/acknowledgeme...
Analysis of the Edge Effect of
Error Propagation in Digital Halftones
Sunadi P Gunawan
Acknowledgement
Dr. Jonathan S. Arney For being an outstanding
advisorand teacher
Dr. Peter G. Anderson For helping me generate LPS
samples
Analysis of the Edge Effect of http://www.cis.rit.edu/research/thesis/bs/2001/gunawan/thesis.htm#intro
Analysis of the Edge Effect of
Error Propagation in Digital Halftones
Sunadi P Gunawan
Introduction
It has been observed that many different types of digi tal halftone algorithms show edge enhancement effects.
Edge enhancement is often desirable and can provide an impression of higher image resolution. For example, the
Floyd-Steinberg stochastic halftone error diffusion algorithm shifts the visual noise of the image to a higher frequency
so that our eyes are unable to see it. In addition, the Floyd-Steinber g algorithm is well known to enhance edge sharpness
(7). As a result we will see perceptually an image that has higher resolu tion as well as lower noise. It has been reported that by changing the way error is diffused in the Floyd-Steinberg algo rithm, both the visual noise and the edge
enhancement change.However, these effects have been reported only as qualitative visual observations and not as
quantitative measurements.
The focus of this research is to develop a quantitativ e method of analysis the edge enhancement effects in
digital halftone algorithms. An experiment was designed to model the edge enhancement by creating two different gray
level values, where the junction between these gray level values showed the edge enhancement effects. Error Diffusion
and Linear Pixel Shuffling techniques were used to generate the halftones examined in this project (5).
The goal of this research is to develop a metric that can be used to measure edge enhancement effects
quantitatively in any digital halftone algorithms. The metric is hoped to give people a better control toward designing
digital halftone algorithms.
Background
Some digital halftone algorithms have been observed to create an edge enhancement effect (5)(7), which is often desirable in order to give higher image resolution impression. For example, the Floyd-Steinberg algorithm shifts
the visual noise of the image to a higher frequency so that our eyes d o not see it. The Floyd-Steinberg algorithm also
enhances some edges. However, as will be shown, edges are enhanced only in some directions. The new Linear Pixel
Analysis of the Edge Effect of http://www.cis.rit.edu/research/thesis/bs/2001/gunawan/thesis.htm#intro
provides a unique new way to diffuse error and as will be shown enhances edges is all directions.
Error diffusion is a popular digital halftone algorith m that is used to prepare images for viewing on a computer
screen or for reproduction of images on low resolution printers (2). Error diffusion algorithms enhance the input edges. It will be shown that by varying the way the propagated error is distr ibuted, the amount of edge enhancement effects on
the images is different.
Error diffusion was developed by Floyd and Steinberg i n 1976 as a method of preparing an image for
computer display. The concept of this method is that the algorithm will calculate the error between the input and the
output and uses the error in the calculation of the next output pixel.
The simplest example of the error diffusion technique is the one-dimensional case in which the error is spread
out to the next successive pixel only (1). The gray level (0 to 255) of the first input pixel is compared to a threshold gray value of 128.If the input gray value is less than 128, the output pixe l is zero, else it is 255. This results in an error equal
to the difference between the output and the input gray values. This error can be positive or negative and is added to the
next input pixel. Thresulting sum is compared to the threshold value of 128 to determine the output value (0 or 255) of
the next pixel, and the error is again calculated and propagated. The process of error is propagation and thresholding is
continued to the end of the image. As the process continues, all the input pixel values will be modified by the error value
that is generated by the previous processed pixel. This process result s in an average gray level equal to the gray level of
the input image.
This simple one-dimensional case will not produce edge enhancement effects on the output image. It is
usually used only to spread out the errors to the neighboring pixels a nd improve the appearance of gray scale. The
Floyd-Steinberg technique passes error to the closest four neighbor pi xels instead of just to the next pixel. The closest
four pixels receive a fraction of the total error, and the way in whic h the error is distributed to the four pixels has an
effect on the noise and edge enhancement of the final image (4).
Linear Pixel Shuffling is a new digital halftone techn ique that provides a method of processing a pixel in
images in a pseudo random way rather than in a sequential raster order. Linear Pixel Shuffling is based on the property
of a Fibonacci-like sequence of numbers. An advantage of Linear Pixel Shuffling is that it processes the image
Analysis of the Edge Effect of http://www.cis.rit.edu/research/thesis/bs/2001/gunawan/thesis.htm#intro
Although edge enhancement effects are often observed in digital halftones; such as in Error Diffusion and
Linear Pixel Shuffling technique, no quantitative method of analysis of the effects has been reported. However, the
literature has many reports on how to detect edge enhancement effects (3). This experiment is designed to measure quantitatively the edge enhancement generated by different digital halftones algorithm, especially by Error Diffusion
and Linear Pixel Shuffling technique. At the end of the project, it is expected to that a technique of measuring
quantitatively edge enhancement will be achieved.
The hypothesis of this project is that edge enhancemen t effects on different digital halftones algorithm can be
measured, within experimental error, by designing new metrics of characterizing edge enhancement phenomenon. The
metrics can also be used to predict and to control the effect of changing algorithms in the process of generating output
images.
Theory
It has been reported that by changing the way error is distributed in error diffusion algorithms, the visual noise
of an image will be frequency characteristics of the noise power in the image is changed. In addition, different amounts
of edge enhancement are observed.
Root Mean Square (RMS) deviation, also known as standa rd deviation, is a traditional metric of measuring the
average distance of each data members of the sample from the mean. An RMS deviation technique was chosen for this
project as the basis for an edge enhancement metric. By using this metric, the amount of edge enhancement can be
measured and compared to the noise power in the image which is also characterized using an RMS deviation
calculation. Thus, a signal to noise ratio can be defined as the ratio of the edge RMS metric to the noise RMS metric. A
signal to noise ratio, SNR, is a metric that is often used to determine whether one can see the difference in an image or
not. Usually, signal to noise ratio of three is used as a minimum limit to determine when someone can see the difference
in the image (6). In the current project the RMS edge to noise ratio is measured, and a ratio of 3 or greater is assumed qualitatively to be visually significant.
It is sometimes observed that the edge enhancement effect is not symmetrical on both sides of the edge that
the amount of edge enhancement on a junction between lower and higher reflectance value on a sample to be different.
Thus, the RMS edge enhancement metric developed in this project was designed to characterize not only the overall
Analysis of the Edge Effect of http://www.cis.rit.edu/research/thesis/bs/2001/gunawan/thesis.htm#intro
sides of the edge. The difference between these two edge metrics then provides a measure of the degree of symmetry of
the edge enhancement.
The Edge Enhancement Methods
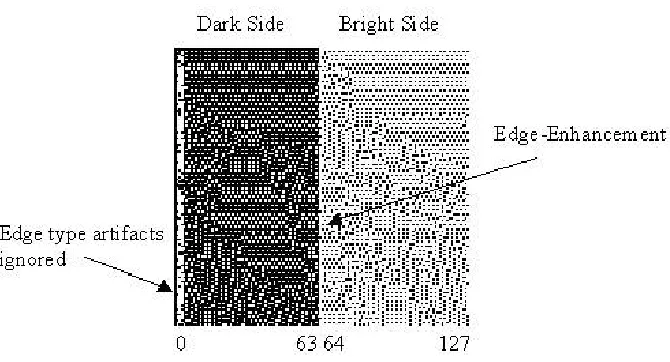
A. Sample Generation
Error Diffusion and Linear Pixel Shuffling techniques were used in order to generate different samples.
Different samples were needed to test whether the experimental design is valid or not. The size of each sample was 128
x 128 pixels. Most of the samples used in this study were constructed with the dark side on the left from horizontal
location 0 to 63 and the bright side on the right from pixel 64 to 127. Figure 1 is an illustration. Edge enhancement is
expected along the edge between the two sides of the image. Occasionally edge type artifacts occurred at the extreme
left or right of the image, but these were ignored in the study.
Symmetry characteristics of a halftone algorithm were examined by measuring edges in three additional
images: one with the bright side on the right; with the bright side on the top (horizontal edge); and with the bright side
on the bottom. Each of the edge images, after being formed by the halftone algorithm, was rotated so the bright side was
on the right to allow easier application of the edge analysis algorith m.
[image:10.612.138.473.448.629.2]
Figure 1: Example Image: Floyd-Steinberg Error Diffusion.
B. Calculating Edge Enhancement
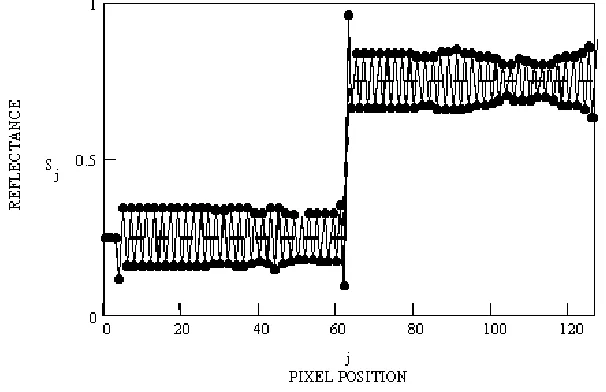
Each sample was analyzed by first averaging the pixel values i n each column of the image. The average
Analysis of the Edge Effect of http://www.cis.rit.edu/research/thesis/bs/2001/gunawan/thesis.htm#intro
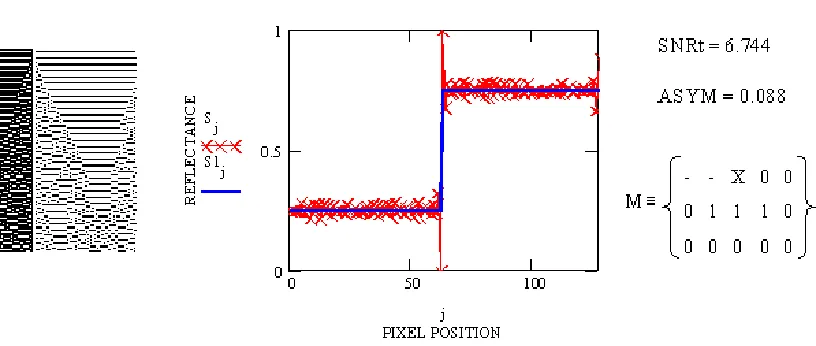
was labeled by a location index, j from 0 to 127 from left to right. Figure 2 illustrates the mean column reflectance, S, as
a function of column location, j, for the example image shown in Figure 1.
Each edge generated by a halftone algorithm was compared to the ideal edge shown as the dotted line step
function in Figure 2. The differences between the ideal edge and the measured values of S were calculated at each
location, j. As a result of programming artifacts, it was occasionally found that the mean reflectance, S, on each side of
the image was not identical to the value selected for the ideal edge. The differences were small (£ 0.05 reflectance) and
corrections were made by values of S on the left and right side of the ideal edge in such a way that the RMS deviation
[image:11.612.155.458.245.441.2]between the ideal edge and the measured edge was zero.
Figure 2: Scan data S versus j (-·-·-·-·-)and the ideal edge ( - - - ) for the image shown in Fig.1.
Figure 2 illustrates edge enhancement. The mean value of S immediately before the edge (j = 63) is
significantly lower than the mean reflectance of the left side of the image. Also, the value of S immediately following
the edge (j = 64) is significantly higher than the mean on the right s ide of the image. In order to extract information from
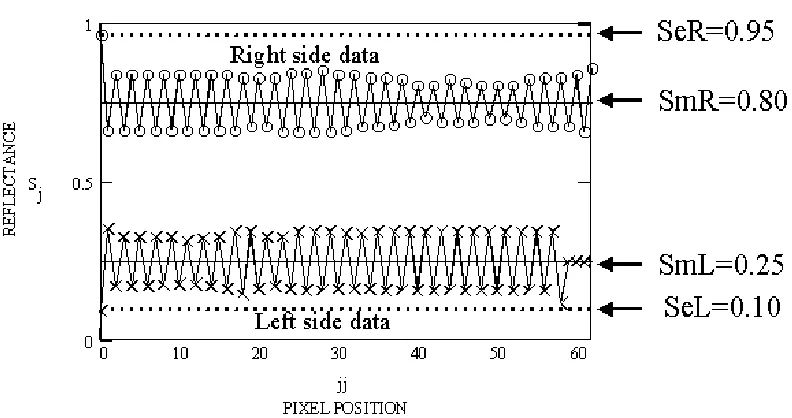
each side of the edge the data was divided into two independent data sets, as shown in Figure 3. The origin in each data
set corresponds to the column nearest the edge, and the values of S are shown at locations jj increasing with distance
from the edge. The values of S immediately adjacent to the edge at jj=0 are highlighted in Figure 3 with the two dotted
lines (---). These are labeled as SeL and SeR for the S values at the edge on the left and the right of the edge. The
horizontal solid lines in Figure 3 (¾¾) show the average S values for the left and the right sides calculated by excluding
the S values immediately adjacent to the edge. These are labeled as SmL and SmR in Figure 3. The edge enhancement
metrics for the left and the right side of the edge are simply the difference between the dotted and solid lines in Figure 3.
Equations (1) and (2) define the edge enhancement magnitudes as EdgeR and EdgeL. Note that positive values of
enhancement are defined for both edges.
Analysis of the Edge Effect of http://www.cis.rit.edu/research/thesis/bs/2001/gunawan/thesis.htm#intro
EdgeR = SeR-SmR (1)
[image:12.612.107.503.304.513.2]EdgeL = SmL-SeL (2)
Figure 3: Edge Enhancement Measurement.
(o-o-o-o-)Data on the right side of the edge.
(x-x-x-x-) Data on the left side of the edge.
(---) Reference lines showing S values nearest the edge.
(¾¾¾)Reference lines showing the mean S for each side.
3. The Impact of Noise from Halftone Algorithm
The Root Mean Square deviation between the mean level SmR and the individual S values is defined by
equation (3) as NoiseR. This is a measure of the noise associated with the halftone algorithm on the right side of the
edge. Similarly, equation (4) defines the noise of the algorithm on the left side of the edge. The value of k is the number
of S values used in the calculation. If edge artifacts on the extreme left or right of the image were observed, those pixels
were excluded from the calculation.
Analysis of the Edge Effect of http://www.cis.rit.edu/research/thesis/bs/2001/gunawan/thesis.htm#intro
(4)
The ratio of edge enhancement to RMS noise for the right side of the edge is defined as SNRR as shown in
equation (5). Similarly SNRL is defined in equation (6). These metrics are used to compare the edge enhancement
characteristics of different halftone algorithms, as described in the Results section of this report. In addition, and overall
enhancement metric was defined as SNRt as shown in equation (7).
(5)
(6)
(7)
In many cases unsymmetrical edge enhancement effects that were observed occur on the junction;
therefore, the difference between SNRR and SNRL is defined as a metric of asymmetry as shown in equation (8).
ASYM = SNRL - SNRR (8)
This definition of ASYM is negative if the right side of the edge is enhanced more than the left side. ASYM =
0 if there is no edge enhancement, and >0 if the left side is enhanced more than the right side.
Results
A. Floyd-Steinberg Error Diffusion
The edge enhancement metric was applied to several different samples to see whether or not it is a useful
analytical metric. Each sample represented a different type of error diffusion. The edge enhancement metric was
compared to what was observed visually. If a sample gave a visual impression of higher edge enhancement, it was
expected that the analytical metrics of edge enhancement also would be higher.Traditional error diffusion and
omni-directional error diffusion based on Linear Pixel Shuffling were used to generate the samples. Visual inspection of
the halftone images was done by displaying the images on a CRT monitor. Analysis of the edge enhancement metrics
was performed on the bitmap files directly, and none of the images were actually printed for analysis. Thus, all edge
effects reported in this report are due to the error diffusion algorithms and not to printer artifacts. The printed images
Analysis of the Edge Effect of http://www.cis.rit.edu/research/thesis/bs/2001/gunawan/thesis.htm#intro
Figure 4: Error Diffusion Sample 1
Figure 4. is the simplest example of the error diffusion technique, where the error is only spread to the next
successive pixel. Visual examination of the resulting edge image did not show a visually significant enhancement, and
the edge metrics agree with this observation. Thus, edge enhancement requires more than simply forward diffusion of
error. It requires a more involved distribution of error.
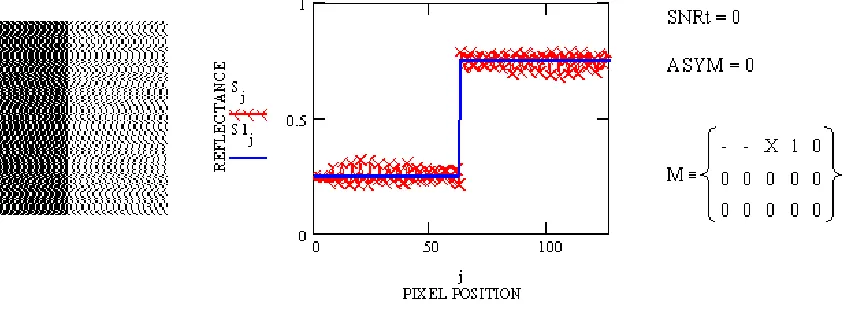
Figure5: Error Diffusion Sample2
Figure 5. illustrates the results for the most commonly used form of the Floyd-Steinberg algorithm. The
matrix, M, shows the amount of error that is spread from the location of the pixel being processed, X, to its neighbors.
As we expected, the Floyd-Steinberg algorithm gives a significant edge enhancement. The edge enhancement metric,
SNRt, says the edge is significantly enhanced relative to noise, and t he ASYM metric tells us enhancement occurs
primarily on the right side of the edge. This agreed well with visual inspection. The lack of significant edge effect on the
right side of the edge is somewhat surprising since some error is passed to the left of the X location. However, only
3/16th of the error is passed to the left, and the left edge is not enhanced significantly relative to the noise power of the
left gray level. The magnitude and direction of the edge effect is consistent with these authors visual observations.
Analysis of the Edge Effect of http://www.cis.rit.edu/research/thesis/bs/2001/gunawan/thesis.htm#intro
If Figure 6 the error is diffused only in the forward direction, but unlike Figure 4. it is diffused equally to the
next two pixels.Somewhat unexpectedly, this produces an edge enhancement that is significantly greater than that
shown in Figure 4.The asymmetry of the edge effect makes sense intuitively because error is diffused in only one
[image:15.612.100.522.20.177.2]direction.The analytical results were found to be in agreement with the authors visual assessment.
Figure 7: Error Diffusion Sample 4
Figure 7 shows another a Floyd-Steinberg type system in which error was diffused equally to the right and
to the left. The edge effect, SNRt, is quite large for this example, and enhancement is quite symmetrical.Again this
result agrees with visual observation and makes sense intuitively.However, close inspection of the sample illustrated in
Figure 7 suggested to this author that there may be cases in which the edge is enhanced too much.The degree of edge
enhancement desirable in a halftone algorithm may depend on the addressability of the printer and the printer transfer
function.This is a topic appropriate for an additional project and was not further explored here.
B. Omni-Directional Error Diffusion
The results of the analysis using different error diffusion kernels with the well known technique of
Floyd-Steinberg demonstrates the usefulness of the analytical metrics developed in this project for measuring edge
[image:15.612.118.526.298.471.2]Analysis of the Edge Effect of http://www.cis.rit.edu/research/thesis/bs/2001/gunawan/thesis.htm#intro
type of error diffusion algorithm recently developed by Prof. Peter Anderson of the RIT Computer Science Department
(5). This new error diffusion technique is referred to as omni-directional because it is capable of diffusing error in all spatial directions around the central pixel, X, being processed.This is possible because the technique is not an ordinary
raster process but a process that addresses the pixels in the image in a pseudo-random way.The pixels are each
addressed once, but only once.When each pixel, X, is processed, the error is diffused according to a kernel that allows
error to be passed in any direction.Figure 8 provides an illustration.Note the error kernel allows diffusion of fractional
error in all directions from the central pixel.Although error can be diffused in all spatial directions, only examples
showing diffusion toward the right and down were examined in this project.Future work will include an examination of
[image:16.612.115.488.261.402.2]error diffusion in all directions simultaneously.
Figure 8: Linear Pixel Shuffling Sample1
The results shown in Figure 8 illustrate edge enhancem ent on one side of the edge but not the other, as one
would expect for and asymmetric diffusion kernel.However, the edge in this example was oriented horizontally as
shown so that the error in the kernel that was diffused in the down direction toward the dark side of the image. As
predicted, the dark side of the edge was enhanced.
In order to further analyze the edge effect in the Lin ear Pixel Shuffling algorithm, the edge was rotated 180
degrees and processed with the same kernel, as shown in Figure 9. Again the result was found in agreement with what
was expected and it was predictable as it also enhanced the light side of the edge. The analytical results were also found
to make sense intuitively.
Analysis of the Edge Effect of http://www.cis.rit.edu/research/thesis/bs/2001/gunawan/thesis.htm#intro
The effects of edge enhancement found for the omni-direction algorithm were further examined by changing
the mean gray level of the two sides of the edge.As shown in Figure 10, a reduction in the gray level difference between
the two levels significantly reduced the amount of edge enhancement. That edge enhancement would vary with the size
of the edge step makes intuitive sense.If the two edges are of the same gray level, certainly no edge enhance ment will
[image:17.612.111.495.30.169.2]occur.
Figure 10: Linear Pixel Shuffling Sample 3
Discussion
Edge enhancement effects are often observed in digital halftones, but little has been reported in the
literature on techniques for quantitative analysis of the effect. This project provides a metric that is useful for measuring
the edge effect of halftone algorithms that correlates well with these authors visual observations.The metric is calculated
directly in the spatial domain using average pixel magnitudes in the region of the edge.The metric calculated an edge
effect for each side of the edge relative to the noise power in the gray level adjacent to the edge.
Attempts were made during the project to extract useful information form frequency analysis of the edges and
the halftone noise.However, the signal/noise for metrics defined in the frequency domain were not found to be useful or
Analysis of the Edge Effect of http://www.cis.rit.edu/research/thesis/bs/2001/gunawan/thesis.htm#intro
exclusively on the metrics defined in the spatial domain, as described in the body of this report.
In application of the edge analysis technique to sever al traditional Floyd-Steinberg halftones, the results
demonstrated the utility and reliability of the analytical technique. Thus, the technique was applied to an entirely new
class of error diffusion halftones developed by Prof. Peter Anderson (5).The results also agreed entirely with visual observations of the authors.
Edge enhancement effects were not always observed to occur over only a single pixel.Indeed, when error was
diffused over a distance of two pixels from the central X pixel, enhancement was often observed to occur in the two
pixels next to the edge.Moreover, visual inspection seems to suggest that edge effects, even for diffusion of error by
only one pixel dimension, can extend beyond one pixel location.In some cases the data seemed visually to suggest
behavior similar to an exponential decay in edge enhancement at increasing distances from the edge.Since in most cases
the edge/noise ratio declined nearly to 1:1 even at the second pixel a way form the edge, the results of this analysis were
unable to provide statistically significant evidence for this decaying edge effect.To demonstrate such an effect this
analysis will have to be applied to edge images over a significantly g reater number of pixels.
Conclusion
The objective of the project was to determine whether a convenient analytical metric could be developed that
would provide researchers with a tool for calculating the degree of edge enhancement for any given halftone algorithm.
The results of the project strongly indicate this can be achieved. The metrics and procedures developed in this project
were shown to correlate with the visual impression of edge enhancement made by the author. To demonstrate the utility
of the analysis, it was applied to an entirely different and new kind of halftone algorithm developed by Prof. Peter
Anderson (5). The results again agreed entirely with the author's visual evaluatio n, and this strongly indicates the analysis is capable of providing useful guidance in halftone development projects. Indeed, plans are being made to
applying this analysis to the development and evaluation of new halftone algorithms.
Unsymmetrical edge enhancement effects will continue to be examined. In particular, attempts are planned to
examine the quantitative relationship between the percent and direction of error diffusion and the magnitude and
direction of edge enhancement.The hope is to develop a catalog of experience that will serve as a guide in selecting
halftone patterns for particular applications.The study also is expected to lead to insights about the causative
relationships between edge enhancement and the error kernel distribution.
Analysis of the Edge Effect of http://www.cis.rit.edu/research/thesis/bs/2001/gunawan/thesis.htm#intro
Another very interesting, but still very tentative, ob servation is that edges are enhanced over a distance of
more than one pixel location, even when error is diffused only by one pixel location.The first necessity will be to verify
whether or not this effect is real.This will require significantly larger edge images of significantly more pixels.However,
if the edge effect does decay as one moves several pixels from the edge, then it may be possible to impose some shape
on the edge decay curve by designing diffusion kernels appropriately. This would be of particular use as the technology
of computer printers achieves higher addressability.
The success of the edge enhancement metrics described in this report will lead to significant research
opportunities in the field of hard copy imaging and halftone algorithm development.Thus, the project has clearly
achieved its goal, and as a result many new project opportunities have been developed.
Reference http://www.cis.rit.edu/research/thesis/bs/2001/gunawan/reference.htm
Reference
1. R. Eschbach and K.T. Knox, “Error Diffusion Algorithm with Edge Enhancement”, J. Opt. Soc. Am.
A8(12), 1844-1850 (1991).
2. Keith T. Knox, “Error Image in Error Diffusion”, Digital Halftoning,
Vol.154, pp. 93-104,1999.
3. L. Kurz and M. H. Benteftifa, “Analysis of Variance in Statical Image Processing”, Cambridge University,
USA, 1997.
4. R. W. Floyd and L. Steinberg, “An Adaptive Algorithm for Spatial Grayscale”, Proceedings of the SID,
1976.
5. Peter G. Anderson, “Linear Pixel Shuffling”, Imagination, Vol.1, Issue 4, 2001.
6. Ross McCluney, “Introduction to Radiometry and Photometry”, Artech House, MA, 1994.
7. Keith T. Knox, “Edge Enhancement in Error Diffusion”, SPSE Annual Meeting, Boston, May 1989.