RESEARCH ARTICLE
A web-oriented software for the
optimization of pooled experiments in NGS
for detection of rare mutations
Daniela Evangelista
1*, Antonio Zuccaro
2, Algirdas Lančinskas
3, Julius Žilinskas
3and Mario R. Guarracino
1Abstract
Background: The cost per patient of next generation sequencing for detection of rare mutations may be signifi-cantly reduced using pooled experiments. Recently, some techniques have been proposed for the planning of pooled experiments and for the optimal allocation of patients into pools. However, the lack of a user friendly resource for planning the design of pooled experiments forces the scientists to do frequent, complex and long computations. Results: OPENDoRM is a powerful collection of novel mathematical algorithms usable via an intuitive graphical user interface. It enables researchers to speed up the planning of their routine experiments, as well as, to support scientists without specific bioinformatics expertises. Users can automatically carry out analysis in terms of costs associated with the optimal allocation of patients in pools. They are also able to choose between three distinct pooling mathematical methods, each of which also suggests the optimal configuration for the submitted experiment. Importantly, in order to keep track of the performed experiments, users can save and export the results of their experiments in standard tabular and charts contents.
Conclusion: OPENDoRM is a freely available web-oriented application for the planning of pooled NGS experiments, available at: http://www-labgtp.na.icar.cnr.it/OPENDoRM. Its easy and intuitive graphical user interface enables researchers to plan theirs experiments using novel algorithms, and to interactively visualize the results.
Keywords: Pooled experiments, Rare mutation, Next generation sequencing, High-throughput data
© 2016 Evangelista et al. This article is distributed under the terms of the Creative Commons Attribution 4.0 International License (http://creativecommons.org/licenses/by/4.0/), which permits unrestricted use, distribution, and reproduction in any medium, provided you give appropriate credit to the original author(s) and the source, provide a link to the Creative Commons license, and indicate if changes were made. The Creative Commons Public Domain Dedication waiver (http://creativecommons.org/ publicdomain/zero/1.0/) applies to the data made available in this article, unless otherwise stated.
Background
Next generation sequencing (NGS) is a recent approach that has begun a real revolution in genomics. It allows researchers to study biological systems to a level hitherto impossible, enabling numerous groundbreaking discover-ies such as detection of rare causative mutations involved in genetic diseases [1]. Nevertheless, independently from the platforms used, its widespread diffusion is inhibited by the remarkable cost [2]. A possible solution is to pool more samples together, although subsequent Sanger sequencing is needed for the assignment of the mutation
to the patient. The detection of rare mutations in indi-vidual patients grouped into pools could be more effi-ciently discovered. Indeed, the pooling techniques are aimed to examine a set of DNA samples from a group of individuals in order to ascribe the identified mutations to a specific patient. A classical protocol dedicated to the detection of mutation defines that for each individual patient to be tested, each exon—or few closely located exons—is PCR amplified and then assayed [3]. In light of these considerations, in the statistical literature, is easy to find a large number of papers which refer to the usage of pools or groups of samples to identify individuals or to estimate the prevalence of such a rare characteristic [4–
7] in literature, the lack of user-friendly software makes difficult for researchers to plan pooled NGS experiments without consulting a large number of of papers [8–10] to find the best method for their own needs, or without
Open Access
*Correspondence: [email protected]
1 LabGTP (Laboratory of Genomics, Transcriptomics and Proteomics), Institute for High Performance Computing and Networking (ICAR), National Research Council (CNR), Via Pietro Castellino 111, 80131 Naples, Campania, Italy
performing troublesome computations to evaluate the costs. We propose OPENDoRM (optimization of pooled experiments in NGS for detection of rare mutations), a new web tool for planning NGS experiments with a sim-ple graphical user interface (GUI). It provides flexibility to the users for automatically carrying out analysis in terms of costs associated with the optimal allocation of patients in pools, suggesting also the optimal configura-tions of their experiments. The OPENDoRM structure can be split into four components: (i) global settings for the NGS experiment; (ii) data processing; (iii) vis-ual exploration; (iv) data interpretation. It is able to: (i) describe the pooling of high-throughput generated data using four different algorithms; (ii) identify the optimal number of patients in each pool with respect to minimi-zation of the cost of the experiment; (iii) generate easy-to-read reports and charts for better understanding the planning of the experiments.
Methods
OPENDoRM design
Leading studies using pooled experiments in several genetic and genomic applications can be found in [8–
10] . Nevertheless, their limit is that no evaluation has been done to assess the group size of the pools and the associated cost with the experiment and its biological val-idation. OPENDoRM is the first all-in-one web resource for planning pooled NGS experiments with or without control pools. Its structure consists of eight main sec-tions. The Pooling section represents the web portal core. From this section, users can access to the Methods list page in which three distinct strategies are implemented: (i) without Replica; (ii) with Replica and (iii) Hybrid; and four algorithms are present: (i) NoReplica; (ii) OptRep-lica; (iii) Transposition and (iv) DiagWalks.
Algorithms description
Although the original algorithms of the first two strate-gies are inspired and thoroughly described in a previ-ous work [11] we believe is useful to provide the main details of each of them, before to introduce the Hybrid algorithm, named DiagWalks, which has been specifically developed for this web-oriented software.
Since we propose a technique to plan NGS pooled experiments, we consider worthwhile take into account experimental setting-out without or with replication of the patients. NoReplica belongs to the Without Rep-lica strategy. Here, each patient might bring at most Nm rare mutations. All n patients can be allocated in p pools consisting of m1, … , mp patients and where
each pool is restricted by a maximum number mmax of patient. In this case all found mutations need to be assigned to patients present in the pool. OptReplica and
transposition belong to the With Replica strategy. The first one can be described as: allocate each patient in both the first pool that is not yet completely filled, and in the first pool with the smallest number of allocated patients. The second one is based on the concept of transposition matrix where patients are properly distributed into main pools and replicated pools. This approach can be applied if the maximum number of patients allowed in a sin-gle pool is greater than or equal to the number of main pools and by taking into account the two constraints: (i) the number of replicated pools cannot be larger than the total number of patients; and (ii) the number of repli-cated pools cannot be smaller than number of patients in the largest main pool.
DiagWalks algorithm
DiagWalks is a hybrid method since, respect to the pre-vious algorithms, it exploits both control pools (i.e. OptReplica and Transposition methods) and Sanger tests (i.e. NoReplica method). The main goal of DiagWalks is to start the sequencing of pools as soon as patient’s sam-ples are available while not increasing significantly the overall costs (pm+pc) · c1+(pat · c2). The total cost CT of
the experiment is calculated as:
where j = 1, 2,. . .,nmut is the number of control pools in which there are more than one patient in common with any of the main pools, pm is the number of main pools, pc is the number of control pools, c1 is the cost of a
single pool for NGS, c2 is the cost of a single Sanger test,
Nm is the number of mutations to detect and patj2 is the number of patients in common between a main pool and j-th control pool elevated to the second power.
The workings of DiagWalks is moving diagonally upwards, from left to right, along the main pools matrix, each time replicating the current patient inside the con-trol pools matrix, which is scanned moving from the top to the bottom along the rows and moving from left to right along the columns. It can be summarized as follows:
1. The starting point of DiagWalks is always the top left corner (1,1) of the main pools matrix. This patient is replicated in position (1,1) of the control pools matrix
2. The scanning sequence moves onto position (2,1) of the main pools matrix. This patient also gets repli-cated in position (2,1) of the control pools matrix 3. At this point, the first diagonal walk begins. The
scan-ning sequence continues moving diagonally upwards moving from left to right. Position (1,2) of the main
(1) CT =(pm+pc)·c1+
nmut
j=1
pools matrix is reached. This patient is inserted in position (2,1) of the control pools matrix
Each diagonal walk stops when one of the two follow-ing conditions is met:
1. The number of patients already inserted in a con-trol pool is equal to the poolsize (i.e. three patients already inserted in a control pool with its pool-size being equal to three). In this case, the scanning sequence will restart from the first patient who has not been replicated yet who can be found scanning the main pools matrix starting from position (1,1) and moving from the top to the bottom along the rows and from left to right along the columns. Once this patient is found and replicated, the scanning sequence will move diagonally upwards along the main pools matrix, the first patient of each new scan-ning sequence being inserted into a new control pool 2. The number of patients already inserted in a con-trol pool is less than the poolsize (i.e. three patients already inserted in a control pool with its poolsize being equal to five). The current position of the
scan-ning sequence in the main pools matrix, however, is such that it does not allow for a diagonal walk either because it would get outside the “bounds” of the matrix or because it would end up on a patient who has already been replicated. In this case, the scanning sequence restarts from the first patient who has not been replicated yet who can be found scanning the main pools matrix moving from the current position from left to right and from the top to the bottom.
Finally, the following strategy is adopted: if the num-ber of patients who still need to be replicated is greater than the remaining empty locations of the control pools matrix, a new control pool is added. If, instead, the num-ber of patients who still need to be replicated is less than the remaining empty locations of the control pools matrix, they get replicated along the same control pool.
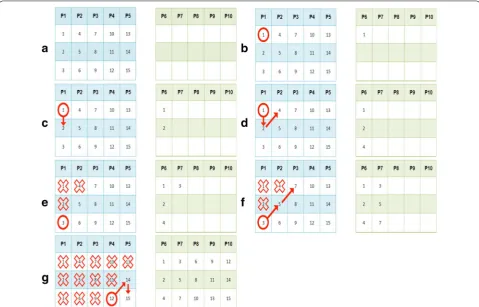
Let us assume we have a court of 15 patients and a poolsize equal to 3 (see Fig. 1a). The starting condition is the following: (i) the first step is starting from patient 1 in the main pools matrix and replicating it in the exact same position in the control pools matrix (see Fig. 1b); (ii) the next step is moving onto patient 2 of the main
[image:3.595.58.538.394.701.2]pools matrix and replicating it in the exact same posi-tion in the control pools matrix (see Fig. 1c); (iii) the first diagonal walk begins, scanning the main pools matrix moving diagonally upwards from left to right. The sequence ends up on patient 4 of the main pools matrix, which is replicated in the final empty location of P6 (see Fig. 1d); (iv) condition 1 explained before is met: the control pools has no more empty locations. The scan-ning sequence will restart from the first patient who has not been replicated yet and who can be found scanning the main pools matrix starting from position (1,1) and moving from the top to the bottom along the rows and from left to right along the columns. Patient 3 is found and replicated in the first empty location of P7 (see Fig. 1e); (v) the main pools matrix is scanned moving diagonally upwards, thus finding and replicating patients 5 and 7 (see Fig. 1f); (vi) by replicating patients in this way, the control pools matrix is therefore completed (see Fig. 1g).
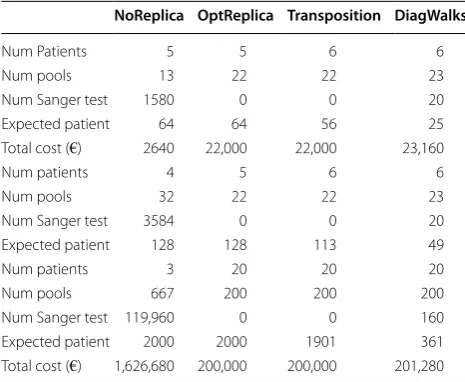
In order to appreciate the benefits of DiagWalks — as evidenced by experiments carried out during the test-ing phase (Table 1) — a suitable example is represented by the third case study in which a court of 2000 patients, the capacity of a single pool equal to 20 and 20 expected mutations were used.
The web‑oriented software description
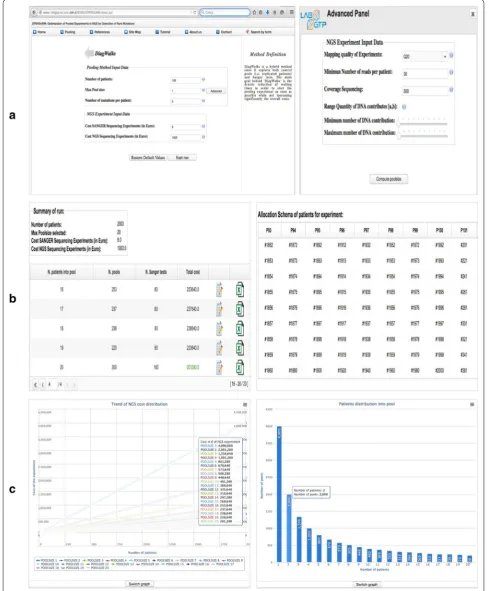
For the setting of the experiment we offer several options, which can be easily modified via textboxes and buttons. The input data depend on the selected methods, the pro-posed Parameter Box is split in two parts (see Fig. 2a), the first one containing: (i) number of patients; (ii) max pool size; (iii) expected number of mutation per patient; (iv) sanger cost and (v) NGS cost. An advanced panel for skilled users has also been developed. In order to refine the outcomes of the experiment, it is possible to custom-ize the parameters settings by considering the second parameters box: (vi) mapping quality of experiments; (vii) minimum number of reads per patient; (viii) cover-age sequencing; (ix) range quantity of DNA contributes. The user can choose to modify certain or all of the above-mentioned parameters and, depending on the selection, a different result is returned. In order to guide the user and provide plausible outcomes, all the parameters are enclosed into tolerance intervals, with the exception of (ii–iii) parameters which can be manually typed on the basis of specific needs. Once the simulation is over, the user is provided with a complete overview of the results viewable in the summary of run and allocation schema of patients windows (see Fig. 2b). In the first one, depending on the input parameters, the system returns all the pos-sible configurations of patients’ distribution into pools, with the related costs. The best configuration is auto-matically highlighted in green. The other panel shows the way in which the system has arranged the patients for that specific configuration, which can be consulted in detail by clicking the related button. OPENDoRM pro-vides easy-to-read tables and interactive charts for better understanding the results (see Fig. 2c). Users can export the results of their experiments in xls format for tabular contents and png/jpg/svg/pdf for the charts. Moreover, we provide an in-depth user manual of operating princi-ples of the methods (see Additional file 1).
The implementation
The software has been implemented in a modular way, therefore, it can also be adopted by scientists with low expertise in the design of pooled NGS experiments. The OPENDoRM application has been developed using the ZK framework [12] and J2EE [13] (Java 2 Platform Enter-prise Edition) technologies. ZK framework and Ajax technique with XUL/XHTML (XML user interface lan-guage/eXtensible hypertext markup language) have been used to design the GUI, taking advantage of their widely used toolkits [14]. The charts displayed at the end of each pooling method simulation were created using ZK charts, which makes visualization of data easy to understand for the end users. It is fully integrated with ZK, thus allowing for a complete control over charts in pure Java.
Table 1 Comparison of the performance of the four algo-rithms implemented in OPENDoRM
Case study 1: The input parameters are: number of patients = 64; max Poolsize = 6; number of mutations to detect = 5; cost of a single Sanger test = €8; cost of a single pool for NGS = €1000. Case study 2: The input parameters are: number of patients = 128; max Poolsize = 8; number of mutations to detect = 7; cost of a single Sanger test = €10; cost of a single pool for NGS = €1000. Case study 3: The input parameters are: number of patients = 2000; max Poolsize = 20; number of mutations to detect = 20; cost of a single Sanger test = €8; cost of a single pool for NGS = €1000
NoReplica OptReplica Transposition DiagWalks
Num Patients 5 5 6 6
Num pools 13 22 22 23
Num Sanger test 1580 0 0 20 Expected patient 64 64 56 25 Total cost (€) 2640 22,000 22,000 23,160
Num patients 4 5 6 6
Num pools 32 22 22 23
Num Sanger test 3584 0 0 20 Expected patient 128 128 113 49
Num patients 3 20 20 20
[image:4.595.56.289.466.657.2]Results
Validation and testing
The current version of OPENDoRM implements three algorithms and features a new one, DiagWalks. It signifi-cantly reduces the waiting times—that is, the starting of NGS sequencing between one group of patients and the next one—without creating a considerable economic gap with the other considered methods [11]. The results obtained for, respectively, NoReplica, OptReplica, Transposition and DiagWalks are reported in Table 1. It can easily gather that if, on one hand, the DiagWalks algorithm easily evaluates large courts of patients, on the other hand, it also provides a significant improve-ment in terms of reducing waiting times. Indeed, it is only necessary to wait for 361 patients’ samples against the 1901 proposed by the Transposition algorithm, while for OptReplica it is always necessary to wait for all samples. The considerably high costs required by NoReplica make the choice of this methodology the least preferred. The additional charge of 1280 € needed by DiagWalks planning (which, as has been evidenced by other case studies, can be quite lower depending upon the input data) is considered negligible compared to the benefits obtained in terms of reduction of waiting times.
The results achieved through the usage of this power-ful software can be a springboard for helping scientists in addressing the problem of detecting rare causative muta-tions in pooled experiments [15].
Conclusion
OPENDoRM is the first web tool for planning of pooled NGS experiments. Written in a modularized style, it can be easily expanded and can provide flexibility to the users for automatically carrying out analysis in terms of costs associated with the optimal allocation of patients in pools. Users are able to choose between three distinct mathematical methods—Without Replication, With Replication and Hybrid—each of which also suggests the optimal configuration of the sequencing experi-ment. The results cannot be compared neither with others obtained in the past nor with other scientific articles since, to the best of our knowledge, in literature there is no other tool with the same aim. For these rea-sons, OPENDoRM represents a completely innovative approach.
The web resource will be regularly updated on the basis of the progress of our study.
Availability and requirements
• Project name: A web-oriented software for the opti-mization of pooled experiments in NGS for detection of rare mutations
• Project home page: http://www-labgtp.na.icar.cnr.it/ OPENDoRM
• Operating system(s): Platform independent
• Programming language: Java and XHTML
• Other requirements: no requirement needed
• License: no licence needed
• Any restrictions to use by non-academics: no restric-tion needed
Availability of data and materials
All supporting data are included within the manuscript and its additional files.
Abbreviations
OPENDoRM: optimization pooled experiments NGS for detection of rare muta-tions; DNA: deoxyribonucleic acid; PCR: polymerase chain reaction; NGS: next generation sequencing; GUI: graphical user interface; J2EE: java 2 platform enterprise edition; XUL: XML user language; XHTML: eXtensible hypertext markup language.
Authors’ contributions
MRG and DE designed the study, collected the data, performed the analysis and wrote the manuscript; AZ developed the new algorithm and the software; JZ and AL developed the Matlab prototype code of the other algorithms and gave precious suggestions about the methodologies. All authors read and approved the final manuscript.
Author details
1 LabGTP (Laboratory of Genomics, Transcriptomics and Proteomics), Institute for High Performance Computing and Networking (ICAR), National Research Council (CNR), Via Pietro Castellino 111, 80131 Naples, Campania, Italy. 2 Department of Computer Science, University of Naples Parthenope, Via Amm. F. Acton, 80133 Naples, Italy. 3 Institute of Mathematics and Informatics, Vilnius University, Akademijos 4, 08663 Vilnius, Lithuania.
Acknowledgements
This work was funded by INTEROMICS flagship Italian project, PON02-00612-3461281 and PON02-00619-3470457. It also was funded by a grant No.MIP-051/2014 from the Research Council of Lithuania. Mario R. Guarracino work has been conducted at National Research University Higher School of Economics and supported by RSF grant 14-41-00039. Antonio Zuccaro has conducted this work during an undergraduate training period at LabGTP. The research group would like to thank Gennaro Oliva and Giuseppe Trerotola for technical assistance to the web resource and to the laboratory.
Competing interests
The authors declare that they have no competing interests.
Received: 10 June 2015 Accepted: 27 January 2016
References
1. Schmitt MW, Kennedy SR, Salk JJ, Fox EJ, Hiatt JB, Loeb LA. Detection of ultra-rare mutations by next-generation sequencing. 2012. doi:10.1073/ pnas.1208715109.
Additional file
• We accept pre-submission inquiries
• Our selector tool helps you to find the most relevant journal
• We provide round the clock customer support
• Convenient online submission
• Thorough peer review
• Inclusion in PubMed and all major indexing services
• Maximum visibility for your research
Submit your manuscript at www.biomedcentral.com/submit
Submit your next manuscript to BioMed Central
and we will help you at every step:
2. Lin L, Yinhu L, Siliang L, et al. Comparison of next-generation sequencing systems. J Biomed Biotechnol. 2012. doi:10.1155/2012/251364. 3. Amos CI, Frazier ML, Wang W. Dna pooling in mutation detection with
ref-erence to sequence analysis. Am J Hum Genet. 2000. doi:10.1086/302894. 4. Dorfman R. The annals of mathematical statistics. Ann Math Stat. 1943.
doi:10.1214/aoms/1177731363.
5. Gastwirth JL. The efficiency of pooling in the detection of rare mutations. Am J Hum Genet. 2000. doi:10.1086/303097.
6. Tu XM, Litvak E, Pagano M. On the informativeness and accuracy of pooled testing in estimating prevalence of a rare disease: application to hiv screening. Biometrika. 1995. doi:10.2307/2337408.
7. Brookmeye R. Analysis of multistage pooling studies of biological speci-mens for estimating disease incidence and prevalence. Biometrics. 1999. doi:10.1111/j.0006-341X.1999.00608.x.
8. Wang T, Pradhan K, Ye K, Wong L, Rohan T. Estimating allele frequency from next-generation sequencing of pooled mitochondrial dna samples. Front Genet. 2011. doi:10.3389/fgene.2011.00051.
9. Calvo SE, Tucker EJ, Compton AG, Kirby DM, Crawford G. High-through-put, pooled sequencing identifies mutations in nubpl and foxred1 in human complex i deficiency. Nat Genet. 2011. doi:10.1038/ng.659.
10. Futschik A, Schlotterer C. The next generation of molecular markers from massively parallel sequencing of pooled dna samples. Genetics. 2010. doi:10.1534/genetics.110.114397.
11. Zilinskas J, Lancinskas A, Guarracino MR. Application of multi-objective optimization to pooled experiments of next generation sequencing for detection of rare mutations. PLoS One. 2014. doi:10.1371/journal. pone.0104992.
12. The best open source java framework for building enterprise web and mobile apps. http://www.zkoss.org/product/zk
13. J2EE the standard in community-driven enterprise software. http://www. oracle.com/technetwork/java/javaee/overview/index.html
14. Tripathi KP, Evangelista D, Zuccaro A, Guarracino MR. Transcriptator: an automated computational pipeline to annotate assembled reads and identify non coding rna. Plos One. 2015. doi:10.1371/journal. pone.0140268.