RESEARCH ARTICLE
Targeted amplification
for enhanced detection of biothreat agents
by next-generation sequencing
Shea N. Gardner
1†, Kenneth G. Frey
2,3†, Cassie L. Redden
2,3, James B. Thissen
1, Jonathan E. Allen
1,
Adam F. Allred
4, Matthew D. Dyer
4, Vishwesh P. Mokashi
2and Tom R. Slezak
1*Abstract
Background: Historically, identification of causal agents of disease has relied heavily on the ability to culture the organism in the laboratory and/or the use of pathogen-specific antibodies or sequence-based probes. However, these methods can be limiting: Even highly sensitive PCR-based assays must be continually updated due to signature degradation as new target strains and near neighbors are sequenced. Thus, there has been a need for assays that do not suffer as greatly from these limitations and/or biases. Recent advances in library preparation technologies for Next-Generation Sequencing (NGS) are focusing on the use of targeted amplification and targeted enrichment/ capture to ensure that the most highly discriminating regions of the genomes of known targets (organism-unique regions and/or regions containing functionally important genes or phylogenetically-discriminating SNPs) will be sequenced, regardless of the complex sample background.
Results: In the present study, we have assessed the feasibility of targeted sequence enhancement via amplifica-tion to facilitate detecamplifica-tion of a bacterial pathogen present in low copy numbers in a background of human genomic material. Our results indicate that the targeted amplification of signature regions can effectively identify pathogen genomic material present in as little as 10 copies per ml in a complex sample. Importantly, the correct species and strain calls could be made in amplified samples, while this was not possible in unamplified samples.
Conclusions: The results presented here demonstrate the efficacy of a targeted amplification approach to biothreat detection, using multiple highly-discriminative amplicons per biothreat organism that provide redundancy in case of variation in some primer regions. Importantly, strain level discrimination was possible at levels of 10 genome equiva-lents. Similar results could be obtained through use of panels focused on the identification of amplicons targeted for specific genes or SNPs instead of, or in addition to, those targeted for specific organisms (ongoing gene-targeting work to be reported later). Note that without some form of targeted enhancement, the enormous background present in complex clinical and environmental samples makes it highly unlikely that sufficient coverage of key pathogen(s) present in the sample will be achieved with current NGS technology to guarantee that the most highly discriminating regions will be sequenced.
Keywords: Targeted amplification, Biodefense, Next Generation Sequencing
© 2015 Gardner et al. This article is distributed under the terms of the Creative Commons Attribution 4.0 International License (http://creativecommons.org/licenses/by/4.0/), which permits unrestricted use, distribution, and reproduction in any medium, provided you give appropriate credit to the original author(s) and the source, provide a link to the Creative Commons license, and indicate if changes were made. The Creative Commons Public Domain Dedication waiver (http://creativecommons.org/ publicdomain/zero/1.0/) applies to the data made available in this article, unless otherwise stated.
Open Access
*Correspondence: [email protected]
†Shea N. Gardner and Kenneth G. Frey contributed Equally
Background
Nucleic acid based methods of pathogen detection, such as PCR, although robust and sensitive, are often subject to false positive and false negative readings. False positive errors are often due to detection of a closely related near neighbor species, a trend observed with biothreat agents [1, 2]. False negative errors are frequently the result of levels of target nucleic acid at or below the sensitivity threshold [3]. Additionally, strain variation at the nucleo-tide level can lead to signature erosion. This is especially true in organisms with high mutation rates [4]. Although PCR-based assays are capable of strain designation, this often requires design of multiple primer and probe sequences [5]. Additionally, the number of primer pairs necessary to detect a large set of organisms or strains is often untenable or requires multiple rounds of primer design, complex bioinformatic software or both [6].
High-throughput next generation sequencing (NGS) has become a viable solution to many of these prob-lems. Detection of pathogens by NGS is not hampered by the constraints discussed above. NGS is relatively unbiased, not dependent on specific signature sequence information, and requires no a priori knowledge about a pathogen. In addition, NGS is culture-independent and requires only high-quality nucleic acid. However, NGS is not without drawbacks. Until recently, one of the major impediments to using NGS for point-of-need (PON) detection/diagnostics has been a large amount of time (≥7 days) from sample to answer as well as the techni-cal training and experience necessary to produce qual-ity sequence reads. In addition, NGS has conventionally required nucleic acid masses at least an order of magni-tude greater than a PCR-based assay. Finally, the labora-tory space requirements of the sequencer as well as the required ancillary equipment often precluded the use of NGS by all but the largest research groups.
The advent of benchtop sequencers with easy to use and streamlined workflows, such as the Ion Torrent™ Personal Genome Machine™, has alleviated many of these concerns. A number of recent clinical studies have shown the utility of benchtop NGS in identification and attribution of disease-causing microorganisms. Spe-cifically, NGS was used successfully to track nosocomial infection of soldiers returning from Afghanistan. In this case, standard typing techniques failed to distinguish between isolates, while NGS uncovered a number of single-nucleotide polymorphisms (SNPs) that allowed investigators to establish an epidemiologic chain [7]. More recently, using NGS, two groups were simulta-neously able to identify the causative agent of an out-break of enterohaemorrhagic Escherichia coli (EHEC) in patients in a National Institutes of Health (NIH) clinical ward. Another study showed the ability of NGS to rapidly
and precisely identify outbreak clusters of MRSA and Clostridium difficile [8]. However, these studies were per-formed with clinical isolates of the microbe in question, not by metagenomic sequencing of complex primary samples.
Multiple studies have documented the difficulties of current NGS platforms to yield confident species identi-fication for microbial agents in complex backgrounds [9, 10]. Most data to date from these projects indicate that the current NGS platforms using unbiased sequencing simply do not provide enough pathogen coverage over the background to provide even species-level identifi-cation. Simply put, bench-top NGS cannot sequence deeply enough into a complex environmental or clini-cal trace-level sample to provide even confident species identification, much less strain identification or pres-ence of specific known resistance/virulpres-ence factors [11, 12]. While NGS instruments like the Illumina® HiSeq can produce billions of reads, their long run times (i.e. >7 days) preclude obtaining actionable information quickly enough to guide a response to a public health cri-sis. Additionally, biases in read coverage result in areas of the genome with low, or no coverage, a trend that is prominent in AT-rich areas [13]. Finally, a large pro-portion of unbiased sequence reads will represent the ‘core genome’ of shared elements found in both patho-genic and benign organisms of closely related taxa. For instance, a study of an important zoonotic pathogen, Streptococcus suis, indicated that 876 genes comprised a Minimum Core Genome (MCG). Of medical signifi-cance, only 9 of 21 known virulence genes were shared among all strains of this species. Similarly, core genome estimates for several other organisms of medical interest ranged from 42.7 % (S. pneumoniae) to 15.5 % (H. pylori). It is important to note that these studies identified core elements of clonal isolates within a species [14, 15]. Thus, enhancement strategies that increase our ability to dis-criminate between closely-related organisms are needed.
However, these methods are not without limitations. Although 16S sequencing is widely accepted and consti-tutes a current ‘gold standard’ in molecular typing, it has low resolution and it has been shown that primer selec-tion can introduce bias in the resultant amplicons [20]. Sequence capture enrichment techniques are subject to long hybridization times and generally require probes that far exceed the length of PCR primers [21]. Moreo-ver, the bulk of capture-based enrichment technologies have emphasized the human genome (reviewed in [22]) rather than microbial pathogens. More recent develop-ment efforts have focused on use of multiplex PCR prior to sequencing. For instance, micro-droplet PCR has been shown to enable sequencing of nearly 4000 amplicons [23]. A number of studies have evaluated the efficacy of multiplex sequencing to characterize human disease as well as microbial strain differentiation [24–26]. Specifi-cally, Life Technologies’ (now Thermo Fisher Scientific) Ion AmpliSeq™ technology has been used for human SNP typing [25] and detection of genetic variation in human cardiomyopathy [26] among others. Ion AmpliSeq™ technology currently supports up to 6144 custom primer pairs for targeting custom regions. We have utilized the Life Technologies Ion AmpliSeq™ robust end-user cus-tomization capability to support other markets, such as pathogen detection, in addition to their standard exon and cancer biomarker panels.
Since no commercial panel for biothreat detection exists, we sought to design and test a custom AmpliSeq™ pilot panel targeting a limited number of microbial agents. For this proof of concept study we focused on organisms of concern to biodefense and public health, specifically microbes from CDC Bioterrorism Tier 1 (B. anthracis, Y. pestis, F. tularensis) and Tier 2 (B. pseu-domallei). In addition to determining the efficacy of our custom panel, we investigated the analytical sensitivity of the AmpliSeq™ protocol as applied to our mock clinical samples.
Results
Comparison of fragment libraries versus AmpliSeq™ libraries
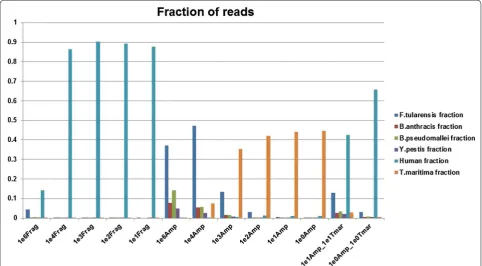
In every case, the AmpliSeq™ libraries demonstrated a sizable increase in the number of pathogen-specific reads with a concomitant reduction in human reads as compared to fragment libraries prepared from the same samples (Fig. 1). Specifically, the ratio of reads classified as human declined from as high as 0.9 in the fragment libraries to less than 0.1 in 6 of 8 AmpliSeq™ librar-ies (Compare 1e3 fragment library with 1e3 AmpliSeq library). For each of the four spike-in organisms, we noted an increase of at least 1 order of magnitude in pathogen reads in the AmpliSeq™ libraries when com-pared with the corresponding fragment library. This
[image:3.595.57.540.425.691.2]observation was especially striking in the 1e2 genomic equivalents (GE) samples (Additional file 1: Figure S1, Additional file 2: Figure S2, Additional file 3: Figure S3, Additional file 4: Figure S4). For instance, reads specific to B. pseudomallei improved from less than 100 in the fragment library to over 10,000 in the AmpliSeq™ library (Additional file 2: Figure S2).
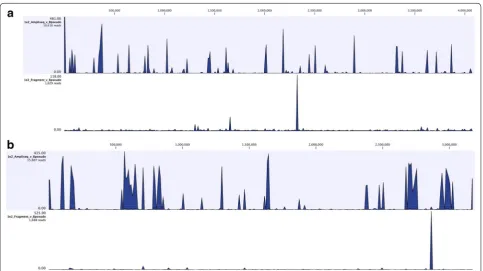
Specifically, at a spike-in level of 100 GE for B. pseu-domallei, the fragment library yielded a total number of reads that was at least one order of magnitude less than that for the AmpliSeq library (Fig. 2a, b). Although reads from the fragment library were spread over both chro-mosomes, the depth of coverage was low (<10×). In con-trast, reads from the AmpliSeq libraries were present at high coverage levels (>100×). Note that the AmpliSeq™ libraries result in species-specific reads distributed throughout the genome (Fig. 2a, b).
No reads corresponding to the spike-in organisms were present in fragment libraries at a spike-in level of less than 100 GE. Importantly, at spike-in levels corre-sponding to 10 and 1 GE, AmpliSeq™ libraries produced informative species-defining reads from all spike-in organisms. Conversely, fragment libraries were domi-nated by the human background. Finally, no sequence reads were classified as S. enterica, which served here as a negative amplification control.
Further, we observed that read depth was increased by orders of magnitude (Fig. 3) and an overwhelming major-ity of reads from the AmpliSeq™ libraries were able to be mapped to the highly-informative amplicons (Table 1). At the 1e2 spike level, the T. maritima positive control was the largest fraction of classified reads from the fragment library (Fig. 1), whereas the largest fraction of classified reads from the 1e4 spike fragment library was F. tular-ensis (Fig. 1). Interestingly, the second largest fraction of classified reads in the 1e3 spike samples was T. maritima even with a ten-fold increase of GEs versus that for the largest fraction, F. tularensis. This trend is also evident in 1e5 spike and 1e6 spike libraries. This suggests that bias exists in one of two steps in the fragment libraries: (1) Library construction or (2) Template amplification. There is also some preferential amplification evident in the AmpliSeq™ libraries as F. tularensis tended to be over-represented in both the read mapping and taxonomic classifications for the lower spike levels. Additional file 1: Figure S1, Additional file 2: Figure S2, Additional file 3: Figure S3, Additional file 4: Figure S4 show details of the reads mapping to B. anthracis, B. pseudomallei, Y. pestis, and F. tularensis for all of the unamplified and amplified spike-in samples.
It is well known that competition for reagents can impact amplification of a given target(s) in multiplex
[image:4.595.57.541.417.688.2]PCR [27]. In order to investigate the impact of reducing the amount of positive amplification control, we created and sequenced two samples with T. maritima present at the same spike-in level as the organisms of interest (1e1Amp_1e1Tmar and 1e0Amp_1e0Tmar). As shown in Fig. 1 (far right), the fraction of reads assigned to T. mar-itma was reduced while the fraction of reads assigned to the spike-in organisms was increased. This was especially prominent in the samples at a spike in level of 1e1 GEs. In each case, the number of reads assigned to the spike-in organisms spike-increased as compared to the same spike-spike-in level containing a greater level of the positive amplifica-tion control (Addiamplifica-tional file 1: Figure S1, Addiamplifica-tional file 2: Figure S2, Additional file 3: Figure S3, Additional file 4:
Figure S4). This demonstrates that the amount of positive control used may need to be considered depending on the desired limit of detection.
Comparison of SNP typing
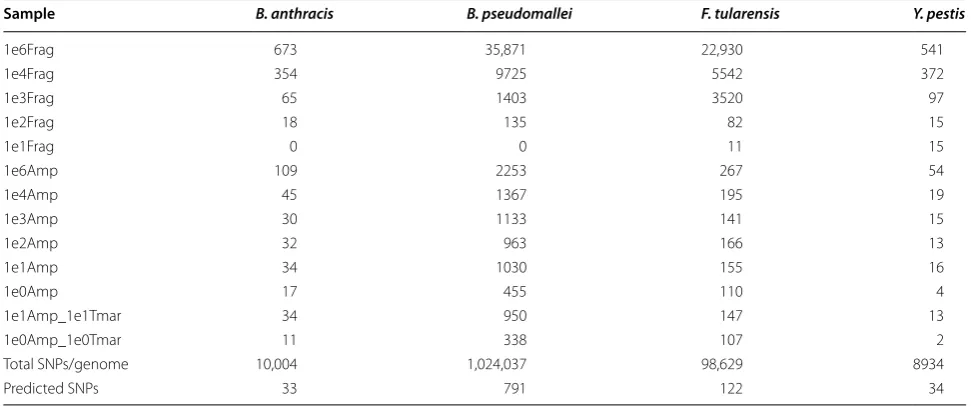
A common method of confident and reliable phyloge-netic placement of a sample based on a set of sequence reads requires knowledge of single nucleotide polymor-phisms (SNPs) present at informative loci. Sequence reads from all samples were compared to a proprietary database of all known SNPs for each spike-in organism, based on the multiple genomes available (Table 2). The number of SNP loci detected in the High (1e6) Fragment and Medium (1e4) Fragment libraries was greater than in any of the AmpliSeq™ samples. This is an expected result as the fragment libraries at these high concentrations (1e6, 1e4) potentially contain the whole genome, while the AmpliSeq™ libraries contain a small number of spe-cifically-targeted loci (Table 3). There is also an expected large decrease in the number of SNPs detected at lower concentrations in the fragment libraries. Specifically there are no SNPs detected for B. pseudomallei or B. anthra-cis at the 10 GE level. In contrast, for AmpliSeq™ librar-ies, some loci are detected even at the very lowest spike in levels. The “predicted amplicons” in Table 2 indicates the theoretical maximum number of known SNP loci that should be covered in the AmpliSeq™ samples if exactly the predicted amplicons were sequenced. The point being
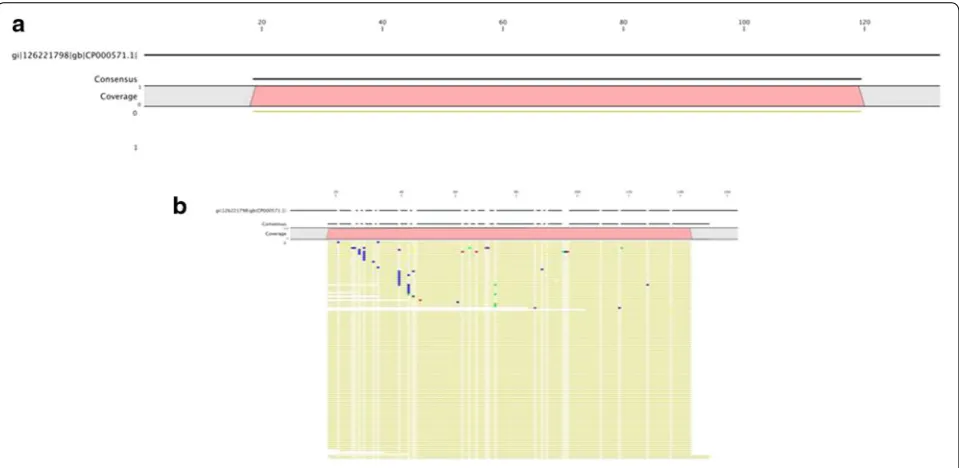
[image:5.595.59.539.89.323.2]Fig. 3 Read mapping against a representative amplicon from B. pseudomallei at 1e2 spike-in. (a), A single read resulting from a fragment library was mapped to the amplicon whereas in (b), 1367 reads from the corresponding AmpliSeq™ library were mapped to the same sequence. Areas of differ-ent color indicate base difference from the reference. Blue cytosine, Red adenine, Green thymine, Yellow guanine
Table 1 Summary of read mapping to organism-specific amplicons for a single sequence run
Sample Genome
equiva-lents Total reads mapped Percent reads mapped (%)
1e6 Frag 1,000,000 7172 0.2
1e6 Amp 1,000,000 5,261,163 95.7
1e4 Frag 10,000 1338 0.02
1e4 Amp 10,000 5,781,522 97.7
1e3 Frag 1000 1021 0.01
1e3 Amp 1000 5,037,307 97.6
1e2 Frag 100 12,702 0.2
[image:5.595.56.292.413.540.2]made here is that the preferential amplification of these regions is what allows those known phylogenetically-informative SNP loci to be interrogated even at the low-est spike-in levels. Additional apparent SNPs could result from errors in the amplification or sequencing, or actual differences between the material spiked in and the asso-ciated reference genome. Polymorphisms and structural changes are known to occur in clonal populations [28].
The reads cluster with the correct strain for B. pseu-domallei and F. tularensis for all the samples with detected SNPs. However, this was not observed for Y. pestis or B. anthracis. This is likely due to the small number of SNPs present by chance in the amplicons chosen for identification of these organisms (33 and 34, respectively).
In general, neither fragment libraries nor AmpliSeq™ libraries reliably cluster with the correct strain (tional file 5: Figure S5, Addi(tional file 6: Figure S6, Addi-tional file 7: Figure S7, Additional file 8: Figure S8). It
should be noted that primers pairs were not designed to cover phylogenetically informative SNPs (although such targeting is of course possible). Rather, selected regions were chosen to be conserved at the species level. How-ever, as concentrations drop, reliable SNP interrogation is possible only with the AmpliSeq™ libraries (Table 2).
Discussion
These data demonstrate the difficulty involved in obtain-ing confident bacterial species identification from a complex mock human clinical sample via unbiased metagenomic sequencing. Employing targeted amplifica-tion provides a large increase in reads from the discrimi-nating regions, allowing confident species identification to be made at very low spike-in levels. This demonstrates that a clear distinction needs to be made between the use of NGS as a novel discovery platform (where deep unbi-ased sequencing must be performed) and as a detector of known organisms/genes/SNPs (e.g., comparing against reference genome sequence information already available in databases).
The use of current benchtop NGS to confidently detect a panel of known pathogens at clinical or trace level in human or environmental samples will need to employ some effective form of background clutter mitigation, target capture (via microarray or other enrichment approaches), targeted amplification, or a combination of strategies. Dependence solely upon unbiased metagen-omic benchtop sequencing will otherwise lack confi-dence that accurate species identification can be made of the known organisms that may be present at low lev-els. It should be noted that confident identification of important functional genes (e.g., critical anti-microbial Table 2 Number of aggregate SNPs in each sample by organism
Sample B. anthracis B. pseudomallei F. tularensis Y. pestis
1e6Frag 673 35,871 22,930 541
1e4Frag 354 9725 5542 372
1e3Frag 65 1403 3520 97
1e2Frag 18 135 82 15
1e1Frag 0 0 11 15
1e6Amp 109 2253 267 54
1e4Amp 45 1367 195 19
1e3Amp 30 1133 141 15
1e2Amp 32 963 166 13
1e1Amp 34 1030 155 16
1e0Amp 17 455 110 4
1e1Amp_1e1Tmar 34 950 147 13
1e0Amp_1e0Tmar 11 338 107 2
Total SNPs/genome 10,004 1,024,037 98,629 8934
Predicted SNPs 33 791 122 34
Table 3 1e6 spike-in scheme and primer pairs per organ-ism
Organism Genome equivalents/
sample No of primer pairs
Human 3000 N/A
Yersinia pestis 1,000,000 99
Francisella tularensis 1,000,000 24
Bacillus anthracis 1,000,000 66
Burkholderia mallei 0 5
Burkholderia pseudomallei 1,000,000 124
Salmonella enterica 0 46
[image:6.595.55.541.104.307.2] [image:6.595.57.292.353.479.2]resistance or virulence factors) cannot be achieved with current benchtop NGS for many types of metagenomic clinical samples [11] (other than relatively noncomplex clinical samples such as cerebrospinal fluid or urine, for which antimicrobial resistance prediction from unbiased NGS is more reasonable [29]). Without specific target-ing for pathogens present at clinically-relevant levels and with 3000+ genes in a typical bacterium, the odds of the small set of unbiased reads that map to the pathogen hit-ting the handful of critical resistance or virulence genes are extremely low.
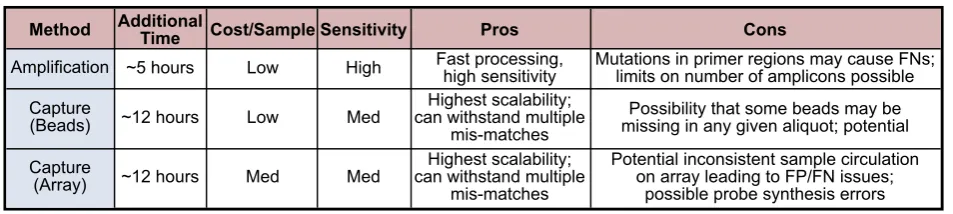
Although host removal techniques have been devel-oped for rRNA, the more generalized concept of clut-ter mitigation has yet to be proven feasible for complex environmental samples. One such technique, Selective Whole Genome Amplification (SWGA), employs prim-ers specific to a genome(s) of interest [30]. In principle, this technique is similar to the approach presented here. Although SWGA would produce sequence reads with broader coverage of the target genome, it has not yet been shown to be feasible for more than one genome. Additionally, methods for removal of host gDNA are still in development or are not yet proven to be efficacious in complex, metagenomic samples [31, 32]. This leaves cap-ture enrichment techniques as the leading viable alterna-tive to targeted amplification [33]. Array or bead-based capture enrichment [34] can employ sufficient probes to cover all the amplicons used in a targeted amplifica-tion panel; furthermore, capture approaches, in general, can scale much larger than current primer-based ampli-fication panels available commercially [35]. The tradeoffs between the enrichment approaches center on factors such as limit of detection (large-scale capture enrichment arrays typically rely on some form of random amplifi-cation), the hybridization time required for capture at low levels, and the added cost of the capture step to the library prep process (Fig. 4). One possibility for a future project would be to perform a controlled comparison of the enhancement approaches in order to investigate the relative merits of each.
As both capture enrichment and targeted amplification techniques are continuing to advance rapidly it is prema-ture to declare one technique to be better than the other for all applications. However, since capture enrichment arrays already can scale to over one million probes it is likely that this will be the best approach for very large scale targeting. It should also be noted that capture techniques will likely work better in cases with highly-degraded DNA where PCR often fails to work [36]. Similarly, since tar-geted amplification can provide lower levels of detection than random amplification against large genomic back-grounds with all else being equal, a lasting niche for this technique is also likely for applications targeting a mod-erate number of regions where sensitivity at low levels is vital. Future increases in NGS sequencing read lengths will be matched with larger amplicon targets, increasing the information content of targeted amplification even if the primer limits stay constant. A reasonable specula-tion is that there will continue to be multiple methods for enhancing sequencing of desired regions.
The targeted amplification technique demonstrated here can be aimed at multiple levels of resolution. Amplicons can be selected to identify organisms, as shown here, to identify genes of interest (e.g. known virulence and/or anti-microbial resistance factors), or to identify SNPs of interest. For example, it would be possible to create an AmpliSeq™ panel that specifically targeted key genes or sufficient SNPs to achieve a speci-fied level of phylogenetic resolution for a set of microbial species, up to the limit of the maximum allowed number of primer pairs for the AmpliSeq™ product. This means that if we designed an AmpliSeq™ panel to cover enough phylogenetically informative SNPs by ensuring that the SNPs on predicted amplicons are sufficient to recapitu-late the phylogeny based on all SNPs or whole genome alignments, we should get accurate genotyping and fine level phylogenetic classification even at very low concen-trations of the target. It would even be possible to mix amplicons that query organisms, genes, and SNPs in the same panel, subject to the limit of primer pairs.
Method
Amplification
Capture (Beads)
Capture (Array)
Additional
Time Cost/Sample Sensitivity Pros Cons
~5 hours Low High Fast processing,high sensitivity Mutations in primer regions may cause FNs;limits on number of amplicons possible
~12 hours Low Med can withstand multipleHighest scalability; mis-matches
Possibility that some beads may be missing in any given aliquot; potential
~12 hours Med Med can withstand multipleHighest scalability; mis-matches
Potential inconsistent sample circulation on array leading to FP/FN issues;
possible probe synthesis errors
[image:7.595.61.538.589.696.2]Conclusions
Our pilot study of a targeted amplification panel focused on detecting several biothreat agents against a human DNA background demonstrated that confident species deter-mination could be made at least 2 orders of magnitude of spike-in level below that of an unbiased library preparation. Owing to the design of the primers in the targeted amplifi-cation panel, all reads from those amplicons are guaranteed to be informative at the species-resolution level. (Since vari-ations in targeted organisms could cause individual primers to fail, we designed multiple highly-discriminating ampli-cons to provide redundancy.) This contrasts to the unbi-ased sequencing, where any reads mapping to the pathogen come from random locations, many of which are common to multiple species at higher taxonomic levels of resolution. Thus, the use of targeted amplification on a bench-top NGS platform provides a workable approach to confident and information-rich identification of a set of known pathogens from a complex sample when alternatives such as culturing or ultra-deep NGS are not feasible options.
Although we demonstrated our approach using a relatively small biothreat agent panel of 467 amplicon targets, the tar-geted amplification technique could obviously be extended to other applications such as human or animal health, food safety, vaccine or biological product safety, contamination monitoring for manufacturing processes, or any application where it is important to know whether a set of known patho-gens are present. It should be clear that targeting highly-dis-criminating regions of a whole genome provides much more resolution power than amplifying and sequencing only the 16S rRNA gene, although that process still remains a viable choice for performing a broad census of bacteria present; including some that may not yet have whole genomes avail-able. Finally, although AmpliSeq™ is designed for use on Ion platforms, it is possible that it may be adapted for use with other sequencing technologies or alternative solutions may soon become available. Additionally, we have not tested the efficacy of the much larger AmpliSeq™ panels that can be supported by the current product.
Methods
Sample preparation
Samples were created in accordance with the manufactur-ers’ recommendations for nucleic acid mass. Briefly, a base mix of Bacillus anthracis (Sterne), Yersinia pestis (Harbin), Francisella tularensis (LVS) and Burkholderia pseudomal-lei (strain 9) genomic DNA (gDNA) were created such that the number of genome equivalents (GE) of each gDNA was 2× the final concentration of the 1e6 Spike mix (refer to Table 3). Ten nanograms (3000 GE) of human gDNA (Clonetech Laboratories; Mountain View, CA, USA) and 10,000 GE of Thermotoga maritima strain MSB8 gDNA were added in amounts that were constant for each sample.
T. maritima (a deep sea vent thermophile) was used here as an amplification control. Final sample volumes were 20 µL. Samples were given designations based on the path-ogen GEs spiked as follows: (1e6), (1e5), (1e4), (1e3), and (1e2). Pathogen spike-ins of 10 and 1 (1e1Amp, 1e0Amp) GE were also sequenced for the AmpliSeq™ libraries, with T. maritima at 10,000 GE or at the same 10 or 1 GE as the pathogens (1e1Amp_1e1Tmar, 1e0Amp_1e0Tmar). Copy numbers calculations for all spike-in organisms were based on the published genome and plasmid sizes in base pairs using NCBI accession numbers. The relevant accession numbers are as follows: B. anthracis NC_007530 (chromo-some), NC_007322 (pXO1); F. tularensis NC_007880.1; Y. pestis NC_003143.1 (chromosome), NC_003132.1 (pPCP1), NC_003131.1 (pPCD1), and NC_003134.1 (pMT1); and B. pseudomallei NC_006350.1 (chromosome 1) and NC_006351.1 (chromosome 2).
Library preparation and sequencing
AmpliSeq™ libraries were constructed with the Ion AmpliSeq™ library protocol and the following param-eters: 2× primer mix, 6 µL of sample and 16 PCR cycles. Fragment libraries were constructed by following the suggested Ion PGM protocol and 6 µL of sample. All libraries were quality checked using the Agilent Bio-Analyzer and quantitated using the Ion Library Quan-titation Kit. Template was diluted to target 10–30 % enriched beads and clonally amplified using Ion PGM OT2 400 kit. Enriched beads were sequenced using the Ion PGM 400 Sequencing kit on an Ion 318™ chip at default instrument parameters. Each library was sequenced separately. Sequence run metrics are sum-marized in Additional file 9: Table S1.
AmpliSeq™ panel design
A total of 9799 organism-specific amplicons created using custom software [6] were submitted to Life Tech-nologies for down-selection and primer design using the Ion AmpliSeq™ strategy and the Ion AmpliSeq™ soft-ware. All amplicons were from genomic regions of the study organisms that maximally distinguish them at the species level from all other microbial organisms with genomes publically available at the time of design. Fol-lowing several iterative rounds of primer optimization and removal of overlapping amplicons, a panel of 467 primer pairs was chosen for the pilot panel (Table 3). Amplicon sequences are available upon request. Primer information is not supplied by Life Technologies.
Bioinformatic analysis
Reference mapping
CLC Reference Mapper was run with default set-tings (Insertion cost = 3, Deletion cost = 3, Mismatch cost = 2, Length fraction = 0.5 and similarity frac-tion = 0.8). Mapping of all sequence reads was per-formed against the amplicon sequences that comprise the current panel (Table 3) and/or the available NCBI refer-ence genome for the spike in organisms.
Taxonomic classification of sequence reads
Sequence reads were trimmed and quality filtered prior to analysis using LMAT [37]. LMAT uses a custom k-mer (sequence strings of length k) database of all draft and fin-ished microbial genomes to classify sequence reads. Each read is mapped to the genome(s) to which it best cor-responds, and then a score is computed to indicate the confidence for each mapped genome being present. Data were visualized using MEGAN [38]. For comparisons between samples, taxa were reported for which the mini-mum read score averaged across reads was ≥1 and there were at least 50 reads. Additionally, read counts were nor-malized as a fraction of the total reads in that run.
Availability of supporting data
Supporting data may be available upon request.
Authors’ contributions
SNG, KGF and TRS conceived of and designed the study. JBT prepared the samples. KGF and CLR performed the sequencing. SNG, JEA and KGF analyzed the data. SNG, KGF and TRS wrote the manuscript with input and edits from JEA, AA, MD and VPM. All authors read and approved the final version of the manuscript.
Author details
1 Bioinformatics, Global Security Program, Lawrence Livermore National
Laboratory, 7000 East Avenue, L-174, Livermore, CA 94550, USA. 2 Naval Medi-cal Research Center, NMRC-Frederick, 8400 Research Plaza, Fort Detrick, MD 21702, USA. 3 Henry M. Jackson Foundation, 6720-A Rockledge Drive, Suite 100, Bethesda, MD 20817, USA. 4 Thermo Fisher Scientific, 180 Oyster Point Boulevard, Building 200, South San Francisco, CA 94080, USA.
Acknowledgements
The authors wish to thank Mr. Brian Kelly of Thermo Fisher for providing sequencing reagents and AmpliSeq primer pools. The authors also wish to express our gratitude to Dr. Kimberly Bishop-Lilly and Dr. Theron Hamilton for critical reading of the manuscript. VPM is a military service member and this work was prepared as part of his official duties. Title 17 U.S.C. §105 provides that ‘Copyright protection under this title is not available for any work of the United States Government.’ Title 17 U.S.C. §101 defines a U.S. Government work as a work prepared by a military service member or employee of the U.S. Government as part of that person’s official duties. The opinions or assertions contained herein are the private ones of the author(s) and are not to be con-strued as official or reflecting the views of either the Department of the Navy or the Department of Defense. Portions of this work were performed under the auspices of the US Department of Energy by Lawrence Livermore National Laboratory under Contract DE-AC52-07NA27344.
Compliance with ethical guidelines
Competing interests
AA and MD were employees of Thermo Fisher when this study was per-formed. All other authors declare they have no competing interests.
Received: 23 April 2015 Accepted: 28 September 2015
References
1. Ecker DJ, Sampath R, Willett P, Wyatt JR, Samant V, Massire C, Hall TA, Hari K, McNeil JA, Buchen-Osmond C, et al. The Microbial Rosetta Stone Data-base: a compilation of global and emerging infectious microorganisms and bioterrorist threat agents. BMC Microbiol. 2005;5:19.
2. Slezak T, Kuczmarski T, Ott L, Torres C, Medeiros D, Smith J, Truitt B, Mulak-ken N, Lam M, Vitalis E, et al. Comparative genomics tools applied to bioterrorism defence. Briefings in bioinformatics. 2003;4(2):133–49. 3. Lemmon GH, Gardner SN. Predicting the sensitivity and specificity of
published real-time PCR assays. Ann Clin Microbiol Antimicrob. 2008;7:18. 4. Reed C, Fofanov V, Putonti C, Chumakov S, Slezak T, Fofanov Y. Effect
of the mutation rate and background size on the quality of pathogen identification. Bioinformatics. 2007;23(20):2665–71.
5. Gardner SN, Kuczmarski TA, Vitalis EA, Slezak TR. Limitations of TaqMan PCR for detecting divergent viral pathogens illustrated by hepatitis A, B, C, and E viruses and human immunodeficiency virus. J Clin Microbiol. 2003;41(6):2417–27.
Additional files
Additional file 1: Figure S1. Sequence reads classified as B. anthracis. Sequence reads resulting from the indicated samples were classified using LMAT with the complete genome database as indicated in the “Methods”.
Additional file 2: Figure S2. Sequence reads classified as B. pseudomallei. Sequence reads resulting from the indicated samples were classified using LMAT with the complete genome database as indicated in the “Methods”.
Additional file 3: Figure S3. Sequence reads classified as F. tularensis. Sequence reads resulting from the indicated samples were classified using LMAT with the complete genome database as indicated in the “Methods”.
Additional file 4: Figure S4. Sequence reads classified as Y. pestis. Sequence reads resulting from the indicated samples were classified using LMAT with the complete genome database as indicated in the “Methods”.
Additional file 5: Figure S5. Taxonomic comparison of sequence reads at 1e1 GE spike-in. Sequence reads resulting from the indicated samples were classified using LMAT with the complete genome database as indi-cated in the Materials and Methods. Data were visualized using MEGAN. Taxa are reported for which the minimum read score averaged across reads was ≥ 1 and there were at least 50 reads.
Additional file 6: Figure S6. Taxonomic comparison of sequence reads at 1e2 GE spike-in. Sequence reads resulting from the indicated samples were classified using LMAT with the complete genome database as indi-cated in the Materials and Methods. Data were visualized using MEGAN. Taxa are reported for which the minimum read score averaged across reads was ≥ 1 and there were at least 50 reads.
Additional file 7: Figure S7. Taxonomic comparison of sequence reads at 1e3 GE spike-in. Sequence reads resulting from the indicated samples were classified using LMAT with the complete genome database as indi-cated in the Materials and Methods. Data were visualized using MEGAN. Taxa are reported for which the minimum read score averaged across reads was ≥ 1 and there were at least 50 reads.
Additional file 8: Figure S8. Taxonomic comparison of sequence reads at 1e4 GE spike-in. Sequence reads resulting from the indicated samples were classified using LMAT with the complete genome database as indi-cated in the Materials and Methods. Data were visualized using MEGAN. Taxa are reported for which the minimum read score averaged across reads was ≥ 1 and there were at least 50 reads.
6. Hysom DA, Naraghi-Arani P, Elsheikh M, Carrillo AC, Williams PL, Gardner SN. Skip the alignment: degenerate, multiplex primer and probe design using K-mer matching instead of alignments. PLoS One. 2012;7(4):e34560. 7. Lewis T, Loman NJ, Bingle L, Jumaa P, Weinstock GM, Mortiboy D, Pallen
MJ. High-throughput whole-genome sequencing to dissect the epide-miology of Acinetobacter baumannii isolates from a hospital outbreak. J Hosp Infect. 2010;75(1):37–41.
8. Eyre DW, Golubchik T, Gordon NC, Bowden R, Piazza P, Batty EM, Ip CL, Wilson DJ, Didelot X, O’Connor L et al.A pilot study of rapid benchtop sequencing of Staphylococcus aureus and Clostridium difficile for out-break detection and surveillance. BMJ open 2012; 2(3).
9. Moore RA, Warren RL, Freeman JD, Gustavsen JA, Chenard C, Fried-man JM, Suttle CA, Zhao Y, Holt RA. The sensitivity of massively parallel sequencing for detecting candidate infectious agents associated with human tissue. PLoS One. 2011;6(5):e19838.
10. Cheval J, Sauvage V, Frangeul L, Dacheux L, Guigon G, Dumey N, Pariente K, Rousseaux C, Dorange F, Berthet N, et al. Evaluation of high-through-put sequencing for identifying known and unknown viruses in biological samples. J Clin Microbiol. 2011;49(9):3268–75.
11. Frey KG, Herrera-Galeano JE, Redden CL, Luu TV, Servetas SL, Mateczun AJ, Mokashi VP, Bishop-Lilly KA. Comparison of three next-generation sequencing platforms for metagenomic sequencing and identification of pathogens in blood. BMC Genom. 2014;15:96.
12. Be NA, Thissen JB, Gardner SN, McLoughlin KS, Fofanov VY, Koshinsky H, Ellingson SR, Brettin TS, Jackson PJ, Jaing CJ. Detection of Bacillus anthracis DNA in complex soil and air samples using next-generation sequencing. PLoS One. 2013;8(9):e73455.
13. Quail MA, Smith M, Coupland P, Otto TD, Harris SR, Connor TR, Bertoni A, Swerdlow HP, Gu Y. A tale of three next generation sequencing platforms: comparison of Ion Torrent, Pacific Biosciences and Illumina MiSeq sequencers. BMC Genom. 2012;13:341.
14. van Tonder AJ, Mistry S, Bray JE, Hill DM, Cody AJ, Farmer CL, Klugman KP, von Gottberg A, Bentley SD, Parkhill J, et al. Defining the estimated core genome of bacterial populations using a Bayesian decision model. PLoS Comput Biol. 2014;10(8):e1003788.
15. Chen C, Zhang W, Zheng H, Lan R, Wang H, Du P, Bai X, Ji S, Meng Q, Jin D, et al. Minimum core genome sequence typing of bacterial pathogens: a unified approach for clinical and public health microbiology. J Clin Microbiol. 2013;51(8):2582–91.
16. Lane DJ, Pace B, Olsen GJ, Stahl DA, Sogin ML, Pace NR. Rapid determina-tion of 16S ribosomal RNA sequences for phylogenetic analyses. Proc Natl Acad Sci USA. 1985;82(20):6955–9.
17. Wang Y, Qian PY. Conservative fragments in bacterial 16S rRNA genes and primer design for 16S ribosomal DNA amplicons in metagenomic studies. PLoS One. 2009;4(10):e7401.
18. Woo PC, Lau SK, Teng JL, Tse H, Yuen KY. Then and now: use of 16S rDNA gene sequencing for bacterial identification and discovery of novel bac-teria in clinical microbiology laboratories. Clin Microbiol Infect Off Publ Eur Soc Clin Microbiol Infect Dis. 2008;14(10):908–34.
19. O’Neil D, Glowatz H, Schlumpberger M. Ribosomal RNA depletion for efficient use of RNA-seq capacity. In: Frederick M, Ausubel et al (editors) Current protocols in molecular biology. 2013; Chapter 4: Unit 4 19. 20. Ghyselinck J, Pfeiffer S, Heylen K, Sessitsch A, De Vos P. The effect of
primer choice and short read sequences on the outcome of 16S rRNA gene based diversity studies. PLoS One. 2013;8(8):e71360.
21. Okou DT, Steinberg KM, Middle C, Cutler DJ, Albert TJ, Zwick ME. Microarray-based genomic selection for high-throughput resequencing. Nat Methods. 2007;4(11):907–9.
22. Mamanova L, Coffey AJ, Scott CE, Kozarewa I, Turner EH, Kumar A, Howard E, Shendure J, Turner DJ. Target-enrichment strategies for next-generation sequencing. Nat Methods. 2010;7(2):111–8.
23. Tewhey R, Warner JB, Nakano M, Libby B, Medkova M, David PH, Kotsopoulos SK, Samuels ML, Hutchison JB, Larson JW, et al. Microdro-plet-based PCR enrichment for large-scale targeted sequencing. Nat Biotechnol. 2009;27(11):1025–31.
24. Turingan RS, Thomann HU, Zolotova A, Tan E, Selden RF. Rapid focused sequencing: a multiplexed assay for simultaneous detection and strain typing of Bacillus anthracis, Francisella tularensis, and Yersinia pestis. PLoS One. 2013;8(2):e56093.
25. Seo SB, King JL, Warshauer DH, Davis CP, Ge J, Budowle B. Single nucleo-tide polymorphism typing with massively parallel sequencing for human identification. Int J Legal Med. 2013;127(6):1079–86.
26. Millat G, Chanavat V, Rousson R. Evaluation of a new NGS method based on a custom AmpliSeq library and Ion Torrent PGM sequencing for the fast detection of genetic variations in cardiomyopathies. Clinica chimica acta Int J Clin Chem. 2014;433:266–71.
27. Kubista M, Andrade JM, Bengtsson M, Forootan A, Jonak J, Lind K, Sindelka R, Sjoback R, Sjogreen B, Strombom L, et al. The real-time poly-merase chain reaction. Mol Aspects Med. 2006;27(2–3):95–125. 28. Gaudriault S, Pages S, Lanois A, Laroui C, Teyssier C, Jumas-Bilak E,
Givaudan A. Plastic architecture of bacterial genome revealed by compar-ative genomics of Photorhabdus variants. Genome Biol. 2008;9(7):R117. 29. Hasman H, Saputra D, Sicheritz-Ponten T, Lund O, Svendsen CA,
Frimodt-Moller N, Aarestrup FM. Rapid whole-genome sequencing for detection and characterization of microorganisms directly from clinical samples. J Clin Microbiol. 2014;52(1):139–46.
30. Leichty AR, Brisson D. Selective whole genome amplification for rese-quencing target microbial species from complex natural samples. Genet-ics. 2014;198(2):473–81.
31. Archer MJ, Lin B, Wang Z, Stenger DA. Magnetic bead-based solid phase for selective extraction of genomic DNA. Anal Biochem. 2006;355(2):285–97.
32. Archer MJ, Long N, Lin B. Effect of probe characteristics on the subtractive hybridization efficiency of human genomic DNA. BMC research notes. 2010;3:109.
33. Almomani R, van der Heijden J, Ariyurek Y, Lai Y, Bakker E, van Galen M, Breuning MH, den Dunnen JT. Experiences with array-based sequence capture; toward clinical applications. Eur J Human Genetics EJHG. 2011;19(1):50–5.
34. Bodi K, Perera AG, Adams PS, Bintzler D, Dewar K, Grove DS, Kieleczawa J, Lyons RH, Neubert TA, Noll AC, et al. Comparison of commercially available target enrichment methods for next-generation sequencing. J Biomol Tech. 2013;24(2):73–86.
35. Bos KI, Jager G, Schuenemann VJ, Vagene AJ, Spyrou MA, Herbig A, Nieselt K, Krause J. Parallel detection of ancient pathogens via array-based DNA capture. Philos Trans R Soc Lond B Biol Sci. 2015;370(1660):20130375. 36. Devault AM, McLoughlin K, Jaing C, Gardner S, Porter TM, Enk JM, Thissen
J, Allen J, Borucki M, DeWitte SN, et al. Ancient pathogen DNA in archaeo-logical samples detected with a Microbial Detection Array. Scientific reports. 2014;4:4245.
37. Ames SK, Hysom DA, Gardner SN, Lloyd GS, Gokhale MB, Allen JE. Scal-able metagenomic taxonomy classification using a reference genome database. Bioinformatics. 2013;29(18):2253–60.
38. Huson DH, Mitra S, Ruscheweyh HJ, Weber N, Schuster SC. Integrative analysis of environmental sequences using MEGAN4. Genome Res. 2011;21(9):1552–60.
Submit your next manuscript to BioMed Central and take full advantage of:
• Convenient online submission • Thorough peer review
• No space constraints or color figure charges • Immediate publication on acceptance
• Inclusion in PubMed, CAS, Scopus and Google Scholar • Research which is freely available for redistribution