of interest (ROIs) were defined within initial ADC lesions: ROI (1)reperf_3hourhyperacute reperfusion (within 3 hours),
ROI (2)reperf_6houracute reperfusion (3 to 6 hours), and ROI (3)nonreperfno reperfusion (by 6 hours). For each ROI,
changes in ADC (⌬ADC) from 3 to 6 hours and risks of infarction were examined.
Results—The magnitude of initial ADC reduction was similar in all 3 ROIs (P⫽0.51).⌬ADC was strongly associated with reperfusion (P⬍0.0001) but not with initial ADC reduction (P⫽0.83).⌬ADC in ROI (1)reperf_3hourand ROI (2)reperf_6hour
was significantly larger than that of ROI (3)nonreperf(P⬍0.05). Positive⌬ADC was obtained from 3 to 6 hours in ROI
(1)reperf_3hour that had restored perfusion before 3 hours, demonstrating a temporal delay between reperfusion and ADC
changes. Risks of infarction were significantly higher in ROI (3)nonreperfthan those in ROI (1)reperf_3hourand ROI (2)reperf_6hour.
Conclusions—Improvement in ADC did not occur coincidently with reperfusion but showed a temporal delay. Regions with similar initial ADC reductions at 3 hours had different evolution of ADC and infarction risks depending on when or if tissue reperfused. These findings provide a physiological basis for the observation that a single ADC measurement at a fixed time after stroke onset may not accurately predict tissue outcome. (Stroke. 2011;42:1276-1281.)
Key Words:ADC recovery 䡲 ischemic stroke 䡲 reperfusion 䡲 risk of infarction
M
agnetic resonance diffusion-weighted imaging (DWI) is widely used in clinical practice to depict acute ischemic stroke lesions. It has been demonstrated that com-promised blood flow leads to a reduction in the apparent diffusion coefficient (ADC) during ischemia.1,2ADCreduc-tion may be observed as early as minutes after stroke onset.3
Conversely, DWI lesions have been found to reverse in various settings, including shortly after thrombolysis or a few days after stroke onset.4 – 6However, the temporal behavior of
ADC lesion improvement after reperfusion during the first hours after stroke onset has not been documented in humans. Moreover, it has not been thoroughly investigated whether the presence of reperfusion and its timing directly affect the final fate of an ADC lesion. In a rapid sequential DWI study in cats, Davis et al found that ADC reduction and recovery did not occur concurrently with stroke onset or reperfusion
but rather evolved progressively over 5 to 10 minutes after these events.7Based on this animal study, we hypothesized
that a temporal delay may also exist between tissue reperfu-sion and ADC improvement in acute human stroke. This temporal delay may explain, in part, why ADC reduction is not a reliable predictor of ischemic tissue outcome,8
particu-larly because DWI images are usually acquired at a single time point after stroke onset in current clinical practice. An improved understanding of the relationship between perfu-sion and diffuperfu-sion changes may aid in clinical deciperfu-sion- decision-making using MRI.
In this study of sequential MRI in patients with acute ischemic stroke, we examined the temporal evolution of abnormal ADC in brain regions exhibiting 3 different reperfusion patterns during the hyperacute phase of ischemia. The infarction risk for each of these patterns was measured and compared.
Received December 2, 2010; accepted December 28, 2010.
From the Department of Radiology and Biomedical Research Imaging Center (H.A., W.L.), University of North Carolina at Chapel Hill, Chapel Hill, NC; the Departments of Neurology (A.L.F., J.-M.L.) and Radiology (K.V.), Washington University, School of Medicine, St Louis, MO; and the Department of Neurology (W.J.P.), University of North Carolina at Chapel Hill, Chapel Hill, NC.
*H.A. and A.L.F. contributed equally. †Co-corresponding authors.
Correspondence to Weili Lin, PhD, Biomedical Research Imaging Center, CB# 7513, University of North Carolina at Chapel Hill, Chapel Hill, NC 27599. E-mail [email protected]; and Jin-Moo Lee, MD, PhD, Department of Neurology, Washington University, School of Medicine, 660 South Euclid Avenue, Campus Box 8111, St Louis, MO 63110. E-mail [email protected]
© 2011 American Heart Association, Inc.
Strokeis available at http://stroke.ahajournals.org DOI: 10.1161/STROKEAHA.110.610501
1276
Participants and Methods
Participants and Inclusion Criteria
This is a retrospective analysis of data from a prospectively collected observational study of serial MRIs performed in patients with acute ischemic stroke at a large tertiary care referral center admitting⬎800 patients with ischemic stroke per year. After Institutional Review Board approval, the study enrolled consecutive patients within 3.5 hours of stroke onset based on the following prespecified inclusion criteria: clinically suspected acute cortical ischemic stroke; ageⱖ18 years; National Institutes of Health Stroke Scale score ⱖ5; and patient or patient’s next of kin capable of informed consent. Exclusion criteria included bilateral strokes or any acute endovascu-lar or surgical intervention. Both tissue plasminogen activator (tPA)-treated and untreated patients were included. Patients were given intravenous tPA according to the National Institute of Neuro-logical Disorders and Stroke tPA trial protocol.4 In tPA-treated
patients, tPA administration was begun before all MR imaging studies without causing any delay in time to tPA treatment or any deviation from standard monitoring practices.
Magnetic Resonance Imaging
Thirty-one participants were serially scanned with MRI at 3 time points (tp): within 3.5 hours (tp1), at 6 hours (tp2), and at 1 month (tp3) after stroke onset. Tp1 scan was acquired as early as possible. Participants treated with tPA were imaged immediately after initia-tion of tPA infusion. One-month follow-up scans were obtained in 26 participants; the remaining 5 participants were not available due to premature death (n⫽1) or early withdrawal (n⫽4) from the study.
MR images were acquired on a 3-T Siemens whole body Trio system (Siemens Medical Systems, Erlangen, Germany). Imaging protocols, including DWI, fluid-attenuated inversion recovery, T1, and perfusion-weighted imaging using dynamic susceptibility con-trast, were identical for both tp1 and tp2. DWI images were acquired with a single-shot, spin echo, echoplanar imaging sequence (TR/ TE⫽2900/90 ms, b⫽0, 500, 1000 s/mm2; 3-axis diffusion encoding;
20 slices with a slice thickness of 5 mm). The imaging parameters for the fluid-attenuated inversion recovery sequence were: TR/ TE⫽10000/115 ms; inversion time⫽2500 ms; a matrix of 512⫻416 pixels, and 20 slices. T1-weighted images were obtained using a 3-dimensional magnetization prepared rapid gradient echo sequence (TR/TE⫽1520/3.69 ms, inversion time⫽800 ms, flip angle⫽ 8-degree, matrix⫽256⫻256⫻144, voxel size⫽1⫻1⫻1 mm3, parallel
imaging with an acceleration factor of 2). Perfusion-weighted images were acquired with a T2*-weighted gradient echo echoplanar imag-ing sequence (TR/TE⫽1500/43 ms, 14 slices with a slice thickness of 5 mm, matrix⫽128⫻128). This sequence was repeated 50 times and gadolinium diethylenetriamine penta-acetic acid (0.1 mmol/kg) was injected at the completion of the fifth measure.
Data Analysis
In perfusion-weighted images, the change of MR signal induced by the bolus passage of contrast agent was first converted to ⌬R2*/ concentration curve. Subsequently, voxels within the middle cerebral artery of the contralateral hemisphere were manually chosen to obtain an arterial input function. A singular value decomposition method was used to calculate cerebral blood flow, cerebral blood volume, and derive the mean transit time (MTT⫽cerebral blood volume/cerebral blood flow).9
Six parameter rigid image registration was performed to align MTT, ADC, and fluid-attenuated inversion recovery images from the same participant across all time points using FSL 3.2 (FMRIB, Oxford, UK). To minimize the inclusion of cerebrospinal fluid, voxels with an ADC value⬎100⫻10⫺5mm2/s were removed from
data analysis.6Blood from early hemorrhagic transformation may
affect ADC at tp2. To minimize its effect on ADC, we examined the T2*-weighted dynamic susceptibility contrast images at tp2 for each patient. Hypointense regions were then manually outlined as hem-orrhagic transformation and excluded from data analysis. Mean MTT and ADC values were obtained from a region of interest (ROI) that encompassed the whole contralateral hemisphere for each participant.
Voxels with ADC values ⬍mean⫺2*SD of the contralateral hemisphere were defined as abnormal. Three ROIs were defined within tp1 abnormal ADC regions corresponding to 3 different reperfusion patterns to evaluate (1) the temporal evolution of each of these 3 ADC lesions; and (2) their respective tissue outcomes. MTT was chosen to define perfusion status because MTT is uniform across gray and white matter (unlike cerebral blood flow or cerebral blood volume), allowing for use of a single threshold across both gray and white matter.9Hypoperfusion was defined
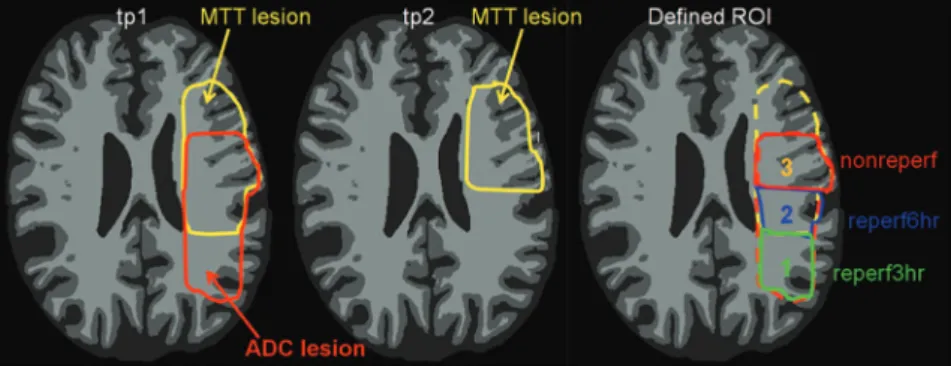
using MTT ⬎4 seconds longer than the mean contralateral hemispheric. Figure 1 shows a schematic representation of the definition of 3 ROIs. ROI (1)reperf_3hourwas defined as voxels with
abnormal ADC at tp1 but normal MTT at tp1 and tp2 (labeled as “1,” Figure 1), representing an ADC lesion that reperfused before tp1 imaging (⬍3 hours). ROI (2)reperf_6hourwas defined as voxels with
abnormal ADC and MTT at tp1 but normal MTT at tp2 (labeled as “2,” Figure 1), representing an ADC lesion that reperfused between tp1 (3 hours) and tp2 (6 hours). ROI (3)nonreperfwas defined as voxels
with abnormal ADC at tp1 and abnormal MTT at tp1 and tp2 (labeled as “3,” Figure 1), representing an ADC lesion that did not reperfuse. Note our definition of ADC lesion was based on tp1 ADC maps only and 3 ROIs were defined using tp1 ADC and tp1 and tp2 MTT. Therefore, no ADC lesion is delineated at tp2 in Figure 1 to avoid confusion. In all ROIs, isolated regions⬍1 mL were removed to minimize artifacts due to potential misalignment and spurious findings caused by random noise.
Mean ADC values from these ROIs at tp1 and tp2 were obtained to examine the temporal evolution of ADC between the 2 tps on an individual participant basis. ADC changes from tp1 to tp2 were
Figure 1.A schematic representation of the definition of 3 ROIs within tp1 abnormal ADC regions. Yellow color outlines MTT lesion at tp1 and tp2, and red color outlines ADC lesion at tp1. Region 1 represents ROI (1)reperf_3hourthat exhibits abnormal ADC at tp1but nor-mal MTT at tp1 and tp2; Region 2 represents ROI (2)reperf_6hourthat has abnormal ADC and MTT at tp1 and normal MTT at tp2; and region 3 represents ROI (3)nonreperfthat shows abnormal ADC at tp1 and abnormal MTT at tp1 and tp2. ROIs indicates regions of inter-est; tp, time point; ADC, apparent diffusion coefficient; MTT, mean transit time.
computed as⌬ADC⫽ADC_tp2⫺ADC_tp1 in all 3 ROIs. A positive ⌬ADC indicates an improvement of ADC. A generalized linear model (SAS 9.2; SAS Institute Inc, Cary, NC) was used to perform an analysis of covariance to evaluate whether reperfusion status (reperfusion⬍3 hours, reperfusion 3 to 6 hours, and no reperfusion) and/or tp1 ADC values might affect ⌬ADC. ⌬ADC was the dependent variable, whereas tp1 ADC values and reperfusion status were the independent variables in the model.
Final lesions were manually outlined as hyperintense regions on tp3 fluid-attenuated inversion recovery. The defined final lesions were mapped onto the tp1 and tp2 images. Based on the overlap between final lesion and each ROI, risk of infarction was calculated as the ratio of the number of infarcted voxels to the total number of voxels in a specific ROI on an individual patient basis. To evaluate whether the risk of infarction differed among all 3 ROIs, 1-way analysis of variance with Newman-Keuls multiple comparison post-test was performed.P⬍0.05 was considered statistically significant.
Results
Thirty-one patients with acute ischemic stroke were enrolled after obtaining written informed consent. Their characteristics are summarized in the Table. At tp1, the mean ADC of contralateral hemispheres was 81.1⫾2.0⫻10⫺5mm2/s, which
is similar to published reports.6,10The threshold for abnormal
ADC, defined as 2 SDs below the normal value at tp1, was 64.3⫾3.9⫻10⫺5 mm2/s (approximately 21% below normal values).
Representative tp1 and tp2 MTT, tp1 and tp2 ADC, 1 month fluid-attenuated inversion recovery, and overlaid ROIs from 3 participants are shown in Figure 2.
⫻10⫺5mm2/s, 52.3 (IQR, 49.8 to 55)⫻10⫺5mm2/s, and 52 (IQR, 48.9 to 55.8)⫻10⫺5mm2/s for ROI (1)
reperf_3hour, ROI
(1)reperf_3hour, and ROI (3)nonreperf, respectively.
ROI (1)reperf_3hour, representing hyperacute reperfusion (⬍3
hours), was identified in 12 participants of which 2 (17%) were not treated with tPA (marked in red, Figure 3A). ROI (2)reperf_6hour, representing reperfusion between tp1 (3 hours)
and tp2 (6 hours), was detected in 9 participants of which 1 (11%) was not treated with tPA (marked in red, Figure 3B). ROI (3)nonreperf, representing initially abnormal ADC and
abnormal perfusion at tp1 and without evidence of reperfu-sion at tp2, was detected in 19 participants of which 5 (26%) were untreated patients.
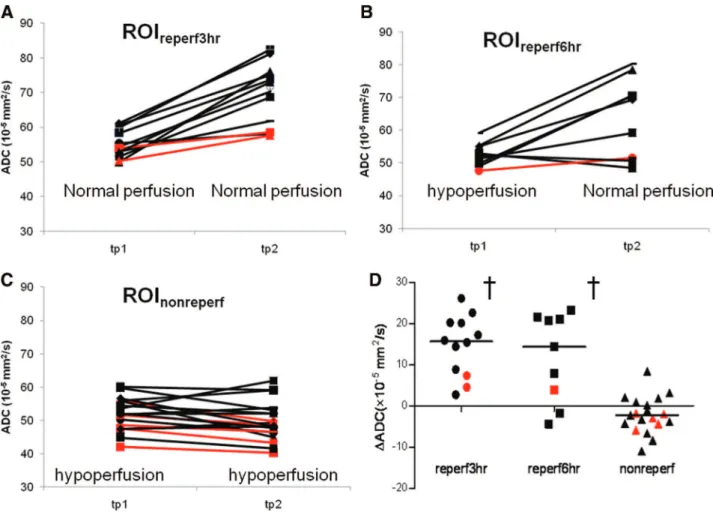
Scatterplots of⌬ADC in the 3 predefined ROIs are given in Figure 3D.⌬ADC was strongly associated with reperfu-sion status (P⬍0.0001, analysis of covariance) but was not associated with tp1 ADC (P⫽0.83). The median (IQR)
⌬ADC were 15.7 (IQR, 8.4 to 20.1) ⫻10⫺5 mm2/s, 14.3 (IQR, 3.9 to 21.1)⫻10⫺5 mm2/s, and ⫺2.3 (IQR,⫺4.4 to
0.6)⫻10⫺5 mm2/s in ROI (1)
reperf_3hour, ROI (2)reperf_6hour,
and ROI (3)nonreperf, respectively. ⌬ADC were not
signifi-cantly different for ROI (1)reperf_3hourand ROI (2)reperf_6hour,
but⌬ADC in both reperfused ROIs were significantly larger than that of ROI (3)nonreperf(P⬍0.05). That ROI (1)reperf_3hour
showed a similar increase in ADC to ROI (2)reperf_6hour
although already reperfused at 3 hours demonstrates that a temporal dissociation between reperfusion and ADC change occurred in this tissue. The small number of non-tPA-treated patients prevents us from discerning whether tPA-induced reperfusion or spontaneous reperfusion might have a different impact on subsequent ADC evolution.
Risk of Infarction
Risks of infarction were plotted for all ROIs in Figure 4. The median and IQR risks of infarction were 64.2% (IQR, 56.2% to 82.7%) for ROI (1)reperf_3hour, 84.3% (IQR, 30.2% to
88.5%) for ROI (2)reperf_6hour, and 94.4% (IQR, 83.5% to
97.9%) for ROI (3)nonreperf (Figure 4). One-way analysis of
variance showed significantly different risks of infarction among the 3 ROIs (P⬍0.01). Newman-Keuls post-tests further revealed that risks of infarction in ROI (3)nonreperf
were significantly higher than those in ROI (1)reperf_3hourand
ROI (2)reperf_6hour(P⬍0.05). The fact that all 3 groups had
similar initial ADC reductions but different risks of infarction highlights the failure of a single ADC measurement at 3 hours after stroke onset to accurately reflect tissue outcome and the importance of concurrent and subsequent perfusion status in this determination.
tp2 12⫾7
tp3 8⫾7
Time from symptom onset
Admission 0.9⫾0.6
Treatment (OTT) 1.9⫾0.4
tp1, hours 2.9⫾0.8
tp2, hour 6.3⫾0.3
tp3, day 29⫾10
Time from tPA treatment to scan
tp1, hour 0.7⫾0.4
tp2, hour 4.0⫾1.2
ROI volumes, mL
ROIreperf3 hours 11.3⫾14.0 ROIreperf6 hours 6.8⫾4.3 ROInonreperf 35.6⫾37.0 tPA indicates tissue plasminogen activator; NIHSS, National Institutes of Health Stroke Scale; tp, time point; OTT, onset-to-treatment time; ROI, region of interest; R, right; L, left; MCA, middle cerebral artery, ICA, internal cerebral artery.
Discussion
DWI is widely used in the clinical setting of acute stroke to delineate ischemic injury. Given its common use, it is of critical importance to improve our understanding of ADC evolution during and after ischemia. Consistent with previous reports, we found that acute changes in ADC are dependent on tissue reperfusion but not on initial severity of ADC reduction.6Moreover, a temporal delay between reperfusion
and ADC improvement was observed in some tissue. Regions with similar ADC reductions at 3 hours had different tissue outcomes depending on whether or when reperfusion occurred.
Temporal Delay Between Reperfusion and ADC Improvement
Despite the clinical use of ADC to identify ischemic injury,11
challenges remain to explain why acute ADC lesions might or might not undergo infarction12,13and why an absolute ADC
threshold for infarction has not been identified.14We have
shown that similar ADC abnormalities at tp1 correspond to different tissue fates, depending on concurrent and subse-quent perfusion status (Figure 4). Positive ⌬ADC was ob-tained from tp1 to tp2 in ROI (1)reperf_3hourthat had restored
perfusion before tp1 (Figure 3A). It demonstrates that de-pending on the elapsed time after reperfusion, different ADC values might be obtained (eg, tp1 and tp2 ADC in ROI关1兴reperf3 hour) in tissue with already improved perfusion
(Figure 3A). Our findings are consistent with a previous
animal study showing ADC reversal subsequent to tissue reperfusion7 and previous MR spectroscopy and positron
emission tomography studies demonstrating heterogeneous cellular metabolic injury in regions with similar ADC.2,15
Taken together, this evidence may help to explain why a single time point ADC threshold to predict tissue outcome has not been identified.
The biophysical mechanisms of ADC lesion reversal have not been fully determined. Previous animal studies16,17
dem-onstrated that extracellular [K⫹] began to revert to normal approximately 40 minutes after reperfusion. Meanwhile, elec-trical excitability was shown to recover after 8 to 15 minutes; synaptic excitability and low-frequency spontaneous electro-cortical activity was restored after 30 to 60 minutes and 1 to 2 hours, respectively, after reperfusion. This progressive recovery of energy metabolism and ion homeostasis after reperfusion may be related to delayed ADC improvement after reperfusion.
ADC Improvement Versus Tissue Recovery
The median risks of infarction for the 2 ROIs that exhibited reperfusion, ROI (1)reperf_3hour and ROI (2)reperf_6hour, were
64.2% and 84.3%, respectively, indicating that regions with acute ADC improvement (positive ⌬ADC) within 6 hours after symptom onset still showed a high probability of infarction. This finding is consistent with previous animal and human studies.12,13,18
Several mechanisms may be responsible for the discrep-ancy between acute ADC increase and 1-month tissue
infarc-Figure 2.Representative MR images of the participants exhibiting the 3 ROIs defined in Figure 1. Shown are MTT tp1 and tp2 (first and second columns), ADC tp1 and tp2 (third and fourth columns), and FLAIR at tp3 (fifth column). Each representative ROI (defined in Fig-ure 1) was overlaid onto the tp1 ADC (sixth column): pt 1, ROIreperf3 hour(green); pt 2, ROIreperf6 hour(blue); and pt 3, ROInonreperf(red). ROIs indicates regions of interest; MTT, mean transit time; tp, time point; ADC, apparent diffusion coefficient; FLAIR, fluid-attenuated inversion recovery; pt, patient.
tion. Ringer et al examined the histological condition of ischemic tissue exhibiting ADC reversal in rats after 30 minutes of middle cerebral artery occlusion19 followed by
successful reperfusion. MRI scans were compared with histol-ogy using neuronal, astrocytic markers, and heat shock protein 72.19 Their results suggested that neurons already exhibited
structural damage and stress despite ADC lesion reversal, whereas astrocytes were morphologically intact. Other studies
reported that reversed ADC regions had varying degrees of neuronal injury.13,18,20Moreover, several factors such as calcium
overload, free radical formation, and lactic acidosis21,22 might
trigger a delayed mitochondrial dysfunction leading to the death of these regions with normalized ADC.23–25
Study Limitations and Other Issues
In this study, only 2 time points were acquired during the hyperacute phase of ischemia to characterize lesion evolution. Although additional time points will be needed to fully document the temporal relationship between perfusion and diffusion changes during hyperacute and acute stages of ischemia, this is impractical for human studies. In addition, the number of non-tPA-treated patients was too few to determine whether tPA treatment might uniquely impact our findings. Given these limitations, to the best of our knowl-edge, this study is the first to reveal that a temporal delay exists between reperfusion and ADC improvement in human acute stroke.
Of note, there is an important difference between the previously reported pseudonormalization and the ADC evo-lution observed in our study. Pseudonormalization (normal ADC, but subsequent infarct evolution on T2-weighted im-ages) occurs between 1 and 7 days after stroke onset in humans. This phenomenon might be due to increased cerebral
Figure 3.Mean ADC from ROIreperf3 hour(A), ROIreperf6 hour(B), and ROInonreperf(C) for each individual participant at tp1 and tp2 after stroke onset. Perfusion status was labeled at both tp1 and tp2 inA–C). A scatterplot of⌬ADC in the 3 ROIs (D). †Statistical different ⌬ADC between a ROI and ROInonreperf. tPA-treated patients were marked in black, whereas untreated patients were highlighted using red. ADC, apparent diffusion coefficient; ROI, region of interest; tp, time point; tPA, tissue plasminogen activator.
Figure 4.Risk of infarction in the 3 ROIs (box⫽25th to 75th per-centile; bars⫽10th to 90th percentile). †Statistical difference between a specific ROI and ROInonreperfusing Newman-Keuls multiple comparison. ROIs indicates regions of interest.
water content associated with vasogenic edema.6,26 –28 In
contrast, ADC improvement in our study, which occurred during the first 6 hours after ischemia onset, is unlikely caused by vasogenic edema but rather in response to tissue reperfusion. Therefore, the underlying pathophysiological mechanism of the acute ADC improvement in this study likely reflects a different process from ADC pseudonormal-ization observed days after stroke.
Clinical Implications
Regions with a similar ADC reduction at 3 hours had different final outcomes depending on whether and when reperfusion occurred. In regions with reperfusion within 3 hours after stroke onset,⬍40% of tissue survived. In regions with reperfusion between 3 and 6 hours after stroke onset, risk of infarction varied in a large range with a median risk of infarction⬎80%. Because ADC may still increase over time in tissue that already reperfused, different ADC values could be obtained depending on the elapsed time after reperfusion. Therefore, a single time point ADC measurement does not fully reflect the disease process and outcome. Beyond diag-nosing acute ischemia, interpretation of ADC for tissue outcome, particularly in the presence of reperfusion, must be performed with caution.
Sources of Funding
This study was supported by grants from National Institute of Health (NIH 5P50NS055977, NIH 5R01NS054079) and the American Heart Association (AHA 0730321N).
Disclosures
None.
References
1. Lin W, Lee JM, Lee YZ, Vo KD, Pilgram T, Hsu CY. Temporal rela-tionship between apparent diffusion coefficient and absolute mea-surements of cerebral blood flow in acute stroke patients.Stroke. 2003; 34:64 –70.
2. Guadagno JV, Jones PS, Fryer TD, Barret O, Aigbirhio FI, Carpenter TA, Price CJ, Gillard JH, Warburton EA, Baron JC. Local relationships between restricted water diffusion and oxygen consumption in the ische-mic human brain.Stroke. 2006;37:1741–1748.
3. Moseley ME, Mintorovitch J, Cohen Y, Asgari HS, Derugin N, Norman D, Kucharczyk J. Early detection of ischemic injury: comparison of spectroscopy, diffusion-, T2-, and magnetic susceptibility-weighted MRI in cats.Acta Neurochir Suppl (Wien). 1990;51:207–209.
4. Kidwell CS, Saver JL, Mattiello J, Starkman S, Vinuela F, Duckwiler G, Gobin YP, Jahan R, Vespa P, Kalafut M, Alger JR. Thrombolytic reversal of acute human cerebral ischemic injury shown by diffusion/perfusion magnetic resonance imaging.Ann Neurol. 2000;47:462– 469. 5. Chalela JA, Kang DW, Luby M, Ezzeddine M, Latour LL, Todd JW,
Dunn B, Warach S. Early magnetic resonance imaging findings in patients receiving tissue plasminogen activator predict outcome: insights into the pathophysiology of acute stroke in the thrombolysis era. Ann Neurol. 2004;55:105–112.
6. Fiehler J, Foth M, Kucinski T, Knab R, von Bezold M, Weiller C, Zeumer H, Rother J. Severe ADC decreases do not predict irreversible tissue damage in humans.Stroke. 2002;33:79 – 86.
7. Davis D, Ulatowski J, Eleff S, Izuta M, Mori S, Shungu D, van Zijl PC. Rapid monitoring of changes in water diffusion coefficients during reversible ischemia in cat and rat brain. Magn Reson Med. 1994;31: 454 – 460.
8. Kidwell CS, Alger JR, Saver JL. Beyond mismatch: Evolving paradigms in imaging the ischemic penumbra with multimodal magnetic resonance imaging.Stroke. 2003;34:2729 –2735.
9. Ostergaard L, Weisskoff RM, Chesler DA, Gyldensted C, Rosen BR. High resolution measurement of cerebral blood flow using intravascular tracer bolus passages. Part I: mathematical approach and statistical anal-ysis.Magn Reson Med. 1996;36:715–725.
10. Nagesh V, Welch KM, Windham JP, Patel S, Levine SR, Hearshen D, Peck D, Robbins K, D’Olhaberriague L, Soltanian-Zadeh H, Boska MD. Time course of ADCW changes in ischemic stroke: beyond the human eye!Stroke. 1998;29:1778 –1782.
11. Albers GW, Thijs VN, Wechsler L, Kemp S, Schlaug G, Skalabrin E, Bammer R, Kakuda W, Lansberg MG, Shuaib A, Coplin W, Hamilton S, Moseley M, Marks MP. Magnetic resonance imaging profiles predict clinical response to early reperfusion: the Diffusion and Perfusion Imaging Evaluation for Understanding Stroke Evolution (DEFUSE) study.Ann Neurol. 2006;60:508 –517.
12. Kidwell CS, Saver JL, Starkman S, Duckwiler G, Jahan R, Vespa P, Villablanca JP, Liebeskind DS, Gobin YP, Vinuela F, Alger JR. Late secondary ischemic injury in patients receiving intraarterial thrombolysis.
Ann Neurol. 2002;52:698 –703.
13. Li F, Han SS, Tatlisumak T, Liu KF, Garcia JH, Sotak CH, Fisher M. Reversal of acute apparent diffusion coefficient abnormalities and delayed neuronal death following transient focal cerebral ischemia in rats.
Ann Neurol. 1999;46:333–342.
14. Fiehler J, Knudsen K, Kucinski T, Kidwell CS, Alger JR, Thomalla G, Eckert B, Wittkugel O, Weiller C, Zeumer H, Rother J. Predictors of apparent diffusion coefficient normalization in stroke patients.Stroke. 2004;35:514 –519.
15. Nicoli F, Lefur Y, Denis B, Ranjeva JP, Confort-Gouny S, Cozzone PJ. Metabolic counterpart of decreased apparent diffusion coefficient during hyperacute ischemic stroke: a brain proton magnetic resonance spectro-scopic imaging study.Stroke. 2003;34:e82– e87.
16. Heiss WD. Experimental evidence of ischemic thresholds and functional recovery.Stroke. 1992;23:1668 –1672.
17. Hossmann KA, Sakaki S, Zimmerman V. Cation activities in reversible ischemia of the cat brain.Stroke. 1977;8:77– 81.
18. van Lookeren Campagne M, Thomas GR, Thibodeaux H, Palmer JT, Williams SP, Lowe DG, van Bruggen N. Secondary reduction in the apparent diffusion coefficient of water, increase in cerebral blood volume, and delayed neuronal death after middle cerebral artery occlusion and early reperfusion in the rat. J Cereb Blood Flow Metab. 1999;19: 1354 –1364.
19. Ringer TM, Neumann-Haefelin T, Sobel RA, Moseley ME, Yenari MA. Reversal of early diffusion-weighted magnetic resonance imaging abnor-malities does not necessarily reflect tissue salvage in experimental cerebral ischemia.Stroke. 2001;32:2362–2369.
20. Li F, Silva MD, Sotak CH, Fisher M. Temporal evolution of ischemic injury evaluated with diffusion-, perfusion-, and T2-weighted MRI.
Neurology. 2000;54:689 – 696.
21. Fiskum G, Murphy AN, Beal MF. Mitochondria in neurodegeneration: acute ischemia and chronic neurodegenerative diseases.J Cereb Blood Flow Metab. 1999;19:351–369.
22. Murphy AN, Fiskum G, Beal MF. Mitochondria in neurodegeneration: bioenergetic function in cell life and death.J Cereb Blood Flow Metab. 1999;19:231–245.
23. Abe K, Aoki M, Kawagoe J, Yoshida T, Hattori A, Kogure K, Itoyama Y. Ischemic delayed neuronal death. A mitochondrial hypothesis.Stroke. 1995;26:1478 –1489.
24. Kuroda S, Katsura KI, Tsuchidate R, Siesjo BK. Secondary bioenergetic failure after transient focal ischaemia is due to mitochondrial injury.Acta Physiol Scand. 1996;156:149 –150.
25. Siesjo BK, Hu B, Kristian T. Is the cell death pathway triggered by the mitochondrion or the endoplasmic reticulum?J Cereb Blood Flow Metab. 1999;19:19 –26.
26. Warach S, Gaa J, Siewert B, Wielopolski P, Edelman RR. Acute human stroke studied by whole brain echo planar diffusion-weighted magnetic resonance imaging.Ann Neurol. 1995;37:231–241.
27. Schlaug G, Siewert B, Benfield A, Edelman RR, Warach S. Time course of the apparent diffusion coefficient (ADC) abnormality in human stroke.
Neurology. 1997;49:113–119.
28. Marks MP, Tong DC, Beaulieu C, Albers GW, de Crespigny A, Moseley ME. Evaluation of early reperfusion and IV tPA therapy using diffusion-and perfusion-weighted MRI.Neurology. 1999;52:1792–1798.