S H O R T R E P O R T
Open Access
Identification of
Phosphoglycerate Kinase 1
(PGK1)
as a reference gene for quantitative gene
expression measurements in human blood RNA
Virginia R Falkenberg, Toni Whistler, Janna
’
R Murray, Elizabeth R Unger and Mangalathu S Rajeevan
*Abstract
Background:Blood is a convenient sample and increasingly used for quantitative gene expression measurements
with a variety of diseases including chronic fatigue syndrome (CFS). Quantitative gene expression measurements require normalization of target genes to reference genes that are stable and independent from variables being tested in the experiment. Because there are no genes that are useful for all situations, reference gene selection is an essential step to any quantitative reverse transcription-PCR protocol. Many publications have described
appropriate genes for a wide variety of tissues and experimental conditions, however, reference genes that may be suitable for the analysis of CFS, or human blood RNA derived from whole blood as well as isolated peripheral blood mononuclear cells (PBMCs), have not been described.
Findings:Literature review and analyses of our unpublished microarray data were used to narrow down the pool
of candidate reference genes to six. We assayed whole blood RNA from Tempus tubes and cell preparation tube (CPT)-collected PBMC RNA from 46 subjects, and used the geNorm and NormFinder algorithms to select the most stable reference genes.Phosphoglycerate kinase 1 (PGK1)was one of the optimal normalization genes for both whole blood and PBMC RNA, however, additional genes differed for the two sample types;Ribosomal protein large, P0 (RPLP0) for PBMC RNA andPeptidylprolyl isomerase B(PPIB)for whole blood RNA. We also show that the use of a single reference gene is sufficient for normalization when the most stable candidates are used.
Conclusions:We have identifiedPGK1as a stable reference gene for use with whole blood RNA and RNA derived
from PBMC. When stable genes are selected it is possible to use a single gene for normalization rather than two or three. Optimal normalization will improve the ability of results from PBMC RNA to be compared with those from whole blood RNA and potentially allows comparison of gene expression results from blood RNA collected and processed by different methods with the intention of biomarker discovery. Results of this study should facilitate large-scale molecular epidemiologic studies using blood RNA as the target of quantitative gene expression measurements.
Background
High-throughput and quantitative gene expression stu-dies are carried out to identify biomarkers and deter-mine the pathophysiology of many complex diseases. Blood is often studied as a systemic sensor of multi-sys-tem pathology, particularly in situations where anatomic lesions are lacking or inaccessible such as chronic fati-gue syndrome (CFS) and neuropsychiatric diseases [1-4]. Peripheral blood is a convenient specimen for molecular
epidemiologic studies and is a standard clinical sample as it is collected with minimally invasive procedures.
Blood collection and processing methods vary. Periph-eral blood mononuclear cells (PBMC) may be isolated using either ficoll-hypaque purification methods or cell preparation tubes (CPT). However, isolating PBMCs requires sample processing within several hours of col-lection to assure RNA integrity and preservation of expression profile. Each of the isolations requires signifi-cant hands-on time and up to four hours to complete, making the equipment and personnel requirements for closely spaced time series impractical. Isolation of * Correspondence: [email protected]
Division of High-Consequence Pathogens and Pathology, Centers for Disease Control & Prevention, Atlanta, GA, 30333, USA
PBMCs may also lead to ex-vivochanges in their gene expression profile [5,6]. To overcome these limitations, blood collection systems that allow immediate lysis of cells and preparation of nucleic acids without prior iso-lation of PBMCs are now available from BD Diagnostics (Paxgene Blood Tube) and Applied Biosystems (Tempus Whole Blood Tube). In these methods yielding whole blood RNA, RNA stabilization and lysis buffer is mixed with the blood as it is drawn into the tube, minimizing changes from thein-vivogene expression profile. These tubes also provide an advantage for field studies as the lysed whole blood can be stored at room temperature or at 4°C for 5-7 days, or it can be stored long term at -20° C [7].
PBMCs and whole blood RNA show differences in the cell populations that contribute. PBMC RNA is from mostly T-, B-, natural killer cells and monocytes. Whole blood RNA also includes neutrophils (about 70% of white blood cells), basophils, eosinophils, granulocytes and vast numbers of red blood cells, some of which are immature and retain messenger RNA [8].
A critical need in quantitative gene expression studies is the identification of reference genes (stably expressed genes) to normalize the expression of target genes in a particular sample [9-11]. While there are studies report-ing the identification of reference genes for a variety of specimens, this information is lacking for blood in the context of different collection and processing methods. Studies of CFS with PBMCs used reference genes includingPhosphoglycerate kinase 1(PGK1) [12], Pepti-dylprolyl isomerase B(PPIB) [13], andGlyceraldehyde phosphate dehydrogenase(GAPDH) [14], while CFS stu-dies using whole blood RNA isolated from Paxgene tubes have usedTranscription factor II B (GTF2B) [15],
GAPDH[16-18], and 18S rRNA [19]. Although many of these studies compared multiple candidate genes, only one study [12] reports using currently recognized algo-rithms like geNorm [10] or NormFinder [11] to quanti-tatively assess whether these genes are the most stably expressed. Publications from other diseases that have used these algorithms have identifiedRibosomal protein large, P0(RPLP0) as a stable reference gene for ficoll-hypaque isolated PBMC [20]; whileRPLP0[20],Tyrosine 3 monooxygenase/Tryptophan 5 monooxygenase activat-ing protein, zeta polypeptide(YWHAZ) [10,21] and PPIB
[22,23] have been validated for use with whole blood RNA isolated either by lysis of red blood cells or by using the Paxgene system. Although these studies have investigated PBMC or whole blood RNA separately, a direct comparison of results from PBMC RNA and whole blood RNA where both samples were drawn from the same subjects at the same time point has not been examined. Without this direct comparison it is difficult to evaluate if there are common reference genes suitable
for both PBMC and whole blood RNA. We examined reference gene selection for quantitative reverse tran-scription PCR (qRT-PCR) using Tempus whole blood RNA and CPT isolated PBMC RNA from the same donors.
Results
The expression of candidate reference genes were mea-sured for 46 subjects, (21 CFS subjects and 25 non-fati-gued, NF, controls) using qRT-PCR. Primers and reaction efficiencies for each gene are listed in Table 1. The average crossing point (Cp) values, 25thand 75th percentile, and minimum and maximum values are shown in Figure 1, providing an indication of the overall stability and relative quantity for each gene. On average, Expressed Alu Repeats (EAR) was the most highly expressed and YWHAZ had the lowest expression in both PBMC and whole blood RNA. In terms of the standard deviations of the Cp values, genes RPLP0,
PGK1andPPIB appear to be the most stably expressed in PBMCs and PGK1, PPIB, and DNA-directed RNA polymerase II polypeptide A (220 kDa), (POLR2A) for whole blood RNA.
Results of geNorm and NormFinder analyses for refer-ence genes in PBMC and whole blood RNA are shown in Table 2, with the least stable genes at the top and the most stable at the bottom. The most variable genes as determined by the geNorm and NormFinder algorithms in PBMC RNA were EAR and POLR2AwhileYWHAZ
and RPLP0 showed the most variable expression in whole blood RNA. PGK1was identified as one of the two most stable reference genes for both PBMC and whole blood RNAs, whereas the second gene differed;
RPLP0for PBMC andPPIBfor whole blood. The Norm-Finder algorithm takes into account the classification of subjects as CFS and NF but the geNorm algorithm does not; however both algorithms identified the same two genes indicating these genes are the most stable inde-pendent from disease status.
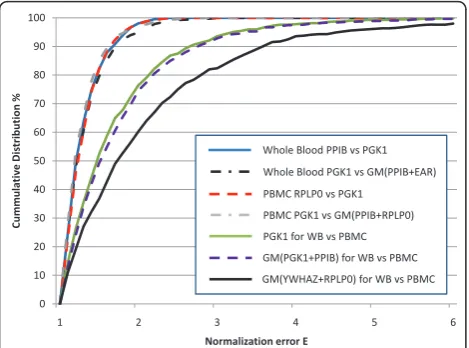
To determine whether a stably expressed single gene is sufficient for normalization of expression studies using blood RNA we used the measure of single control normalization error (E), first described by Vandesompele et al. [10] with the geNorm algorithm. E was calculated as the ratio of the ratio of two reference genes for every combination of two samples and shown as cumulative percent distribution (Figure 2). The value of E can be interpreted as the fold-error in expression (ideally 1.0) between pairs of samples, depending on the reference gene used. We followed the standard E calculation method to illustrate the normalization error contributed by the single reference gene (see data analysis section). Based on this, for the most stable genes in PBMC RNA,
less than 1.4-fold different and 90% of samples under 1.6-fold (Figure 2, red dashed line). A similar magnitude of error was observed for stable genesPPIB vsPGK1in whole blood RNA (Figure 2, blue solid line). To assess the impact of using multiple reference genes, we modi-fied the standard E algorithm where the expression of one gene was replaced by the geometric mean of multi-ple reference genes (i.e., comparing PGK1to the geo-metric mean ofPPIBandRPLP0). If the use of multiple reference genes does not change the E value then there is no advantage to using multiple genes instead of a
single gene. It is important to avoid comparing a single gene (i.e., PGK1) to any combination of genes that includes itself (i.e., PGK1 + RPLP0). Accordingly, we compared PGK1 to the geometric mean of PPIBand
RPLP0 for PBMC (Figure 2, grey dashed line) or PGK1
to the geometric mean of PPIB and EAR for whole blood (Figure 2, black dashed line). These distributions essentially overlap with those of the single gene compar-isons with PBMCs or whole blood RNA, indicating little improvement in minimizing error by including addi-tional reference genes.
To further evaluate the use of single versus multiple reference genes, E was calculated to compare the expression of PGK1in whole blood vs. PBMC of each subject. Because this comparison was between the two tissue types, the gene stability from a combined dataset including both whole blood and PBMC data was re-Figure 1.
[image:3.595.56.551.99.340.2]EAR RPLP0 PGK1 POLR2A PPIB YWHAZ Figure 1Crossing point (Cp) values for each candidate gene in Whole Blood and PBMC RNA. Boxes show the 25thand 75th percentile, with lines representing the median. The whiskers show the minimum and maximum Cp value for each gene.
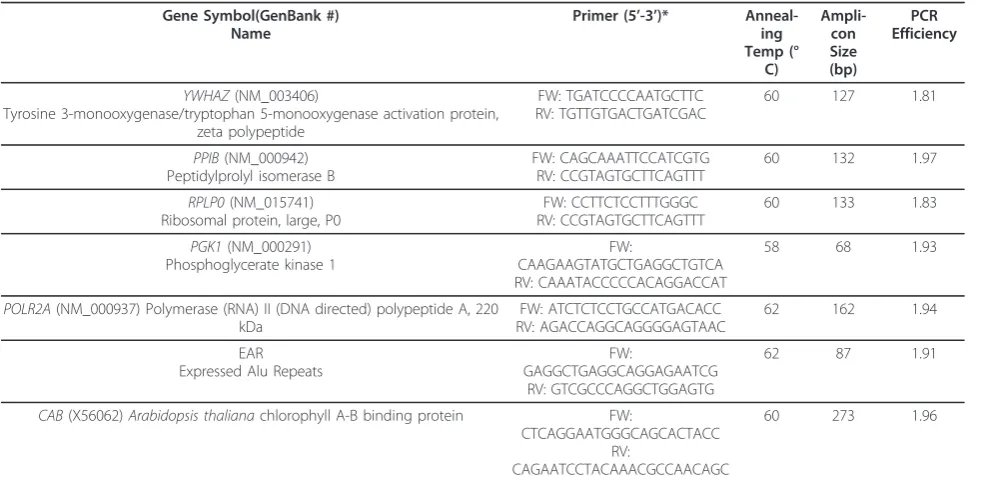
Table 1 Gene specific-primers and key PCR conditions.
Gene Symbol(GenBank #) Name
Primer (5’-3’)* Anneal-ing Temp (°
C)
Ampli-con Size (bp)
PCR Efficiency
YWHAZ(NM_003406)
Tyrosine 3-monooxygenase/tryptophan 5-monooxygenase activation protein, zeta polypeptide
FW: TGATCCCCAATGCTTC RV: TGTTGTGACTGATCGAC
60 127 1.81
PPIB(NM_000942) Peptidylprolyl isomerase B
FW: CAGCAAATTCCATCGTG RV: CCGTAGTGCTTCAGTTT
60 132 1.97
RPLP0(NM_015741)
Ribosomal protein, large, P0
FW: CCTTCTCCTTTGGGC RV: CCGTAGTGCTTCAGTTT
60 133 1.83
PGK1(NM_000291) Phosphoglycerate kinase 1
FW:
CAAGAAGTATGCTGAGGCTGTCA RV: CAAATACCCCCACAGGACCAT
58 68 1.93
POLR2A(NM_000937) Polymerase (RNA) II (DNA directed) polypeptide A, 220
kDa
FW: ATCTCTCCTGCCATGACACC RV: AGACCAGGCAGGGGAGTAAC
62 162 1.94
EAR Expressed Alu Repeats
FW:
GAGGCTGAGGCAGGAGAATCG RV: GTCGCCCAGGCTGGAGTG
62 87 1.91
CAB(X56062)Arabidopsis thalianachlorophyll A-B binding protein FW:
CTCAGGAATGGGCAGCACTACC RV:
CAGAATCCTACAAACGCCAACAGC
60 273 1.96
[image:3.595.56.292.517.686.2]*FW, forward primer; RV, reverse primer
Table 2 Reference genes listed by increasing stability in Tempus and PBMC RNA samples.
PBMC RNA Whole blood RNA
geNorm NormFinder geNorm NormFinder
POLR2A POLR2A YWHAZ YWHAZ
EAR EAR RPLP0 RPLP0
YWHAZ PPIB POLR2A EAR
PPIB YWHAZ EAR POLR2A
RPLP0-PGK1* PGK1 PPIB-PGK1* PGK1
RPLP0 PPIB
[image:3.595.304.539.608.714.2]evaluated using geNorm. The most stable genes across tissues werePPIBand PGK1while the least stable genes were RPLP0 and YWHAZ. The distributions for these comparisons shifted to the right where 70% of samples had < two-fold error and 90% of samples had < three-fold error. The use of a single gene, PGK1, (Figure 2, green solid line) results in lower values of E than the geometric mean of the most stable (PGK1 and PPIB) (Figure 2, purple dashed line) and unstable (YWHAZ
andRPLP0) (Figure 2, black solid line) gene pairs. The trend for higher E values when additional reference genes are included also supports the use of a single reference gene for normalization.
Discussion
From a panel of candidate genes selected using informa-tion from our own microarray studies and the published literature this study identified PGK1as one of the most stable reference genes for both PBMC and whole blood RNAs by geNorm and NormFinder, two widely used algorithms based on different principles for reference
gene selection [10,11]. Additional support for the use of
[image:4.595.57.292.89.263.2]PGK1as a stably expressed reference gene is provided by the minimal standard deviation in the Cp values (Fig-ure 1), and the essentially overlapping E-value distribu-tions with the single and multiple gene comparisons (Figure 2).
The geNorm algorithm is based on pair-wise compari-son of genes in a set of samples and selects genes with the most stable expression ratio. One drawback to this method is that two genes may have stable expression ratios because they are coordinately regulated. Since we selected candidate genes from different functional classes, contribution of coordinate regulation in the sta-bility index is unlikely. The NormFinder algorithm pro-vides a direct measure of variability in expression, within and between groups and confirms that there is not any inter-group variability (i.e. between cases and controls) in the expression of the candidate gene. Con-sidering some fundamental differences between these two algorithms, it is interesting that they identified the same pairs of stable genes for both PBMC RNA (RPLP0
andPGK1) and whole blood RNA (PPIBand PGK1). The widely recognized geNorm algorithm argues for the use of multiple reference genes for normalization of qRT-PCR through the measure of single control nor-malization error, E[10]. This earlier report showed con-siderable variation in single gene expression in a variety of tissues (3 and 6.4 fold at the 75thand 90thpercentile respectively). In our study with PBMC and whole blood RNA, the calculated E for our two most stable single gene measures have much lower fold-differences where our plots are closer to the systematic error plotted in Vandesompele et al., with a 75th percentile of 1.4 and 90thpercentile of 1.7. This shows quantitatively that the basis for requiring multiple genes for normalization is dependent on the stability of the candidate genes and in the case where stable genes are selected, it is not neces-sary to use more than one gene for data normalization. A limitation of this analysis is the inability to compare
PGK1to a normalization factor that includesPGK1and the second most stable gene within a single tissue type. However, it is not a limitation when using the E algo-rithm to evaluate whole blood and PBMC samples from the same subject. The use of a single gene,PGK1 and the two most stable genes (PGK1andPPIB) had similar distributions in this cross-tissues analysis further sup-porting the use of a single gene for normalization. The higher values of E for these comparisons across two dif-ferent tissue types are expected and indicate that < 3-fold differences are not likely to be meaningful when doing this kind of cross-tissue comparison.
The most variable genes identified in Tempus whole blood RNA includeYWHAZ andRPLP0; contradicting previous whole blood RNA studies using the Paxgene 0
10 20 30 40 50 60 70 80 90 100
1 2 3 4 5 6
Cummula
tiv
e Dis
tribution %
Normalization error E
Whole Blood PPIB vs PGK1
PBMC PGK1 vs GM(PPIB+RPLP0) PBMC RPLP0 vs PGK1
GM(PGK1+PPIB) for WB vs PBMC Whole Blood PGK1 vs GM(PPIB+EAR)
GM(YWHAZ+RPLP0) for WB vs PBMC PGK1 for WB vs PBMC
system [10,20,21]. This discrepancy can be explained by the use of a different pool of candidate genes and our selection of candidates previously identified as stably expressed. The reference genes EAR and POLR2Awere the most variable genes in PBMC RNA in this study.
POLR2A was selected based on preliminary analysis of microarrays done using Tempus whole blood RNA. We included EAR as a potential reference standard based on a recent report [24] that advocated the use of these widely expressed 300 bp repeat sequences as a global normalization method based on analysis of whole blood RNA from Paxgene tubes. The high variability of EAR andPOLR2A in PBMC RNA may reflect differences in cell populations, and in whole blood the high percentage of a single cell type (neutrophils) may contribute to the reduced variability of these genes.
Conclusion
We have identified stable reference genes for use with whole blood RNA and RNA derived from PBMC. When stable genes are selected it is possible to use a single gene for normalization rather than two or three. The identification ofPGK1 as a suitable reference gene for both PBMC and whole blood RNA, despite differ-ences in cell composition, shows there is clearly a rela-tionship between these two samples. Optimal normalization will improve the ability of results from PBMC RNA to be compared with those from whole blood RNA and potentially allows comparison of gene expression results from blood RNA collected and pro-cessed by different methods with the intention of bio-marker discovery. However, normalization will never fully compensate for the differences in sample compo-sition. Investigators must recognize that while both samples originate from peripheral blood, they are actu-ally different“tissues” because of cell fractionation that occurs during processing. Results of this study should facilitate large-scale molecular epidemiologic studies using blood RNA as the target of quantitative gene expression measurements.
Materials and methods Subjects
The samples used in this analysis were obtained from a population based study of CFS in Georgia, USA that adhered to human experimental guidelines of the U.S. Department of Health and Human Services and the Hel-sinki Declaration. The CDC Human Subjects committee approved the study protocol, and all subjects gave informed consent. Our analysis included samples from 46 subjects (21 CFS and 25 NF), a subset of total enroll-ment. CFS cases were identified based on the 1994 international research definition of CFS as operationa-lized by standardized questionnaires including the
Multidimensional Fatigue Inventory, the SF-36®Health Survey, and the CDC symptom inventory [25].
Gene Selection
Candidate reference genes were selected by three sepa-rate methods. Four genes were selected based on careful review of the literature focused on previous analyses of genes suitable for gene expression studies using PBMC:
YWHAZ,HUPO, PPIB, andPGK1[12,13,20,23]. Because we could not find published studies examining what genes might be suitable for analysis of Tempus RNA, we used preliminary data from microarray analysis of these samples to select POLR2A. We used Tempus RNA for global gene expression analysis using the Human Exon Array (Affymetrix, CA). In this population-based case-control study, each subject has array results from blood collected into Tempus tubes at several time points. Results from preliminary microarray analysis were aver-aged and the coefficient of variation (CV) calculated for subjects grouped by either disease status or by time point. In order to select a gene that is not differentially expressed over the time course of the experiment or by disease status; we selected the least variable gene that had approximately equal CV in both. Based on this ana-lysis POLR2A was selected as a candidate endogenous control for Tempus RNA samples.POLR2Awas the 18th least variable gene out of 17,629 genes when based on the time course alone, and the 590thleast variable gene when sorted based on disease status alone. We included EAR based on a recent report advocating the utility of EAR as a potential endogenous control [24] for human blood because these repetitive 300 bp Alu sequences are scattered throughout the human genome with appar-ently no tissue-specificity in their expression. Table 1 shows the panel of candidate reference genes, exogenous spike-in transcript and their PCR primers. We used published primer sequences for EAR, PPIB, andPGK1
whereas we designed primers forPOLR2A, RPLP0, and
YWHAZ genes using Primer 3 v.0.4.0 [26]. Except for EAR, all gene-specific primers are intron-spanning.
Blood collection and RNA extraction
manufacturer’s protocol (Sigma, MO). Tempus tubes were frozen at -20°C until extraction (< one month). RNA was extracted from Tempus tube blood using the 5 PRIME Perfect Pure RNA Cultured Cell Kit (Fisher, PA). For all samples, RNA quality and quantity were assessed using Agilent 2100 Bioanalyzer RNA Nano Chips (Agilent Technologies, CA) and a Nanodrop 1000 spectrophotometer (Thermo Scientific, DE). Nanodrop concentrations were used to set up reactions.
Reverse Transcription (RT)
RNA (500 ng) was DNase I treated in a 10 μl volume using the MessageClean® Kit (GenHunter, TN) and then reverse transcribed in the same tubes using 20 μl reactions with Superscript™ III (Invitrogen, CA) and a combination of Oligo(dT) and random hexanucleotide primers (2.5 μM each) in the presence of 25 pg of a plant gene spike-in chlorophyll a/b binding protein
(CAB) mRNA. (Stratagene, CA). Two microliters of the RT reaction was removed prior to the addition of RT enzyme to serve as no-RT control for detecting DNA contamination. HeLa cell cDNA was synthesized to serve as template for a standard curve in the LightCycler reactions.
PCR
PCR (20μl) was performed using the LightCycler 480 with the SybrGreen 480 Master Mix (Roche Applied Sciences, IN) and contained 2 μl of 1:20 dilution of cDNA and 0.5μM of each primer. Thermal cycling con-ditions were as follows: 1 cycle of 94°C for 5 minutes, 50 cycles of 94°C 15 seconds, annealing temperature (speci-fic for each transcript in Table 1) for 15 seconds, and 72°C 15 seconds. Cp values were determined using the Roche LightCycler software (v1.5.0 SP1) by the second-derivative maximum method for each of the amplifica-tions and compared to a standard curve created from six 5-fold dilutions of HeLa cell cDNA, starting at 1.25 ng/μl. Efficiency of each reaction determined from the standard curve is shown in Table 1. The external con-trol plant geneCAB had an average Cp value of 19.38 ± 0.56 (CV, 2.9%). The variability of CABmeasurements was within 1.5 fold for > 90% of samples.
Data analysis
The standard curve normalized values for expression of each of the 6 candidate genes were used in two algo-rithms (geNorm and NormFinder) to determine the most stable genes for both PBMC and whole blood RNA. geNorm version 3.5, is a VBA applet that works with Microsoft Excel [10]. Briefly, geNorm calculates a gene stability measure (M) for each gene where M value increases with decreasing stability of gene expression. The gene with the least stability is removed from the
analysis and M values are recalculated until the two most stable genes remain. A normalization factor is cal-culated based on the geometric mean of the selected reference genes. The NormFinder algorithm v 0.953 [11] uses a statistical model to estimate the overall expres-sion variation for each candidate gene. This generates a stability value that is related to the systematic error that would be introduced when using each candidate for normalization.
The single control normalization error or E was ori-ginally described by Vandesompele et al. [10]. We have used this algorithm to compare the use of a single refer-ence gene (PGK1) to the use of a normalization factor consisting of the geometric mean of two reference genes. The modified algorithm we used is as follows: for any givenm subjects (samples), gene expression levels from real-time PCR of selected reference genes are mea-sured (a). For every combination of two subjects, pand
q and a combination of reference genes j and k the measurement error forjvs kor the E value is calculated and represents the fold-expression difference between samplesp andqwhen normalized toj vsk. The equa-tion isRjkpq= aqj/aqk *apk/apj(if R < 1 then E =R-1, else E =R). For example when comparing two distinct reference genes such asPGK1 and PPIB, in samples 1 and 2, the resulting equation isR = (PGK1in sample 1/
PPIBin sample 1) * (PPIBin sample 2/PGK1in sample 2) (if Ris less than one take the reciprocal R-1to equal E otherwise R = E). This equation PGK1/PPIB *PPIB/ PGK1 should equal 1 if the measurements ofPPIBand
PGK1are constant in both samples. The same equation is performed for all possible comparisons of samples and the cumulative distribution of the E value or fold error are plotted for Figure 2. We further modified this equation so that instead of assessing two single refer-ence genes, we could look at the E value when a nor-malizing factor (such as the geometric mean of multiple reference genes) is used. This was accomplished by replacing eitherj orkwith the geometric mean of mul-tiple genes as calculated for that sample. The new equa-tion then essentially measures PGK1/(geometric mean of PPIB andRPLP0) * (geometric mean of PPIB and
RPLP0)/PGK1 and this equation would also be equal to 1 if expression of both the genes was constant. Clearly as this equation is based on the ratio of jandk then it is not appropriate to include the same gene as a part of both j and k. (i.e., it is not meaningful to compare
remaining genes,PPIBandRPLP0 for PBMC andPPIB
and EAR for whole blood.
For cross-tissues comparison, E was calculated by sub-stituting the variablesjandkfor PBMC or whole blood values of expression for a reference gene or the geo-metric mean of multiple reference genes for each sub-ject. The resulting equation isR = (PGK1 in subject 1 PBMC/PGK1in subject 1 whole blood) * (PGK1in sub-ject 2 whole blood/PGK1 in subject 2 PBMC) (if R is less than one take the reciprocalR-1to equal E other-wise R = E). For determining the impact of multiple reference genes in the cross tissue comparison, we com-bined both PBMC and whole blood expression values into a single file and then used geNorm to identify the most stable (PGK1andPPIB) and least stable (RPLP0,
YWHAZ) genes.
Acknowledgements
Support for J. Murray was administered by the Oak Ridge Institute for Science and Education through an interagency agreement between the U.S. Department of Energy and the CDC.
The findings and conclusions in this report are those of the authors and do not necessarily represent the views of the funding agency.
Authors’contributions
VRF carried out the gene selection, qRT-PCR and analysis, and drafted the manuscript. JM carried out the RNA preparation and quality analysis. TW contributed microarray data used in gene selection. VRF, MSR, TW and ERU participated in the design and interpretation of the study. ERU, MSR and VRF conceived and coordinated the study. All authors contributed to manuscript writing, and read and approved the final manuscript.
Competing interests
The authors declare that they have no competing interests.
Received: 2 May 2011 Accepted: 6 September 2011 Published: 6 September 2011
References
1. van Heerden JH, Conesa A, Stein DJ, Montaner D, Russell V, Illing N:Parallel changes in gene expression in peripheral blood mononuclear cells and the brain after maternal separation in the mouse.BMC Res Notes2009,
2:195.
2. Gladkevich A, Kauffman HF, Korf J:Lymphocytes as a neural probe: potential for studying psychiatric disorders.Prog Neuropsychopharmacol
Biol Psychiatry2004,28:559-576.
3. Tang Y, Lu A, Aronow BJ, Sharp FR:Blood genomic responses differ after stroke, seizures, hypoglycemia, and hypoxia: blood genomic fingerprints of disease.Ann Neurol2001,50:699-707.
4. Rollins B, Martin MV, Morgan L, Vawter MP:Analysis of whole genome biomarker expression in blood and brain.Am J Med Genet B
Neuropsychiatr Genet2010,153B:919-936.
5. Baechler EC, Batliwalla FM, Karypis G, Gaffney PM, Moser K, Ortmann WA, Espe KJ, Balasubramanian S, Hughes KM, Chan JP,et al:Expression levels for many genes in human peripheral blood cells are highly sensitive to ex vivo incubation.Genes Immun2004,5:347-353.
6. Debey S, Schoenbeck U, Hellmich M, Gathof BS, Pillai R, Zander T, Schultze JL:Comparison of different isolation techniques prior gene expression profiling of blood derived cells: impact on physiological responses, on overall expression and the role of different cell types.
Pharmacogenomics J2004,4:193-207.
7. Tempus Blood Tube Stabilization and Isolation of RNA from Whole Blood.[http://www3.appliedbiosystems.com/cms/groups/mcb_support/ documents/generaldocuments/cms_041398.pdf].
8. Haley PJ:Species differences in the structure and function of the immune system.Toxicology2003,188:49-71.
9. Huggett J, Dheda K, Bustin S, Zumla A:Real-time RT-PCR normalisation; strategies and considerations.Genes Immun2005,6:279-284. 10. Vandesompele J, De Preter K, Pattyn F, Poppe B, Van Roy N, De Paepe A,
Speleman F:Accurate normalization of real-time quantitative RT-PCR data by geometric averaging of multiple internal control genes.Genome Biol2002,3:RESEARCH0034.
11. Andersen CL, Jensen JL, Orntoft TF:Normalization of real-time quantitative reverse transcription-PCR data: a model-based variance estimation approach to identify genes suited for normalization, applied to bladder and colon cancer data sets.Cancer Res2004,64:5245-5250. 12. Whistler T, Fletcher MA, Lonergan W, Zeng XR, Lin JM, Laperriere A,
Vernon SD, Klimas NG:Impaired immune function in Gulf War Illness.
BMC Med Genomics2009,2:12.
13. Sorensen B, Jones JF, Vernon SD, Rajeevan MS:Transcriptional control of complement activation in an exercise model of chronic fatigue syndrome.Mol Med2009,15:34-42.
14. Kaushik N, Fear D, Richards SC, McDermott CR, Nuwaysir EF, Kellam P, Harrison TJ, Wilkinson RJ, Tyrrell DA, Holgate ST, Kerr JR:Gene expression in peripheral blood mononuclear cells from patients with chronic fatigue syndrome.J Clin Pathol2005,58:826-832.
15. Light AR, White AT, Hughen RW, Light KC:Moderate exercise increases expression for sensory, adrenergic, and immune genes in chronic fatigue syndrome patients but not in normal subjects.J Pain2009,
10:1099-1112.
16. Saiki T, Kawai T, Morita K, Ohta M, Saito T, Rokutan K, Ban N:Identification of marker genes for differential diagnosis of chronic fatigue syndrome.
Mol Med2008,14:599-607.
17. Kerr JR, Petty R, Burke B, Gough J, Fear D, Sinclair LI, Mattey DL, Richards SC, Montgomery J, Baldwin DA,et al:Gene expression subtypes in patients with chronic fatigue syndrome/myalgic encephalomyelitis.J Infect Dis
2008,197:1171-1184.
18. Zhang L, Gough J, Christmas D, Mattey DL, Richards SC, Main J, Enlander D, Honeybourne D, Ayres JG, Nutt DJ, Kerr JR:Microbial infections in eight genomic subtypes of chronic fatigue syndrome/myalgic
encephalomyelitis.J Clin Pathol2010,63:156-164.
19. Byrnes A, Jacks A, Dahlman-Wright K, Evengard B, Wright FA, Pedersen NL, Sullivan PF:Gene expression in peripheral blood leukocytes in monozygotic twins discordant for chronic fatigue: no evidence of a biomarker.PLoS One2009,4:e5805.
20. Dheda K, Huggett JF, Bustin SA, Johnson MA, Rook G, Zumla A:Validation of housekeeping genes for normalizing RNA expression in real-time PCR.
Biotechniques2004,37:112-114, 116, 118-119.
21. Carrol ED, Salway F, Pepper SD, Saunders E, Mankhambo LA, Ollier WE, Hart CA, Day P:Successful downstream application of the Paxgene Blood RNA system from small blood samples in paediatric patients for quantitative PCR analysis.BMC Immunol2007,8:20.
22. Pachot A, Blond JL, Mougin B, Miossec P:Peptidylpropyl isomerase B (PPIB): a suitable reference gene for mRNA quantification in peripheral whole blood.J Biotechnol2004,114:121-124.
23. Stamova BS, Apperson M, Walker WL, Tian Y, Xu H, Adamczy P, Zhan X, Liu DZ, Ander BP, Liao IH,et al:Identification and validation of suitable endogenous reference genes for gene expression studies in human peripheral blood.BMC Med Genomics2009,2:49.
24. Marullo M, Zuccato C, Mariotti C, Lahiri N, Tabrizi SJ, Di Donato S, Cattaneo E:Expressed Alu repeats as a novel, reliable tool for normalization of real-time quantitative RT-PCR data.Genome Biol2010,
11:R9.
25. Reeves WC, Wagner D, Nisenbaum R, Jones JF, Gurbaxani B, Solomon L, Papanicolaou DA, Unger ER, Vernon SD, Heim C:Chronic fatigue syndrome–a clinically empirical approach to its definition and study.
BMC Med2005,3:19.
26. Rozen S, Skaletsky H:Primer3 on the WWW for general users and for biologist programmers.Methods Mol Biol2000,132:365-386.
doi:10.1186/1756-0500-4-324