In situ
small-angle X-ray scattering studies of
sterically-stabilized diblock copolymer
nanoparticles formed during
polymerization-induced self-assembly in non-polar media
†
Matthew J. Derry,*aLee A. Fielding,‡aNicholas J. Warren,aCharlotte J. Mable,a Andrew J. Smith,bOleksandr O. Mykhaylyk*aand Steven P. Armes*a
Reversible addition–fragmentation chain transfer (RAFT) dispersion polymerization of benzyl methacrylate (BzMA) is utilized to prepare a series of poly(stearyl methacrylate)–poly(benzyl methacrylate) (PSMA– PBzMA) diblock copolymer nano-objects at 90 C directly in mineral oil. Polymerization-induced self-assembly (PISA) occurs under these conditions, with the resulting nanoparticles exhibiting spherical, worm-like or vesicular morphologies when using a relatively short PSMA13 macromolecular chain transfer agent (macro-CTA), as confirmed by transmission electron microscopy (TEM) and small-angle X-ray scattering (SAXS) studies. Only kinetically-trapped spherical nanoparticles are obtained when using longer macro-CTAs (e.g.PSMA18or PSMA31), with higher mean degrees of polymerization (DPs) for the PBzMA core-forming block simply producing progressively larger spheres. SAXS is used for thefirst time to monitor the various morphological transitions that occur in situ during the RAFT dispersion polymerization of BzMA when targeting either spheres or vesicles as thefinal copolymer morphology. This powerful characterization technique enables the evolution of particle diameter, mean aggregation number, number of copolymer chains per unit surface area (Sagg) and the distance between adjacent copolymer chains at the core–shell interface (dint) to be monitored as a function of monomer conversion for kinetically-trapped spheres. Moreover, the gradual evolution of copolymer morphology during PISA is confirmed unequivocally, with approximate‘lifetimes’assigned to the intermediate pure sphere and worm morphologies when targeting PSMA13–PBzMA150vesicles. Within vesicle phase space, the membrane thickness (Tm) increases monotonically with PBzMA DP. Furthermore, a combination of dynamic light scattering (DLS), TEM andpost mortem SAXS studies indicate that the lumen volume is reduced while the overall vesicle dimensions remain essentially constant. Thus the constrained vesicles grow inwards, as recently reported for an aqueous PISA formulation. This suggests a universal vesicle growth mechanism for all PISA formulations.
Introduction
It has been known for more than y years that diblock copolymers self-assemble to form well-dened nanoparticles when dispersed in a selective solvent for one of the blocks.1–4For
example, there is a vast range of literature describing the micellar self-assembly of polystyrene-based block copolymers in non-polar media: spherical morphologies are obtained in most cases,5–11 but examples of worm-like (or cylindrical)9–13 and
vesicular11 morphologies have also been reported. More
recently, metal-containing diblock copolymers have been utilized for the formation of cylindrical micelles in n -alkanes.14–16 The commercial potential for diblock copolymer
nanoparticles dispersed in non-polar solvents was highlighted by Zheng et al., who reported that spherical nanoparticles of
approximately 40 nm diameter offer enhanced boundary
aDepartment of Chemistry, The University of Sheffield, Dainton Building, Brook Hill, Sheffield, South Yorkshire, S3 7HF, UK. E-mail: s.p.armes@sheffield.ac.uk; o. mykhaylyk@sheffield.ac.uk; m.derry@sheffield.ac.uk
bDiamond Light Source Ltd, Diamond House, Harwell Science and Innovation Campus, Didcot, Oxfordshire, OX11 0DE, UK
†Electronic supplementary information (ESI) available: Experimental details including in situSAXS measurements; synthesis and characterization of (co) polymers; kinetic study for the synthesis of a PSMA31 macro-CTA; data
modelling for in situ SAXS experiments including kinetic renormalization, determination of BzMA monomer within the nanoparticle cores and estimation of the standard deviation in the molecular weight distribution; example 2D SAXS patterns; TEM images of octopi and jellysh; DLS, TEM and SAXS analyses of PSMA13–PBzMAxvesicles; SAXS models used for spherical micelles and vesicles. See DOI: 10.1039/c6sc01243d
‡Present address: The School of Materials, The University of Manchester, Oxford Road, Manchester, M13 9PL, UK.
Cite this:Chem. Sci., 2016,7, 5078
Received 18th March 2016 Accepted 17th April 2016
DOI: 10.1039/c6sc01243d
www.rsc.org/chemicalscience
Science
EDGE ARTICLE
Open Access Article. Published on 18 April 2016. Downloaded on 09/08/2016 12:36:24.
This article is licensed under a
Creative Commons Attribution 3.0 Unported Licence.
View Article Online
lubrication performance when dispersed in base oil.17
More-over, self-assembled block copolymer nanoparticles have been shown to act as effective dispersants for diesel soot, which in turn minimizes wear and hence improves engine efficiency and long-term performance.18,19
Recently, there has been considerable interest in the
devel-opment of polymerization-induced self-assembly (PISA),
particularly using reversible addition–fragmentation chain transfer (RAFT)20–22 dispersion polymerization.23–27 PISA
provides an efficient and versatile route to diblock copolymer nanoparticles directly at high solids without the need for post-polymerization processing, making this approach amenable to scale-up.28 Most of the PISA literature has focused on
opti-mizing aqueous26,29–40or alcoholic41–53formulations. In contrast,
there are relatively few examples of suitable PISA formulations conducted in non-polar solvents such asn- oriso-alkanes.54–62
Charleux and co-workers evaluated dithiobenzoate and trithio-carbonate RAFT chain transfer agents (CTAs) for the polymeri-zation of methyl acrylate in iso-dodecane.54,55However, broad
molecular weight distributions and low blocking efficiencies (i.e.inefficient re-initiation of the macro-CTA) were achieved, suggesting rather poor control. Fielding et al.57 reported
reasonably well-controlled RAFT polymerizations for the synthesis of poly(lauryl methacrylate)–poly(benzyl
methacry-late) (PLMA–PBzMA) diblock copolymer nanoparticles in
n-heptaneviaPISA. In this case, either spheres, worms or vesi-cles could be obtained provided that the PLMA stabilizer block was sufficiently short to enable efficient sphere–sphere fusion to occur during PISA. The construction of a phase diagram facilitated reproducible targeting of the worm phase, with these highly anisotropic nanoparticles forming free-standing gels in n-heptane at 20C.57Derryet al.28recently revisited this RAFT
dispersion polymerization formulation and developed a highly convenient‘one-pot’protocol for the synthesis of PLMA-PBzMA spheres in mineral oil at high solids. This work highlights the potential industrial relevance of such PISA formulations.
Small-angle X-ray scattering (SAXS) techniques have been employed to characterize nanoparticle morphologies obtained by various PISA formulations.38,48,58,62–70In particular,
thermally-induced micelle-to-unimer64,65 and worm-to-sphere58,64,65
tran-sitions have been studied, as well as the evolution of vesicle dimensions on increasing the mean degree of polymerization (DP) of the core-forming block.67Most notably for non-polar
formulations, heating a free-standing PLMA–PBzMA worm gel in n-dodecane to 160 C resulted in the formation of a
free-owing dispersion of spheres.58 This change in copolymer
morphology was attributed to ingress of hot solvent leading to surface plasticization of the core-forming PBzMA block, as
indicated by variable-temperature 1H NMR studies. Such
solvation lowers the packing parameter30and hence drives the
worm-to-sphere transition, which was conrmed by trans-mission electron microscopy (TEM) studies.58SAXS was
partic-ularly useful for characterizing this specic formulation, since the reduction in the mean worm contour length (Lw) could be
monitored on heating from 20C (Lwz600 nm) to 90C (Lwz
350 nm), with spherical nanoparticles of 17 nm diameter being observed at 160C. In related work, Lowe and co-workers used TEM and dynamic light scattering (DLS) to demonstrate a worm-to-sphere transition for PSMA–PPPMA nanoparticles in n-tetradecane59 and n-octane,61 with 1H NMR spectroscopy
conrming a similar surface plasticization effect for the core-forming PPPMA block on heating to 95C. Recently, SAXS has been utilized to characterize microphase separation within block copolymer microparticles,71 with time-resolved studies
being conducted during the synthesis of poly(methyl methac-rylate)–poly(benzyl methacrylate) (PMMA–PBzMA) block copol-ymers via RAFT dispersion polymerization in supercritical CO2.72
Herein we report the PISA synthesis of poly(stearyl methac-rylate)–poly(benzyl methacrylate) (PSMA–PBzMA) diblock copolymer nano-objects directly in mineral oil (see Scheme 1). We demonstrate that PSMA offers signicant advantages over PLMA in terms of both blocking efficiency and control during the RAFT dispersion polymerization of BzMA. A detailed phase diagram is constructed for this new dispersion polymerization formulation using TEM, while DLS and SAXS are utilized to characterize the nanoparticle dispersions. In particular, we utilize a synchrotron source to conduct SAXS studies of thein situevolution of the copolymer morphology during PISA. SAXS provides remarkably detailed insights regarding the sphere-to-worm and sphere-to-worm-to-vesicle transitions during this non-aqueous PISA formulation and also sheds new light on the mechanism of in situvesicle growth.
Results and discussion
Synthesis of macro-CTAsRAFT solution polymerization of stearyl methacrylate (SMA) was conducted in toluene at 70 C using cumyl dithiobenzoate (CDB) as a CTA. Three PSMA macro-CTAs were characterized
Scheme 1 Synthesis of a poly(stearyl methacrylate) (PSMA) macro-CTAviaRAFT solution polymerization in toluene at 70C, followed by RAFT dispersion polymerization of benzyl methacrylate (BzMA) in mineral oil at 90C.
Open Access Article. Published on 18 April 2016. Downloaded on 09/08/2016 12:36:24.
This article is licensed under a
using1H NMR spectroscopy and the mean degree of polymeri-zation (DP) was calculated to be 13, 18 or 31 (see ESI, Table S1†). Each homopolymerization was quenched at 72% to 76% conversion in order to avoid monomer-starved conditions, thus ensuring the retention of RAFT end-groups.73,74This is usually
required for high blocking efficiencies and hence well-dened PSMA–PBzMA diblock copolymers. Each PSMA macro-CTA had a polydispersity (Mw/Mn) of #1.24, which is consistent with
previous studies reporting well-controlled RAFT syntheses under these conditions.57A typical kinetic study of the synthesis
of a PSMA31macro-CTAviaRAFT solution polymerization was
conducted (Fig. S3a†). Aer an initial induction period, rst-order kinetics were observed prior to quenching at 72% conversion aer 10 h. Gel permeation chromatography (GPC) analysis indicated a linear evolution of molecular weight with conversion (Fig. S3b†).
PSMA18–PBzMAxand PSMA31–PBzMAxdiblock copolymer spheres
BzMA monomer was polymerized using two of the low poly-dispersity PSMA macro-CTAs (DP¼18, or 31) in turnviaRAFT dispersion polymerization (see ESI, Table S2†). In all cases,
$97% BzMA conversion was achieved within 5 h at 90C, as judged by1H NMR spectroscopy. Only spherical morphologies were obtained when using a longer PSMA stabilizer block (DP¼ 18 or 31). This indicates that the upper limit PSMA DP for access to higher order morphologies (i.e. worms or vesicles) is rela-tively low for this PISA formulation in mineral oil. Longer PSMA stabilizer blocks confer enhanced steric stabilization, which prevents the efficient 1D fusion of multiple spheres and there-fore the formation of anisotropic worms. Similar observations were reported for PLMA–PBzMA diblock copolymers prepared via RAFT dispersion polymerization of BzMA in n-heptane,57
n-dodecane58 and mineral oil.28 In these earlier studies, the
upper limit PLMA stabilizer DP which allowed access to higher order morphologies was 16–18. Given the relative molecular volumes of the LMA (C12side-chain) and SMA (C18side-chain)
repeat units, it is reasonable that using PSMA18 only allows
access to spheres. Clearly, PSMA13has a comparable molecular
volume to that of PLMA18, which is why using the former
macro-CTA allows access to worms and vesicles, as well as spheres. Compared to related RAFT dispersion polymerization syntheses conducted in non-polar media,54–58 the present
PSMA–PBzMA formulation enables relatively narrow molecular weight distributions to be obtained even when targeting PBzMA DPs as high as 500, which corresponds to an experimentally determined Mn of 56 kg mol1 (Fig. 1). GPC analysis of
PSMA31–PBzMAx(x# 500) diblock copolymers in THF eluent
indicatesMw/Mnvalues ranging between 1.19 and 1.30, which
suggests good RAFT control. Also, the unimodal nature of these curves and the clear shifrom the original PSMA31macro-CTA
indicates relatively high blocking efficiencies. In contrast, relatively broad molecular weight distributions (Mw/Mn> 1.50)
were reported by Fieldinget al.when targetingxvalues above 300 for PLMA37–PBzMAxdiblock copolymersviaclosely-related
PISA syntheses conducted inn-heptane.57However, it is not yet
understood why simply using a PSMA macro-CTA instead of a PLMA macro-CTA leads to signicantly better pseudo-living character during the dispersion polymerization of BzMA.
A series of spherical nanoparticles with tunable diameters was conveniently prepared in mineral oil at 20% w/w solids simply by varying the target DP of the core-forming PBzMA block when using a PSMA macro-CTA with a sufficiently high DP. For example, PSMA18–PBzMAxspheres ranging from 23 to
135 nm diameter (as judged by DLS) were obtained when tar-geting xvalues of 50 to 800. Similarly, well-dened PSMA31– Fig. 1 THF gel permeation chromatograms (vs.poly(methyl methac-rylate) standards) obtained for three PSMA31–PBzMAxdiblock copol-ymers preparedviaRAFT dispersion polymerization of BzMA in mineral oil at 90C at 20% w/w solids. The precursor PSMA31 macro-CTA (prepared in toluene at 70C at 40% w/w solids; black dashed curve) is also shown as a reference.
Fig. 2 Relationship between intensity-average sphere diameter (D) and target DP of the PBzMA block (x) for series of PSMA18–PBzMAx(red circles) and PSMA31–PBzMAx (black squares) diblock copolymer spheres prepared via RAFT dispersion polymerization of BzMA in mineral oil at 90C. The error bars represent the standard deviation of the diameter andais the scaling factor.
Open Access Article. Published on 18 April 2016. Downloaded on 09/08/2016 12:36:24.
This article is licensed under a
[image:3.595.313.544.47.241.2] [image:3.595.306.548.473.659.2]PBzMAxspheres of 25 to 154 nm diameter were produced forx
¼50 to 2000. The mean sphere diameter,D, is related to the mean DP of the core-forming block,x, by a scaling exponent,a, as indicated by the equationDkxawherekis a constant.75,76
Fig. 2 shows double-logarithmic plots ofD, as judged by DLS, against x for each series of PSMA18–PBzMAx and PSMA31–
PBzMAxspheres. A clear relationship is observed in each case,
which enables the corresponding scaling exponent (a) to be determined. This parameter provides important information regarding the behavior of the PBzMA core-forming chains. For the PSMA31–PBzMAxseries wend thata¼0.50, which
corre-sponds to unperturbed PBzMA chains.75,76,80According to the
literature, such low a values suggest weak segregation (and minimal solvation).75,76,80On the other hand, wend thata¼
0.61 for the PSMA18–PBzMAxseries, indicating that the PBzMA
chains are more stretched and may have a nite degree of solvation. This means that, for a given PBzMAxblock (wherex>
50), larger spheres are always obtained when using the shorter PSMA18stabilizer block. For example, DLS studies indicate that
spheres obtained when targeting a core-forming PBzMA DP of
400 are larger when using the PSMA18 macro-CTA (93 nm)
compared to the PSMA31macro-CTA (62 nm).
In situSAXS studies of the PISA synthesis of PSMA31–
PBzMA2000spheres
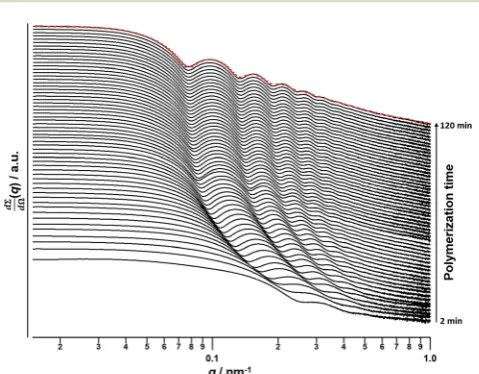
A synchrotron X-ray source was used to acquire SAXS patternsin situ during the PISA synthesis of PSMA31–PBzMA2000 diblock
copolymer spheres at 90C in mineral oil at 10% w/w solids. The sample cell was a 2 mm glass capillary and scattering patterns were recorded every 2 min for 120 min (Fig. 3). The onset of micellization occurs when the growing PBzMA chains become sufficiently long to induce nucleation.26,27This occurred
within around 2 min of the polymerization, as indicated by the
presence of a local minimum at q 0.23 nm1 (where q ¼
4psinq/l is the length of the scattering vector, l is the
wavelength of X-ray radiation andqis one-half of the scattering angle). The characteristic length scale corresponding to this feature is the mean core radius of the spherical diblock copol-ymer nanoparticles (Rs), which was observed to be 15 nm. Since
the PISA synthesis was conducted at 10% w/w solids, it was necessary to incorporate an appropriate structure factor81into
a well-known spherical micelle model77–79 in order to obtain
satisfactoryts to the SAXS patterns.
Monitoring this minimum as it shis to lower q (larger radii) as the BzMA polymerization proceeded provides useful information regarding the kinetics of nanoparticle growth. However, in order to t the SAXS data shown in Fig. 3 to a spherical micelle model,77–79theinstantaneous BzMA
conver-sion is required, since this in turn determines the mean DP and hence the molecular volume occupied by a single growing core-forming (PBzMA) block within the sphere is given by Vs ¼ (DPPBzMAMn,BzMA)/(NAr), where Mn,BzMA
corre-sponds to the molecular weight of the one BzMA unit within the PBzMA block andris the density of PBzMA. No further change in the SAXS patterns shown in Fig. 3 was taken to signify the end of the polymerization. Unfortunately, the BzMA polymerization was complete within 120 min during thein situ SAXS studies, whereas around 500 min was required for the same formulation in a typical laboratory-scale synthesis (20 mL reaction volume) conducted using an oil bath and stirrer hot plate. A possible reason for this signicant increase in polymerization rate could be additional radical species generated by the intense X-ray photon ux provided by the synchrotron source.82,83 The125 mL reaction volume of the
capillary used for the SAXS studies precludes sampling of the polymerizing reaction mixture. Instead, intermediate BzMA conversions were calculated by renormalizing the kinetic data set obtained for the laboratory-scale synthesis. More speci -cally, a sigmoid function was used to calculate intermediate BzMA conversions (see Fig. 4a and ESI†) since this best described the conversionvs.time curve.84The resulting BzMA
conversions were subsequently used to calculate the instan-taneous PBzMA DP during the PISA synthesis (see Fig. 4b, red data). It must be noted that due to the nature of the renorm-alization using the sigmoid function, the predicted kinetic data for thein situ SAXS measurements are a smooth repre-sentation of the somewhat scattered experimental data ob-tained under standard laboratory conditions.
As expected, the spherical core diameter of the growing nanoparticles (Ds) increases monotonically with polymerization
time (see Fig. 5a and Table 1). At the end of the BzMA poly-merization, at least six minima are visible in thenal scattering pattern (120 min, Fig. 3), indicating a relatively narrow size distribution for the resulting PSMA31–PBzMA2000spheres. Data tting for various SAXS patterns during the RAFT dispersion polymerization of PSMA31–PBzMA2000spheres indicated
essen-tially no solvent associated with the core-forming PBzMA block, which is consistent with the PSMA31–PBzMAxdata set shown in
Fig. 2. Moreover,1H NMR studies of the latter laboratory-scale syntheses (data not shown) conrmed that the volume fraction of solvent within the core domain (xsol) is essentially zero. Thus,
whentting SAXS patterns recorded during the polymerization,
Fig. 3 SAXS patterns obtainedin situ during the PISA synthesis of PSMA31–PBzMA2000diblock copolymer spheres at 90C in mineral oil at 10% w/w solids. Red dashes indicate the datafit to thefinal SAXS pattern recorded after 120 min using a spherical micelle model.77–79
Open Access Article. Published on 18 April 2016. Downloaded on 09/08/2016 12:36:24.
This article is licensed under a
[image:4.595.48.288.491.678.2]the mean number of copolymer chains per sphere (Ns) was
calculated based solely on the volume fraction of BzMA mono-mer within the core domain (4BzMA),RsandVsas shown below.
Ns¼ ð14BzMAÞ
4 3pRs
3
Vs (1)
Values for 4BzMA were estimated via centrifugation of
selected dispersions of PSMA31–PBzMAx spheres (obtained at
full BzMA conversionvialaboratory-scale syntheses) to which varying amounts of BzMA monomer and additional mineral oil had been added in order to replicate specic intermediate BzMA conversions during the synthesis of PSMA31–PBzMA2000
spheres in thein situSAXS studies. Firstly, the BzMA–swollen PSMA31–PBzMAxspheres were heated at 90C for 1 h and then
centrifuged at 13 000 rpm for 1 to 10 h at 20 C to ensure complete sedimentation of the spheres. Since centrifugation was not possible at 90C, it is assumed that the amount of BzMA monomer within the PBzMA cores is the same at 20C and 90C. Each supernatant was then analyzed for its BzMA
content against an internal standard (triethoxymethylsilane)via
1H NMR spectroscopy (see ESI†for further details). The
exper-imentally-determined values of 4BzMA at particular BzMA
conversions were thentted to a logarithmic decay function (R2
> 0.95), which was subsequently utilized to calculate 4BzMA
values for all entries in Table 1viainterpolation. Eqn (1) was then used to calculate the correspondingNsvalues. According
to the SAXSttings, the uncertainty inRsis small, hence the
error inNsis dominated by that associated withVs, which is in
turn dictated by the molecular weight distribution (MWD) of the growing core-forming PBzMA block. Given that the PSMA31
stabilizer block is relatively short, this MWD is approximately the same as that of the diblock copolymer. However, since thein situSAXS experiments were conducted on such a small scale, it was not feasible to determine the copolymer MWD at
interme-diate times during the polymerization. Therefore, the
maximum error inVsat any given time during the
polymeriza-tion was estimated from thenal MWD obtained for the labo-ratory-scale synthesis of the equivalent PSMA31–PBzMA2000
spheres. The unimodal MWD determined by THF GPC was
tted to a Gaussian model to determine its standard deviation (see ESI†), which was found to be approximately 9.5%. Since the
PISA synthesis conducted under in situ SAXS conditions
Fig. 5 (a) Evolution of the mean core diameter (Dco) and (b) mean aggregation number (Nagg, black data set) and number of copolymer chains per unit surface area (Sagg, red data set) during the PISA synthesis of PSMA31–PBzMA2000 diblock copolymer spheres, as judged byin situSAXS studies.
Fig. 4 (a) Conversion vs. time curve (blue squares) for the RAFT dispersion polymerization of BzMA in mineral oil at 90C when tar-geting PSMA31–PBzMA2000 block copolymer spheres at 10% w/w solids using T21s initiator under normal laboratory conditions and the renormalized conversionvs.time curve (red circles) calculated for the same PISA synthesis duringin situ SAXS studies. (b) Change in the PBzMA DP (red data) and the concentration of BzMA monomer ([BzMA], blue data) during thein situ SAXS studies when targeting PSMA31–PBzMA2000spheres.
Open Access Article. Published on 18 April 2016. Downloaded on 09/08/2016 12:36:24.
This article is licensed under a
[image:5.595.56.283.311.633.2] [image:5.595.309.549.349.669.2]proceeded much faster than standard laboratory conditions, it is possible that a broader MWD is observed for the copolymers synthesized in the former case. However, several recent reports of PISA syntheses conducted in non-polar solvents indicate that there is no correlation between copolymer MWD and thenal copolymer morphology – even highly polydisperse copolymer chains (Mw/Mn > 2.0) can self-assemble to give well-dened
nano-objects.85,86
Ns gradually increased with polymerization time, as
indi-cated in Fig. 5b (black data). This is not unexpected in view of recent observations made by both Joneset al.70and Zhang and
co-workers87for non-aqueous PISA formulations. Nevertheless,
it provides therst direct experimental evidence that the mean number of copolymer chains per nanoparticle increases during PISA syntheses. Likely mechanisms are either efficient fusion between monomer-swollen spheres and/or continuous aggre-gation of molecularly-dissolved copolymer chains.70The latter
seems more likely to occur during the early stages of the poly-merization (just aer nucleation), rather than in the latter stages. The average number of copolymer chains per unit surface area (Sagg) during the polymerization was calculated
using eqn (2) below.
Sagg¼ Ns
4pRs2
(2)
Interestingly,Sagg values (Fig. 5b, red data) decrease from
0.075 nm2to a limiting value of approximately 0.04 nm2aer around 40 min, suggesting an optimum surface packing density of copolymer chains within the sterically-stabilized PSMA31–
PBzMA2000spherical nanoparticles.70
The average distance between adjacent chains at the core– shell interface (dint) was calculated using eqn (3) below.76
dint¼
ffiffiffiffiffiffiffiffiffiffiffiffiffi
4pRs2 Ns s
¼
ffiffiffiffiffiffiffiffi
1
Sagg s
(3)
For small spheres (i.e.,Ds¼35.4 nm),dintwas calculated to
be 3.67 nm aer 8 min (or 5.0% BzMA conversion, which
corresponds to PSMA31–PBzMA99). This is comparable to that
reported by F¨orsteret al.76for similar-sized polystyrene–
poly(4-vinyl pyridine) block copolymer micelles, for which dint was
found to be 3.20 nm. Subsequently,dintincreased up to 5.04 nm
at full conversion (i.e., PSMA31–PBzMA2000; Ds ¼ 116.9 nm),
indicating that copolymer chains with longer core-forming PBzMA blocks occupy a larger surface area at the core–shell interface.
PSMA13–PBzMAxblock copolymer syntheses and corresponding phase diagram
Utilizing a shorter PSMA13 macro-CTA to target PBzMA
core-forming block DPs of 20 to 150 at various copolymer concen-trations enabled access to spherical, worm-like and vesicular morphologiesat relatively low copolymer concentrations($5% w/ w solids). In contrast, well-dened vesicular morphologies were only obtained at copolymer concentrations of at least 12.5% w/w solids for the PISA synthesis of PLMA–PBzMA diblock copol-ymer nanoparticles, whereas somewhat higher copolcopol-ymer concentrations ($17.5% w/w solids) were required to access a pure worm phase.28,57,58A detailed phase diagram was
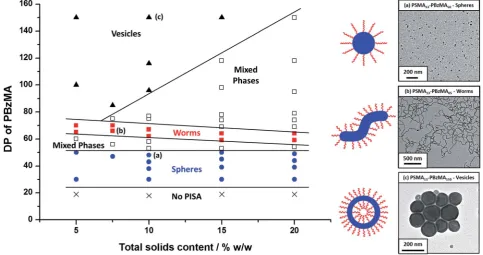
con-structed for the present PSMA13–PBzMAx formulation, with
diblock copolymer morphologies assignedvia post mortemTEM studies (see Fig. 6). Such phase diagrams are essential to ensure reproducible targeting of the desired copolymer morphology. Thus spheres were obtained at all copolymer concentrations investigated (5–20% w/w) when targeting PBzMA block DPs of
30 to 50. As reported for related PISA
formula-tions,26,28,34,45,46,57,58,62the worm phase space is relatively narrow
and is bounded by mixed phase regions. As expected, pure vesicles were obtained by targeting asymmetric PSMA13–
PBzMAxdiblock copolymers (i.e. x> 80). However, for PBzMA
[image:6.595.43.555.102.264.2]DPs of up to 150 this phase appears to be conned to copolymer concentrations of 5–15% w/w solids, with mixed phases being obtained at 20% w/w solids. It is perhaps worth emphasizing
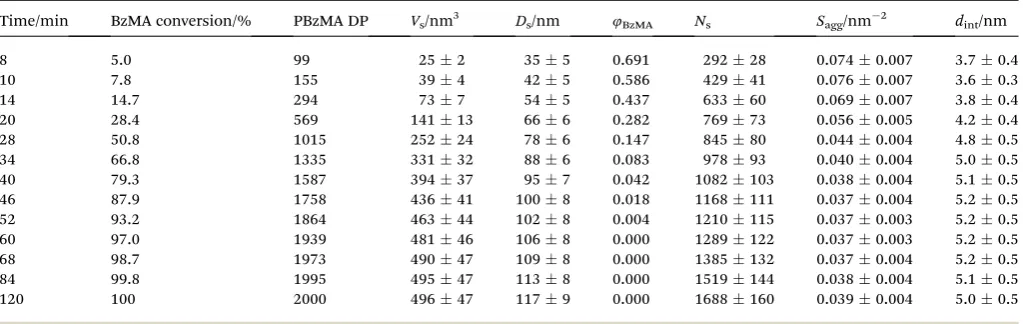
Table 1 Evolution of BzMA conversion, the mean degree of polymerization (DP) of the core-forming PBzMA block, the molecular volume occupied by a single PBzMA chain within the spherical core (Vs), the spherical core diameter (Ds¼2Rs), volume fraction of BzMA monomer within the core domain (4BzMA), mean aggregation number of a sphere (Ns), number of copolymer chains per unit surface area (Sagg) and mean distance between adjacent chains at the core–shell interface (dint) during the PISA synthesis of PSMA31–PBzMA2000diblock copolymer spheres. The standard deviation inDs(sDs¼2sRs) and the associated error inVs,Ns,Sagganddintare indicated
Time/min BzMA conversion/% PBzMA DP Vs/nm3 Ds/nm 4BzMA Ns Sagg/nm2 dint/nm
8 5.0 99 252 355 0.691 29228 0.0740.007 3.70.4
10 7.8 155 394 425 0.586 42941 0.0760.007 3.60.3
14 14.7 294 737 545 0.437 63360 0.0690.007 3.80.4
20 28.4 569 14113 666 0.282 76973 0.0560.005 4.20.4
28 50.8 1015 25224 786 0.147 84580 0.0440.004 4.80.5
34 66.8 1335 33132 886 0.083 97893 0.0400.004 5.00.5
40 79.3 1587 39437 957 0.042 1082103 0.0380.004 5.10.5
46 87.9 1758 43641 1008 0.018 1168111 0.0370.004 5.20.5
52 93.2 1864 46344 1028 0.004 1210115 0.0370.003 5.20.5
60 97.0 1939 48146 1068 0.000 1289122 0.0370.003 5.20.5
68 98.7 1973 49047 1098 0.000 1385132 0.0370.004 5.20.5
84 99.8 1995 49547 1138 0.000 1519144 0.0380.004 5.10.5
120 100 2000 49647 1179 0.000 1688160 0.0390.004 5.00.5
Open Access Article. Published on 18 April 2016. Downloaded on 09/08/2016 12:36:24.
This article is licensed under a
that the ability to prepare vesicles at copolymer concentrations as low as 5% w/w solids is an important advantage forin situ SAXS studies (see later). This is because lower copolymer concentrations minimize structural effects arising from inter-particle interactions.
Post mortemSAXS patterns recorded for 1.0% w/w disper-sions of eight PSMA13–PBzMAxdiblock copolymer nano-objects
(originally prepared at 10% w/w solids; see phase diagram in Fig. 6) are depicted in Fig. 7. Each of the three examples of spherical nanoparticles exhibit an approximate zero gradient at low q, as expected.88 Some deviations from zero gradient
observed at lowqvalues could be associated with an aggrega-tion of the spherical micelles. The local minimum observed for each scattering curve atqz0.5–0.7 nm1gradually shied to
lower q on increasing the mean PBzMA DP from 40 to 50,
indicating a progressive increase in the sphere dimensions. This is consistent with previously reported PISA syntheses conducted using axed stabilizer block DP, where increasing the core-forming block DP led to larger spherical nano-particles.33,57 According to theory, rigid rods should exhibit
a limiting gradient of1 at lowq.88However, TEM studies (see
Fig. 6b) suggest that these particular worms exhibit appreciable
exibility. Nevertheless, the SAXS patterns recorded for PSMA13–PBzMA65 and PSMA13–PBzMA70 worms in Fig. 7 do
indeed exhibit gradients of approximately1 at lowq. For these two copolymer dispersions, the local minimum observed atqz 0.5–0.6 nm1is associated with the mean worm width. Vesicular morphologies were also conrmed for PSMA13–PBzMA100–150,
since SAXS patterns indicated a slope of approximately2 at
low qfor these three dispersions. For such hollow spheres, there are two characteristic local minima. Firstly, the minimum observed atqz0.4–0.6 nm1is associated with the vesicle membrane thickness (Tm), which increases
mono-tonically as higher PBzMA DPs are targeted. Secondly, the local minimum observed atqz0.04–0.05 nm1is characteristic of the overall vesicle dimensions. Interestingly, this parameter remains relatively constant (1095 nm) for the series of three
Fig. 7 Post mortemSAXS patterns and datafits (dashed lines) for 1.0% w/w dispersions of PSMA13–PBzMAx(denoted as S13–Bx for brevity) diblock copolymer nanoparticles synthesized via RAFT dispersion polymerization of BzMA at 10% w/w solids in mineral oil. Purple dashed lines indicate zero,1 and2 gradients for guidance.
Fig. 6 Phase diagram constructed for PSMA13–PBzMAxdiblock copolymer nanoparticles prepared by RAFT dispersion polymerization of BzMA in mineral oil using a PSMA13macro-CTA and T21s initiator at 90C ([PSMA13]/[T21s] molar ratio¼5.0). Thepost mortemdiblock copolymer morphologies obtained at full conversion were assigned on the basis of TEM studies. TEM images (a), (b) and (c) correspond to typical examples of the three pure copolymer morphologies (spheres, worms and vesicles) respectively.
Open Access Article. Published on 18 April 2016. Downloaded on 09/08/2016 12:36:24.
This article is licensed under a
[image:7.595.55.539.52.307.2] [image:7.595.309.545.491.671.2]PSMA13–PBzMA100–150 vesicles prepared at 10% w/w solids
shown in Fig. 6.
In situSAXS studies of the PISA synthesis of PSMA13–
PBzMA150vesicles
A series ofin situSAXS patterns were also recorded when tar-geting PSMA13–PBzMA150vesicles at 10% w/w solids in mineral
oil. This core-forming block DP was chosen to guarantee access vesicle space (see Fig. 6) while maximizing the time scales for the existence of the intermediate sphere and worm phases. Inspecting Fig. 8, this strategy was clearly successful since the full range of copolymer morphologies is observed, from initially
soluble copolymer chains through to the nal vesicular
morphology via intermediate spherical and worm-like nano-particles.35 Again, the polymerization kinetics required
renormalization prior to detailed data analyses (see Fig. S4†). In this case, a signicantly longer polymerization time (and hence a somewhat higher BzMA conversion) is required for the onset of micellization. Inspecting Fig. 6, it is clear that the critical DP for the core-forming PBzMA block required to induce nucle-ation is around 30. This is because PSMA13–PBzMA20 diblock
copolymers do not self-assemble in mineral oil at 90 C, whereas PSMA13–PBzMA30 diblock copolymer spheres are
observed under these conditions. Thus approximately 20% BzMA conversion is required to triggerin situself-assembly for this particular PSMA13–PBzMA150PISA formulation. In contrast,
when targeting PSMA31–PBzMA2000diblock copolymer spheres
(Fig. 3), a BzMA conversion of only1.5% is required to achieve the same critical PBzMA DP for micellar nucleation. Spherical nanoparticles are formed just aer the onset of micellization, as conrmed by the approximately zero gradient at low q.88
However, just 10 min aer nucleation this lowqgradient tends towards1, indicating that the nascent spherical nanoparticles undergo multiple 1D fusion events leading to the formation of highly anisotropic worms. This second morphology is relatively short-lived (6 min), which is consistent with the narrow worm phase space observed in the phase diagram (Fig. 6). A mixed phase of worms and vesicles is apparent from 46 to 56 min. This corresponds to a PBzMA DP of 76 to 104 and is consistent with the mixed phase region observed in Fig. 6. Informed by thesein situstudies, multiple aliquots were taken from the same poly-merization conducted under standard laboratory conditions, with particular attention being paid to the above DP interval. TEM analyses conrmed that vesicles are formed from worms viaoctopi (see Fig. S7b†) and jellysh (see Fig. S5c and S5d†) intermediates. Such transient structures were also reported by Blanazs and co-workers35 for an aqueous PISA formulation
when targeting vesicles as thenal copolymer morphology. This provides therst experimental evidence of octopi and jellysh intermediates for a non-polar PISA formulation and suggests that the worm-to-vesicle morphology transitionviasuch struc-tures is likely to be universal for all vesicles preparedviaPISA syntheses. Finally, well-dened vesicles are present as a pure phase in the latter stages of the polymerization (58–120 min), as indicated by the slope of2 at lowq.
For this particularin situSAXS study (see Fig. 8), the exper-imental protocol used to renormalize the polymerization kinetics can be validated by comparing the PBzMA DP ranges within which pure spheres, worms and vesicles are observed to those indicated within the phase diagram shown in Fig. 6 (see Table 2). The generally good agreement between the upper and lower DPs at which each pure morphology is observed provides strong evidence that the analytical approach employed to renormalize the kinetic data is indeed valid. It is also worth emphasizing that the relatively well-dened phase boundaries shown in Fig. 6 enable a particularly robust comparison. SAXS patterns assigned to pure vesicles exhibit two local minima: one
[image:8.595.60.274.50.220.2]Fig. 8 In situ SAXS patterns recorded for the PISA synthesis of PSMA13–PBzMA150diblock copolymer vesicles prepared at 90C in mineral oil at 10% w/w solids. The onset of micellar nucleation is indicated by the red arrow.
Table 2 Comparison of the lower and upper limit PBzMA DPs for the three pure copolymer morphologies (spheres, worms and vesicles) determined by (i) inspecting the phase diagram constructed for PSMA13–PBzMAxdiblock copolymer nanoparticles prepared at 10% w/w solids (Fig. 6) and (ii)in situSAXS analysis of the synthesis of PSMA13–PBzMA150vesicles (Fig. 8)
Pure copolymer morphology
PBzMA DP indicated by phase diagram
PBzMA DP indicated byin situSAXS studies
Spheres Lower limit boundary 255 293
Spheres Upper limit boundary 511 484
Worms Lower limit boundary 601 595
Worms Upper limit boundary 701 706
Vesicles Lower limit boundary 932 1084
Open Access Article. Published on 18 April 2016. Downloaded on 09/08/2016 12:36:24.
This article is licensed under a
[image:8.595.45.555.636.723.2]is a rather subtle feature atqz 0.04–0.07 nm1representing the overall vesicle dimensions and the other is a more pronounced feature atqz0.3–0.7 nm1that is associated with the vesicle membrane thickness (Tm).67Fig. 9a shows selected
SAXS patterns taken from Fig. 8 over a much narrowerqrange in order to better illustrate the evolution in Tm at q z 0.3–0.7
nm1. A pure vesicle phase is observed aer 58 min, with subsequent datats indicating thatTmincreases monotonically
from 10.3 nm to 14.1 nm for PBzMA DPs ranging from 108 to 150 (see Fig. 9b, red data and Table 3). There is also an apparent increase in the outer core radius (Rout) with increasing PBzMA
DP (see Table 3) but this rather modest difference appears to be within the relatively large error associated with these data.
Precise knowledge of the dimensions of the growing vesicles is important, because in principle this enables the vesicle growth mechanism to be deduced. For example, Warrenet al.67
reported that the overall diameter of poly(glycerol mono-methacrylate)–poly(2-hydroxypropyl methacrylate) (PGMA– PHPMA) vesicles prepared viaRAFT aqueous dispersion poly-merization remained constant while Tm increased when
tar-geting higher PHPMA DPs. This indicates that the constrained vesicles grow inwards, with the thickening membrane leading to a reduction in the vesicle lumen volume. In order to elucidate
the growth mechanism for the PSMA13–PBzMAx vesicles
described in this work, much higher PBzMA DPs must be tar-geted. Consequently, PSMA13–PBzMAxvesicles with PBzMA DPs
up to 2000 (prepared at 10% w/w solids on a 5.0 mL scale) were subjected topost mortemanalysis using DLS, TEM and SAXS (see ESI†). DLS studies indicated that the overall vesicle diameter remained essentially constant (140–145 nm) for PBzMA DPs of between 100 and 400 (see Fig. 9c, blue data). For reference, the corresponding SAXS data reported in Table 3 for thein situSAXS studies are also shown in Fig. 9c. The apparent discrepancy between these two data sets simply reects the intensity-average and volume-average vesicle diameters reported by DLS and SAXS respectively. DLS diameters progressively increased for PBzMA DPs between 500 and 2000, while the corresponding size distributions signicantly broadened for PBzMA DPs above 900. These data suggest that the vesicles become unstable for PBzMA DPs greater than 400, as similarly reported by Warrenet al.for PGMA–PHPMA vesicles.67TEM studies (see Fig. S8a†) support
these DLS data: vesicles with narrow size distributions and approximately constant diameters were observed for PBzMA DPs up to 400. This indicates that theapparentmodest increase in overall vesicle dimensions observed in the in situ SAXS studies (see Table 3) is actually an artefact. Moreover, the vesicle membrane thickness increases with PBzMA DP over this range, which suggests a similar‘inward growth’ mechanism. Impor-tantly, there is excellent agreement between thein situandpost mortem Tmdata sets shown in Fig. 9b, which supports the
val-idity of our kinetics renormalization approach. Furthermore, large, ill-dened species are observed by TEM for PBzMA DPs above 500 (see vertical dashed line in Fig. 9c). This is consistent with observations made by Warrenet al.,67who reported loss of
the vesicular morphology for PHPMA DPs above 1000. In view of these observations, further post mortem SAXS studies were undertaken to monitor the evolution of the PSMA13–PBzMAx Fig. 9 (a)In situSAXS patterns showing the evolution of the vesicular
membrane thickness (Tm). (b) Relationship betweenTmand PBzMA DP as judged byin situSAXS when targeting PSMA13–PBzMA150vesicles (red squares) and post mortem SAXS studies of PSMA13–PBzMAx vesicles (blue circles). (c) Vesicle diameter as judged byin situSAXS when targeting PSMA13–PBzMAx vesicles (red squares) and post
mortemDLS studies of PSMA13–PBzMAxvesicles (blue data). (d)Tm increases monotonically when targeting higher PBzMA DPs while the overall vesicle diameter remains relatively constant, thus the lumen volume is gradually reduced during inward vesicle growth until vesicle
‘death’(or break-up) occurs.
Open Access Article. Published on 18 April 2016. Downloaded on 09/08/2016 12:36:24.
This article is licensed under a
[image:9.595.49.284.45.595.2]morphology (see red data set in Fig. 9c and also S8b†). It should be noted that these additional SAXS measurements were per-formed using an in-house NanoStar instrument, rather than a synchrotron X-ray source. Thus the accessibleqrange was only sufficient to allow the evolution in Tm to be monitored; no
information regarding the overall vesicle dimensions could be obtained.Tmincreased monotonically from 9 nm to 30 nm on
increasing the target PBzMA DP from 100 to 400. These data weretted to the power lawTm¼kxawherekis a constant andx
is the PBzMA DP. Theaexponent was calculated to be 0.86, which is consistent with that reported by Warrenet al.67forpost
mortemSAXS analysis of PGMA–PHPMA vesicles (a¼0.79). For PBzMA DPs above 400, theTmfeature at aroundq¼0.2 nm1to
0.6 nm1 becomes increasingly indistinct. This indicates the gradual loss of the vesicular morphology, which is consistent with the corresponding TEM studies. Since the DLS data indi-cate approximately the same overall vesicle dimensions for PBzMA DPs of 100–400, this indicates that the‘inward growth’ mechanism is valid for both aqueous and non-polar media (see Fig. 9d). This is important, because it implies agenericvesicle growth mechanism for all PISA formulations. This is perfectly reasonable, because Warren et al. showed that this hitherto unrecognized mechanism is theonlymeans by which the vesi-cles can lower their total surface area, and hence reduce their overall free energy.67
In the case of vesicles, different equations are required for the calculation of mean aggregation number per vesicle (Nv),
Sagganddint, as indicated below (see eqn (4)–(6)). By denition,
the volume fraction of BzMAmonomerwithin the core domain (4BzMA) at full conversion must be zero. Moreover, the SAXS data ts suggest that the volume fraction ofsolventwithin the PBzMA chains forming the vesicle membrane (xsol) is close to zero. In
this case, Nv for the nal PSMA13–PBzMA150 vesicles can be
calculated using eqn (4) below.
Nv¼
4 3p
Rout3Rin3
Vm (4)
As for the earlierin situSAXS studies conducted when tar-geting PSMA31–PBzMA2000 spheres, the leading error in the
calculation ofNvis the MWD of the core-forming PBzMA block,
which dictates the error inVm. From the GPC data obtained for
PSMA13–PBzMA150vesicles prepared on a laboratory scale, the
standard deviation inVmwas estimated to be 3.4% using the
same method used for the spheres (see ESI†).Sagganddintfor
the PSMA13–PBzMA150 vesicles are subsequently calculated
using eqn (5) and (6), respectively.
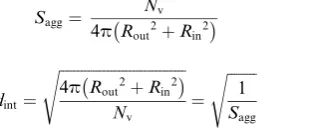
Sagg¼ Nv
4pRout2þRin2
(5)
dint¼
ffiffiffiffiffiffiffiffiffiffiffiffiffiffiffiffiffiffiffiffiffiffiffiffiffiffiffiffiffiffiffiffiffiffi
4pRout2þRin2
Nv s
¼
ffiffiffiffiffiffiffiffi
1
Sagg s
(6)
TheNvvalue calculated for PSMA13–PBzMA150vesicles at full
conversion was 12 700 400, with the corresponding Sagg
determined to be 0.1870.006 nm2and the average distance between adjacent copolymer chains at the core–shell interface (dint) was 2.310.08 nm. These data somewhat differ to those
calculated for related aqueous67and alcoholic48PISA
formula-tions, wheredintis (retrospectively) calculated to be 3.1–3.4 nm.
However, the solvent volume fraction within the vesicle membrane was found to be more than 0.35 in these earlier literature examples compared to essentially zero in the present work. This indicates that the copolymer chains are more densely packed in the current non-polar PISA formulation. Notably, the value of dint calculated for these vesicles is
comparable to that determined for densely-packed poly-butadiene–poly(L-lysine) block copolymer chains within vesicle
membranes formed in saline solution (dint ¼ 2.4 nm at pH
10.3).89TheS
agganddintvalues calculated for PSMA13–PBzMA150
vesicles can also be compared to those for PSMA31–PBzMA2000
spheres (Sagg¼0.0390.004 nm2,dint¼5.040.48 nm). It is
evident that the copolymer chains are packed more densely within the PSMA13–PBzMA150vesicles compared to the PSMA31–
PBzMA2000spheres. This is likely to be the result of the differing
[image:10.595.42.555.92.213.2]interfacial curvatures associated with each copolymer
Table 3 Evolution of the BzMA conversion, mean degree of polymerization (DP) for the core-forming PBzMA block, molecular volume of a single PBzMA core-forming block within the membrane (Vm), outer core radius (Rout), membrane thickness (Tm) and inner core radius (Rin¼RoutTm) during the PISA synthesis of PSMA13–PBzMA150diblock copolymer vesicles. The associated error inVmis indicated and the standard deviation is shown where relevant (sRout,sTm,sRin)
Time/min BzMA conversion/% PBzMA DP Vm/nm3 Rout/nm Tm/nm Rin/nm
58 72.3 108 270.9 5318 101.6 4318
60 75.4 113 281.0 5619 111.6 4519
62 78.2 117 291.0 5619 111.6 4519
64 80.7 122 301.0 5619 121.6 4419
68 85.2 128 321.1 5720 121.8 4520
72 88.9 134 331.1 5720 131.8 4420
76 91.8 138 341.2 5719 131.9 4419
88 97.1 146 361.2 5720 142.0 4420
120 100 150 371.3 5920 142.2 4521
Open Access Article. Published on 18 April 2016. Downloaded on 09/08/2016 12:36:24.
This article is licensed under a
[image:10.595.365.524.367.432.2]morphology, but the signicant difference in target DP for the core-forming PBzMA blocks may also be a factor.
Conclusions
In summary, a range of sterically-stabilized PSMA–PBzMA diblock copolymer nano-objects have been preparedviaRAFT dispersion polymerization in mineral oil. Improved control over the copolymer molecular weight distribution is achieved compared to previously reported PISA syntheses conducted in non-polar media, with relatively narrow molecular weight distributions (Mw/Mn # 1.30) being achieved even when
tar-geting PBzMA DPs of up to 500. As expected, only spherical nanoparticles were obtained when using relatively long PSMA18
or PSMA31macro-CTAs. In both cases, a log–log plot indicated
a linear correlation between the mean sphere diameter (as
judged by DLS) and the core-forming PBzMA DP. PSMA31–
PBzMAxspheres indicated a scaling exponent of 0.50,
suggest-ing essentially non-solvated PBzMA chains within the core-forming PBzMA block, whereas a scaling exponent of 0.61 was obtained for PSMA18–PBzMAx spheres, suggesting a nite
degree of solvation for the PBzMA chains in this case. In contrast, using a relatively short PSMA13macro-CTA allows the
synthesis of spherical, worm-like or vesicular morphologies. Construction of a detailed phase diagram for PSMA13–PBzMAx
diblock copolymers conrmed that pure spheres, worms or vesicles could be obtained at relatively low solids concentra-tions. This is important, because it facilitates in situ SAXS studies of the formation of PSMA31–PBzMA2000 spheres and
PSMA13–PBzMA150 nano-objects at 10% w/w solids. However,
the rate of BzMA polymerization during such scattering exper-iments is signicantly faster than that observed under normal laboratory conditions. Thus the latter kinetic data sets require renormalization to enable detailed analysis of thein situSAXS data. When targeting PSMA31–PBzMA2000spheres, a systematic
increase in core diameter (Ds) and mean aggregation number
(Ns) are clearly discernible during the BzMA polymerization,
with the nal scattering pattern indicating the formation of near-monodisperse PSMA31–PBzMA2000 spheres. Interestingly,
the number of copolymer chains per unit surface area (Sagg)
decreased rapidly during the initial stages of the polymerization until a limiting value of0.038 nm2is attained. This indicated that the mean distance between copolymer chains at the core– shell interface (dint) at full conversion was approximately 5.0
nm. When targeting PSMA13–PBzMA150vesicles, characteristic
scattering patterns for the dissolved copolymer chains, inter-mediate spheres and worms, and thenal vesicle morphology were obtained. Importantly, revisiting the phase diagram con-structed for this formulation enabled validation of the renormalization protocol adopted for analysis of the kinetic data. More specically, the mean PBzMA DPs corresponding to the various phase boundaries were in relatively good agreement with the upper and lower DPs assigned to the corresponding pure phases indicated by analysis of thein situSAXS patterns. Within the mixed phase space, it was shown that vesicles are formed from worms viaoctopi and jellysh intermediates as
rst reported for an aqueous PISA formulation. Combined DLS,
TEM and SAXS studies indicate that the overall vesicle dimen-sions remain relatively constant as the vesicle membrane gradually thickens with increasing PBzMA DP until so-called vesicle‘death’(or break-up) occurs. These observations indicate an ‘inward growth’ mechanism, as recently reported for an aqueous PISA formulation. This suggests that agenericvesicle growth mechanism is most likely applicable for PISA syntheses.
Acknowledgements
We are grateful to Diamond Light Source for providing synchrotron beam time and thank the personnel of I22 for their assistance. Lubrizol Corporation Ltd is thanked for funding a PhD studentship for MJD. EPSRC is thanked for a Platform grant (EP/J007846/1) to support LAF, OOM, NJW and SPA also acknowledges an ERC Advanced Investigator grant (PISA 320372) to support both himself and CJM.
Notes and references
1 S. Krause,J. Phys. Chem., 1964,68, 1948–1955.
2 Z. Tuzar and P. Kratochvil,Adv. Colloid Interface Sci., 1976,6, 201–232.
3 R. K. O'Reilly, C. J. Hawker and K. L. Wooley,Chem. Soc. Rev., 2006,35, 1068–1083.
4 M. Antonietti and S. F¨orster, Adv. Mater., 2003, 15, 1323– 1333.
5 L. J. M. Vagberg, K. A. Cogan and A. P. Gast,Macromolecules, 1991,24, 1670–1677.
6 L. F. Zhang and A. Eisenberg,Science, 1995,268, 1728–1731. 7 G. Mountrichas, M. Mpiri and S. Pispas, Macromolecules,
2005,38, 940–947.
8 S. Y. Choi, F. S. Bates and T. P. Lodge,J. Phys. Chem. B, 2009,
113, 13840–13848.
9 J. Tao, S. Stewart, G. J. Liu and M. L. Yang,Macromolecules, 1997,30, 2738–2745.
10 G. J. Liu, J. F. Ding, L. J. Qiao, A. Guo, B. P. Dymov, J. T. Gleeson, T. Hashimoto and K. Saijo, Chem.–Eur. J., 1999,5, 2740–2749.
11 N. Ouarti, P. Viville, R. Lazzaroni, E. Minatti,
M. Schappacher, A. Deffieux and R. Borsali, Langmuir, 2005,21, 1180–1186.
12 M. Lazzari, D. Scalarone, C. Vazquez-Vazquez and
M. A. Lopez-Quintela,Macromol. Rapid Commun., 2008,29, 352–357.
13 J. B. Gilroy, T. Gadt, G. R. Whittell, L. Chabanne, J. M. Mitchels, R. M. Richardson, M. A. Winnik and I. Manners,Nat. Chem., 2010,2, 566–570.
14 J. A. Massey, K. Temple, L. Cao, Y. Rharbi, J. Raez, M. A. Winnik and I. Manners,J. Am. Chem. Soc., 2000,122, 11577–11584.
15 X. Wang, G. Guerin, H. Wang, Y. Wang, I. Manners and M. A. Winnik,Science, 2007,317, 644–647.
16 T. Gaedt, N. S. Ieong, G. Cambridge, M. A. Winnik and I. Manners,Nat. Mater., 2009,8, 144–150.
17 R. Zheng, G. Liu, M. Devlin, K. Hux and T.-C. Jao,Tribol. Trans., 2009,53, 97–107.
Open Access Article. Published on 18 April 2016. Downloaded on 09/08/2016 12:36:24.
This article is licensed under a
18 D. J. Growney, O. O. Mykhaylyk and S. P. Armes,Langmuir, 2014,30, 6047–6056.
19 D. J. Growney, O. O. Mykhaylyk, L. Middlemiss,
L. A. Fielding, M. J. Derry, N. Aragrag, G. D. Lamb and S. P. Armes,Langmuir, 2015,31, 10358–10369.
20 J. Chiefari, Y. K. Chong, F. Ercole, J. Krstina, J. Jeffery, T. P. T. Le, R. T. A. Mayadunne, G. F. Meijs, C. L. Moad, G. Moad, E. Rizzardo and S. H. Thang, Macromolecules, 1998,31, 5559–5562.
21 G. Moad, E. Rizzardo and S. H. Thang,Aust. J. Chem., 2005,
58, 379–410.
22 G. Moad, E. Rizzardo and S. H. Thang,Acc. Chem. Res., 2008,
41, 1133–1142.
23 B. Charleux, G. Delaittre, J. Rieger and F. D'Agosto, Macromolecules, 2012,45, 6753–6765.
24 M. J. Monteiro and M. F. Cunningham, Macromolecules, 2012,45, 4939–4957.
25 J.-T. Sun, C.-Y. Hong and C.-Y. Pan,Polym. Chem., 2013,4, 873–881.
26 N. J. Warren and S. P. Armes,J. Am. Chem. Soc., 2014,136, 10174–10185.
27 M. J. Derry, L. A. Fielding and S. P. Armes,Prog. Polym. Sci., 2016,52, 1–18.
28 M. J. Derry, L. A. Fielding and S. P. Armes, Polym. Chem., 2015,6, 3054–3062.
29 Z. An, Q. Shi, W. Tang, C.-K. Tsung, C. J. Hawker and G. D. Stucky,J. Am. Chem. Soc., 2007,129, 14493–14499. 30 A. Blanazs, S. P. Armes and A. J. Ryan, Macromol. Rapid
Commun., 2009,30, 267–277.
31 J. Rieger, C. Grazon, B. Charleux, D. Alaimo and C. J´erˆome,J. Polym. Sci., Part A: Polym. Chem., 2009,47, 2373–2390. 32 S. Boisse, J. Rieger, K. Belal, A. Di-Cicco, P. Beaunier,
M.-H. Li and B. Charleux,Chem. Commun., 2010,46, 1950– 1952.
33 Y. Li and S. P. Armes,Angew. Chem., Int. Ed., 2010,49, 4042– 4046.
34 S. Sugihara, A. Blanazs, S. P. Armes, A. J. Ryan and A. L. Lewis,J. Am. Chem. Soc., 2011,133, 15707–15713. 35 A. Blanazs, J. Madsen, G. Battaglia, A. J. Ryan and
S. P. Armes,J. Am. Chem. Soc., 2011,133, 16581–16587. 36 G. Liu, Q. Qiu, W. Shen and Z. An,Macromolecules, 2011,44,
5237–5245.
37 A. Blanazs, A. J. Ryan and S. P. Armes,Macromolecules, 2012,
45, 5099–5107.
38 N. J. Warren, O. O. Mykhaylyk, D. Mahmood, A. J. Ryan and S. P. Armes,J. Am. Chem. Soc., 2014,136, 1023–1033. 39 C. A. Figg, A. Simula, K. A. Gebre, B. S. Tucker,
D. M. Haddleton and B. S. Sumerlin, Chem. Sci., 2015,6, 1230–1236.
40 J. Tan, H. Sun, M. Yu, B. S. Sumerlin and L. Zhang, ACS Macro Lett., 2015,4, 1249–1253.
41 W.-M. Wan and C.-Y. Pan,Polym. Chem., 2010,1, 1475–1484.
42 W.-M. Wan, X.-L. Sun and C.-Y. Pan, Macromol. Rapid
Commun., 2010,31, 399–404.
43 W. Cai, W. Wan, C. Hong, C. Huang and C. Pan,SoMatter, 2010,6, 5554–5561.
44 C.-Q. Huang and C.-Y. Pan,Polymer, 2010,51, 5115–5121.
45 E. R. Jones, M. Semsarilar, A. Blanazs and S. P. Armes, Macromolecules, 2012,45, 5091–5098.
46 M. Semsarilar, E. R. Jones, A. Blanazs and S. P. Armes,Adv. Mater., 2012,24, 3378–3382.
47 M. Semsarilar, E. R. Jones and S. P. Armes,Polym. Chem., 2014,5, 195–203.
48 C. Gonzato, M. Semsarilar, E. R. Jones, F. Li,
G. J. P. Krooshof, P. Wyman, O. O. Mykhaylyk, R. Tuinier and S. P. Armes,J. Am. Chem. Soc., 2014,136, 11100–11106. 49 Y. Pei and A. B. Lowe,Polym. Chem., 2014,5, 2342–2351. 50 Y. W. Pei, N. C. Dharsana, J. A. Van Hensbergen,
R. P. Burford, P. J. Roth and A. B. Lowe,SoMatter, 2014,
10, 5787–5796.
51 B. Karagoz, C. Boyer and T. P. Davis, Macromol. Rapid Commun., 2014,35, 417–421.
52 B. Karagoz, L. Esser, H. T. Duong, J. S. Basuki, C. Boyer and T. P. Davis,Polym. Chem., 2014,5, 350–355.
53 S. Dong, W. Zhao, F. P. Lucien, S. Perrier and
P. B. Zetterlund,Polym. Chem., 2015,6, 2249–2254.
54 L. Houillot, C. Bui, M. Save, B. Charleux, C. Farcet, C. Moire, J.-A. Raust and I. Rodriguez,Macromolecules, 2007,40, 6500– 6509.
55 L. Houillot, C. Bui, C. Farcet, C. Moire, J.-A. Raust, H. Pasch, M. Save and B. Charleux,ACS Appl. Mater. Interfaces, 2010,2, 434–442.
56 J. A. Raust, L. Houillot, M. Save, B. Charleux, C. Moire, C. Farcet and H. Pasch, Macromolecules, 2010, 43, 8755– 8765.
57 L. A. Fielding, M. J. Derry, V. Ladmiral, J. Rosselgong, A. M. Rodrigues, L. P. D. Ratcliffe, S. Sugihara and S. P. Armes,Chem. Sci., 2013,4, 2081–2087.
58 L. A. Fielding, J. A. Lane, M. J. Derry, O. O. Mykhaylyk and S. P. Armes,J. Am. Chem. Soc., 2014,136, 5790–5798. 59 Y. Pei, L. Thurairajah, O. R. Sugita and A. B. Lowe,
Macromolecules, 2015,48, 236–244.
60 Y. Pei, J.-M. Noy, P. J. Roth and A. B. Lowe,J. Polym. Sci., Part A: Polym. Chem., 2015,53, 2326–2335.
61 Y. Pei, O. R. Sugita, L. Thurairajah and A. B. Lowe,RSC Adv., 2015,5, 17636–17646.
62 A. P. Lopez-Oliva, N. J. Warren, A. Rajkumar,
O. O. Mykhaylyk, M. J. Derry, K. E. B. Doncom, M. J. Rymaruk and S. P. Armes, Macromolecules, 2015,48, 3547–3555.
63 A. Blanazs, R. Verber, O. O. Mykhaylyk, A. J. Ryan, J. Z. Heath, C. W. I. Douglas and S. P. Armes,J. Am. Chem. Soc., 2012,134, 9741–9748.
64 V. J. Cunningham, L. P. D. Ratcliffe, A. Blanazs, N. J. Warren, A. J. Smith, O. O. Mykhaylyk and S. P. Armes,Polym. Chem., 2014,5, 6307–6317.
65 M. K. Kocik, O. O. Mykhaylyk and S. P. Armes,SoMatter, 2014,10, 3984–3992.
66 C. J. Mable, N. J. Warren, K. L. Thompson, O. O. Mykhaylyk and S. P. Armes,Chem. Sci., 2015,6, 6179–6188.
67 N. J. Warren, O. O. Mykhaylyk, A. J. Ryan, M. Williams, T. Doussineau, P. Dugourd, R. Antoine, G. Portale and S. P. Armes,J. Am. Chem. Soc., 2015,137, 1929–1937.
Open Access Article. Published on 18 April 2016. Downloaded on 09/08/2016 12:36:24.
This article is licensed under a
68 Y. Kang, A. Pitto-Barry, H. Willcock, W. D. Quan, N. Kirby, A. M. Sanchez and R. K. O'Reilly, Polym. Chem., 2015, 6, 106–117.
69 X. W. Zhang, S. Boisse, C. Bui, P. A. Albouy, A. Brulet, M. H. Li, J. Rieger and B. Charleux, So Matter, 2012, 8, 1130–1141.
70 E. R. Jones, O. O. Mykhaylyk, M. Semsarilar, M. Boerakker, P. Wyman and S. P. Armes,Macromolecules, 2016,49, 172– 181.
71 J. Jennings, M. Beija, A. P. Richez, S. D. Cooper, P. E. Mignot, K. J. Thurecht, K. S. Jack and S. M. Howdle,J. Am. Chem. Soc., 2012,134, 4772–4781.
72 D. Hermida-Merino, G. Portale, P. Fields, R. Wilson, S. P. Bassett, J. Jennings, M. Dellar, C. Gommes, S. M. Howdle, B. C. M. Vrolijk and W. Bras, Rev. Sci. Instrum., 2014,85, 093905.
73 P. Cacioli, D. G. Hawthorne, R. L. Laslett, E. Rizzardo and D. H. Solomon,J. Macromol. Sci., Chem., 1986,23, 839–852. 74 M. Rodlert, E. Harth, I. Rees and C. J. Hawker,J. Polym. Sci.,
Part A: Polym. Chem., 2000,38, 4749–4763.
75 F. S. Bates and G. H. Fredrickson,Annu. Rev. Phys. Chem., 1990,41, 525–557.
76 S. Fo¨orster, M. Zisenis, E. Wenz and M. Antonietti,J. Chem. Phys., 1996,104, 9956–9970.
77 J. S. Pedersen and M. C. Gerstenberg,Macromolecules, 1996,
29, 1363–1365.
78 J. S. Pedersen and P. Schurtenberger,Macromolecules, 1996,
29, 7602–7612.
79 J. S. Pedersen,J. Appl. Crystallogr., 2000,33, 637–640. 80 G. Battaglia and A. J. Ryan, J. Am. Chem. Soc., 2005, 127,
8757–8764.
81 J. S. Pedersen,J. Chem. Phys., 2001,114, 2839–2846. 82 S. J. Tseng, C.-C. Chien, Z.-X. Liao, H.-H. Chen, Y.-D. Kang,
C.-L. Wang, Y. Hwu and G. Margaritondo, So Matter,
2012,8, 1420–1427.
83 M. H. Qiao, F. Q. Yan, W. S. Sim, J. F. Deng and G. Q. Xu,Surf. Sci., 2000,460, 67–73.
84 M. A. Winnik, R. Lukas, W. F. Chen, P. Furlong and M. D. Croucher,Makromol. Chem., Macromol. Symp., 1987,
10–11, 483–501.
85 V. J. Cunningham, S. P. Armes and O. M. Musa, Polym.
Chem., 2016,7, 1882–1891.
86 L. P. D. Ratcliffe, B. E. McKenzie, G. M. D. Le Bou¨edec,
C. N. Williams, S. L. Brown and S. P. Armes,
Macromolecules, 2015,48, 8594–8607.
87 Y. Su, X. Xiao, S. Li, M. Dan, X. Wang and W. Zhang,Polym. Chem., 2014,5, 578–587.
88 O. Glatter and O. Kratky, Small-angle X-ray Scattering, Academic Press, London, 1982.
89 R. Sigel, M.Łosik and H. Schlaad,Langmuir, 2007,23, 7196– 7199.
Open Access Article. Published on 18 April 2016. Downloaded on 09/08/2016 12:36:24.
This article is licensed under a