Agglomeration in counter-current spray drying towers. Part A:
Particle growth and the effect of nozzle height
Víctor Francia
a,b,⁎
, Luis Martín
b, Andrew E. Bayly
b,1, Mark J.H. Simmons
a aSchool of Chemical Engineering, University of Birmingham, Birmingham B15 2TT, United Kingdom bProcter & Gamble, R&D, Newcastle Innovation Centre, Newcastle upon Tyne, United Kingdom
a b s t r a c t
a r t i c l e i n f o
Article history:
Received 20 November 2015 Received in revised form 6 May 2016 Accepted 7 May 2016
Available online 10 May 2016
Agglomeration of particles and droplets is critical to the operation of spray dryers, however it remains relatively unexplored. This paper studies the effect of the nozzle height on product properties, wall deposits and dryer con-ditions in a counter-current spray drying tower of detergent with a swirling airflow. The process efficiency is driven by changes in particle agglomeration. To interpret the results and facilitate the study of swirl towers, it is useful to subdivide these units according to the sources of growth in (a) spray region(s), (b) concentrated near-wall region(s) and (c) wall deposits. The particles formed are very heterogeneous and show a size-dependent composition. In this case, particle properties are driven by the separation of solid and liquid phases during atomization and the formation of a heterogeneous set of droplets. Agglomeration serves to homogenise the product and create a distinct source of porosity. The capacity and energy consumption of the dryer are also determined by the evolution of the particle size, asfine powder is elutriated from the tower top and coarse par-ticles are removed from the product. When the nozzle is moved to lower positions in the tower the increased temperature near the spray suppresses agglomeration, however the residence time is shortened and ultimately it leads to creation of wet, coarse granules. An optimum location is found high enough to maintain the drying ef-ficiency but sufficiently far from the top exit to minimise the loss offine particles. In this way, a capacity ratio (i.e. product vs spray dried powder)CN90% can be obtained and energy efficiency maximised.
© 2016 The Authors. Published by Elsevier B.V. This is an open access article under the CC BY license (http://creativecommons.org/licenses/by/4.0/). Keywords:
Spray dryer Particle growth Agglomeration Atomization Phase separation Detergent
1. Introduction
Spray dryers are used to produce powders from the atomization of liquid feeds in dry hot air, where the volatile phases are removed. When droplets or particles come into contact they may stick to each other or the walls of the dryer and form agglomerates and deposits. These are rather poorly understood phenomena. Models often need to ignore the effect of particle contacts and concern only with a set of drop-lets as it is injected by a spray. However, agglomerates become bigger, lighter and non-spherical and disperse and dry in a very different way, which affects the dryer efficiency and the quality of the product. Under-standing how and where agglomeration occurs is a challenge for many spray drying technologies[1,2]and the main pitfall of theoretical models[3–5]versus empirical approaches or the use of neural networks to try reproducing the complex net of relations between process condi-tions, drying rates[6]and deposition[7].
Formulating a theoretical model of agglomeration is complex because it needs to cover the entire particle history from atomization and coales-cence[8,9]to the changes in the droplet surface[10–12]. Computational fluid dynamic models are very common to describe how the solids disperse and compute heat and mass transfer rates [13–16]. The particle-wall collisions are tracked to study deposition[17,18,19]and stochastic models are used to deal with impacts occurring in the air [20,21]and render thefirst descriptions of agglomeration in co-current devices[22–24]. The outcome of particle/droplet contacts was initially linked to the Ohnesorge numberOh2(i.e. ratio of surface to viscous forces) in way to describe how a particle becomes less“sticky”as it dries[18,22,25]. But, in reality, the forces involved and the energy dissi-pated in an impact are complex functions of morphology. Recent work provides a neater account of the contact mechanics[26,27]and experi-mental collision charts[28], but it is yet to be applied in large frames.
Pilot or full scale experimentation is less frequent. Only few authors have related agglomeration to the operation conditions in co-current dyers or properties such as the glass transition temperature[29,30]in a way to delimit the areas where the particles grow[31,32]. No similar work is available for counter-current units or under the use of swirl. Swirl towers are typical of the production of thermally stable powders (e.g. detergents, ceramics) and in general, exhibit a higher level of ⁎ Corresponding author at: School of Chemical Engineering, University of Birmingham,
Birmingham B15 2TT, United Kingdom.
E-mail address:[email protected](V. Francia). 1
Present address: School Chemical and Process Engineering, University of Leeds, Leeds, UK.
http://dx.doi.org/10.1016/j.powtec.2016.05.011
0032-5910/© 2016 The Authors. Published by Elsevier B.V. This is an open access article under the CC BY license (http://creativecommons.org/licenses/by/4.0/). Contents lists available atScienceDirect
Powder Technology
agglomeration and wall deposition[33]. The counter-currentflow leads to better energy efficiency but it makes the powder stagnate, which mul-tiplies particle-particle contacts[5]particularly close to the walls where the swirl concentrates the solid phase[33]. Theflow patterns are more complex and as a result the few models available[34,35]struggle to deal with accumulation, swirl stability[36]or fouling, and rarely mention the particle contacts[37]. Experimental works are scare[38–40]and numerical tools rarely validated. The limited amount of data is due to known difficulties[41]: (a) costs and restricted access to production (b) complexity of gathering reliable and comprehensive data in full scale e.g.N100−1000m3, (c) multiple designs, (d) difficulty of sampling or installing probes inside a dryer, and so (e) difficulty in studying drying kinetics, agglomeration or fouling independently.
Every past attempt to study agglomeration during spray drying has looked into the contacts that occur in the air and associated the impacts to the walls only to the presence of deposits or some operational issues [42–44]. Recent work has made it imperative to reconsider this view and look at the wall deposition/resuspension dynamic as a key phenom-enon. Clusters are seen to form, roll and break up at the walls of swirl counter-current towers of detergent[33]and tracer studies have dem-onstrated that the outer layers of the deposits are in fact continuously growing and breaking in an equilibrium that forms most of the coarse granules and drastically increases the residence time[45].
In summary, agglomeration during spray drying is not well under-stood, particularly in counter-current swirlingflows where the role of the walls must be recognised. Huntington[5]listed some of the implica-tions of particle growth during detergent manufacture. Swirl towers tend to maximise production whilst maintaining quality thresholds for the size and density of the spray dried product. As the rate increases, particles come into contact more frequently and the product becomes too coarse and wet. An appropriate number and location of sprays can minimise the number of particle contacts[5]but optimization is not possible without the ability to predict and control the agglomeration. In order to upgrade designs, reduce recirculation and better energy effi -ciency it is vital to understand where the most relevant contacts occur in a dryer and generate data to correlate the growth patterns to the confi g-uration of sprays. To this purpose, two independent investigations have been carried out: (a) Part A, given here, provides a comprehensive ex-amination of detergent production: it compartmentalises a swirl drying tower revisiting the list of particle contacts proposed by Huntington[5] in light of the new insights, and reports a series of experiments that link the position of a spray to the performance of the dryer in terms of capac-ity, efficiency and product quality, and (b) Part B is reported separately [46]and quantifies the interactions established when multiple spraying levels are used.
2. Experimental methods, tower subdivision and operation
2.1. Unit design
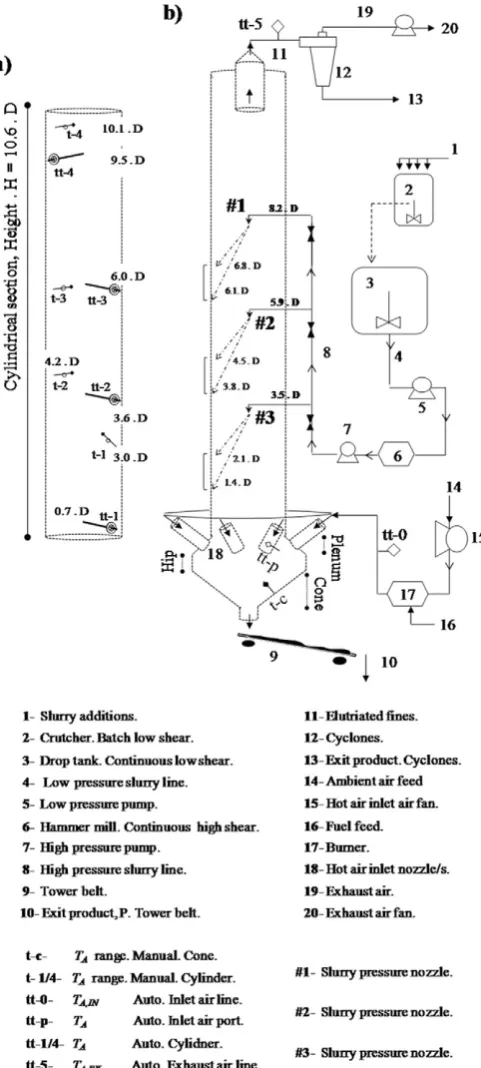
A full scale counter-current swirl tower, property of Procter & Gam-ble was used to conduct the experiments.Table 1andFig. 1describe the unit design and location of the nozzles used to atomize the slurry feed. A typical detergent formulation was used, containing aqueous and organ-ic liquid phases obtained by addition of surfactant(s), polymer(s) and inorganic salt(s) to a solid content between 30 and 60% in mass. This slurry is prepared in a batch mixer, denoted‘2’inFig. 1, and fed to a ho-mogenizer‘3’for a continuous operation. It is pumped at low pressure ‘5’into a hammer mill‘6’to break lumps and avoid blockages thereafter
and then it is brought to high pressure in‘8’and delivered to a swirl pressure nozzle inside the unit. The same nozzle is used at all levels; it is placed at the centre of the chamber and faces down. Swirl pressure nozzles comprise of a swirl chamber where the feed is injected at high pressure followed by a tip with an outlet orifice; the swirling motion forms a thin slurry sheet at the outlet that breaks up as theflow exits at-omizing the slurry into a hollow spray.Fig. 1depicts the thickness of the hollow cone and its projection onto the walls. The reader is referred to Huntington[5]for a more detailed description.
Table 1
Tower design parameters.
d/D H/D ⁎Ωi
0.29 10.58 5.1–5.4
[image:2.595.316.557.52.587.2]⁎ Ωiinitial swirl intensity[47].
Hot air is injected at the bottom of the chamber into the conical sec-tion, rises in the cylinder and exits from the top duct into a series of cy-clones where the elutriated powder is collected. The alignment of the inlet air ports generates the swirling motion in the chamber, characterised by a strong anisotropy and periodical structures[47]. The majority of the product exits via the bottom of the tower and enters a transporting belt, after which the coarsest fractions are separated.
2.2. Measurement and instrumentation
The paste rheology was characterised with a cup and bob rheometer (TA Instruments ltd. AR2000 ex) and the droplet size was examined with laser diffraction methods (Malvern Spraytec Particle Sizer, RTSizer 5.6) in an external rig that reproduces the atomization conditions set up in the dryer (i.e. temperature, pressure, rate, nozzle, slurry). Average droplet size distributions were obtained using several sprays from 1-2sin duration and the spray angle was computed with image analysis.
Elutriation rates were measured by collecting the powder exiting the cyclones, denoted‘13’inFig. 1, and its size was analysed with laser dif-fraction (Sympatec GmbH HELOS/BR–Rodox, Lenses R2, R4 R7). Prod-uct was sampled at the exit of the belt‘10’where an infrared probe (OMEGA OS551) measures the exit temperature. Ten consecutive ~1kgsamples were taken in ~30mincollecting the full stream, sealed, sampled down and sieved using the Taylor series. In the same period a bulk sample of 15–20kgwas collected blending consecutive samples. It was sealed and sieved in the nextb4hinto 11 size classes (Russell Finex Model 17240). Each fraction was kept in a sealed container and later used for analysis of structure, porosity, and composition. Water and surfactant(s) contents, denotedXwandXs, were obtained with a To-ledo Mettler Moisture Balance and analytical titrations ensuring errors b10% and 3% respectively for target values. The powder equilibrium rel-ative humidity,erH, was measured with Rotronic HygroLab 3 (probes AW-DIO) and morphology examined under Scanning Electron Micros-copy (Hitachi TM 1000). Particle intra-porosityεwas computed in each size fraction by measuring the absolute and envelope densities, ρabsandρenv, with He pycnometry (Micromeritics, AccuPyc II 1340) and Hg porosimetry (Micrometricts Autopore IV) respectively.
The deposits formed at the wall during periods of 10–15minwere photographed, collected and weighted to measure the initial net depo-sition rate,rd,o[42]at several locations. The air temperature,TA, was monitored at the inlet, tt -0, and exhaust air lines, tt -5. Inside the cham-ber,TAwas tracked using single K-type thermocouples that record the range ofTAin the radial direction either manually or automatically by placing thermocouples inside hollow metallic bars where individual openings expose each sensor to the air. The bars were aligned with the radius of the cylindrical chamber at four axial levels (Fig. 1). The bars were sufficiently far from the sprays to avoid any significant depo-sition or condensation[5]. These arrangements were validated against the exhaust probe tt - 5 in the relevant range of temperature and humid-ity. The temperature of the wall of the chamberTWwas also monitored at the conical section to ensure the dryer is at a constant temperature before sampling is conducted i.e. constant heat lossQLoss.
2.3. Particle dynamics and tower subdivision
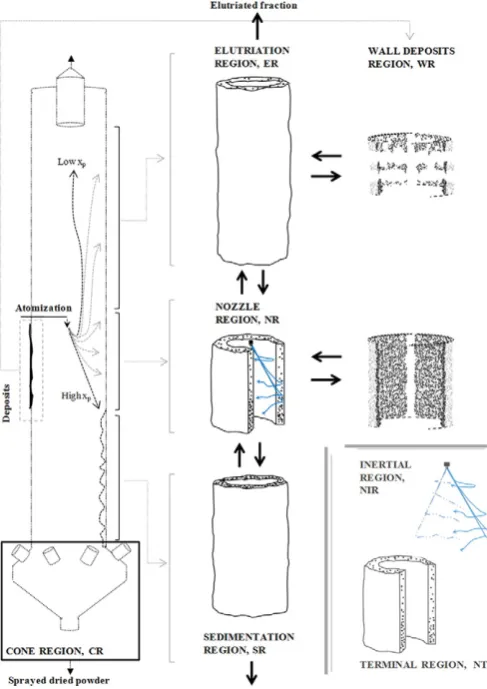
Fig. 2depicts the initial trajectory (radial vs axial position) of differ-ent sized droplets to illustrate how the spray disperses according to nu-merical models, experimental deposition rates and the established experience in thefield. In order to facilitate the design of experiments and model development, it is useful to subdivide a swirl tower into:
1- Wall region(s) -WR;
2- Nozzle region(s) -NR, comprised of: Nozzle Inertial Region -NIR Nozzle Terminal Region -NTR.
3- Sedimentation region(s) -SR; 4- Elutriation region(s) -ER; and 5- Cone region -CR.
The droplets and the hot air come into contact in the cylindrical chamber. Thefinest fractions are elutriated and depending on their re-sponse time, they either exit with the exhaust air or migrate to the walls at the top of the unit. Most of the powder becomes entrained in the swirling motion but it is sufficiently heavy to settle and flow down. Hassall[33]demonstrates that the cross-section of a swirl cham-ber has a sparse concentration of particlesnapart from an outer ring close to the wall. One can focus in this region where most of the solid phase concentrates and dries. In a similar way to a cyclonic separator, the powderflows down swirling and colliding multiple times to the wall. The outer ring can be defined as the region where the solids move at terminal velocityUp,tand thus simplify the formulation of ki-netic models. It must be subdivided according to the nozzle position. In the areas above the nozzle and below the projection of the spray,
ERandSR, particle-particle impacts occur at a low momentum simply due to different terminal velocities, but nearby the spray they involve also the wet droplets coming from the nozzle at much higher velocity. Therefore, in the nozzle region, one must distinguish two populations:
[image:3.595.303.547.53.398.2]partially entrained before reaching the wall (e.g. ~80–150μmdroplets are expected to reach the wall above the nozzle level) but in this case (a central nozzle aligned down) most of the droplets are expected to collide the wall before reaching a terminal state e.g. thefirst impact for a 400μmdrop is estimated at≈10m/s.
NTR: A non-inertial population is concentrated close to the wall and free falls at a terminal velocity, exclusive function of local conditions, particle size and density. It comprises of the population of droplets that is fully entrained (smaller sizes) or that has already collided to the wall for the first time. It also includes aflow fromERand to a less extentSR. This work, Part A, focuses on a single spray so that the recirculation into the nozzle region is limited, but when multiple sprays are used theflow from lower or upper nozzle regions becomes a significant contribu-tor to growth, Part B[46].
Finally, one must recognise the amount of material that is borne at the walls as a separate region,WRwhere the powder isfixed but re-mains subject to drying. BothWRandNRinteract by rates of deposition and re-entrainment of material. Experimental quantification of the re-entrainment from the walls, identification of different erosion mecha-nisms and their effect in particle growth and residence time have been reported in a previous work[45].
2.4. Operation and experimental set up
This paper studies the sources of agglomeration arising near the spray and how they respond to the position of the nozzle regionNR
in the chamber; Part B[46]studies how they are affected when two
NR's are stacked. In this case, a central nozzle is moved from position #1 to #2 and #3 inFig. 1to modify the concentration and the heat ex-changed inNRand cause more or less efficient contacts. Operation conditions are summarized inTable 2. The slurry rateMsand atomi-zation conditions (i.e. temperature and pressure) are kept constant. Inlet air temperatureTA,INand mass rateMAare also kept in a target value to dry the powder to an exit water contentXw, representative of industrial operation. In this way, the chamber develops the same range of superficial air velocityUav, and one can associate the chang-es in the amount of elutriated powderME, the dryer energy efficiency ηor the product properties to the way the dispersion of the solids is affected by the nozzle position.
3. Results and discussion
The following sections describe the operation (Section 3.1) the atom-ization of the slurry (Section 3.2), the temperaturefield in the dryer (Section 3.3) and the deposits associated to the spray (Section 3.4). Once the reader is clear on the characteristics of the initial set of droplets and the environment in the chamber,Sections 3.5 and 3.6discuss the or-igin of agglomeration and the product size distributions and how different sources of growth could be considered in models based in the compart-mentalization of the chamber. Finally, the consequences of agglomeration in the distribution of components across granules of different size and the generation of porosity are discussed (Sections 3.7 and 3.8).
3.1. Elutriation and capacity
[image:4.595.42.291.553.719.2]The capacity of the dryer is affected by the amount of powder discarded, which comprises of that considered too coarse, denotedMR (i.e. computed here as the fractionxpN1800μm) and the powder col-lected in the cyclones, denotedME. The capacity ratioC given in Table 2represents the usable fraction of the exit rate of spray dried powderMEP. From a low nozzle position thefine powderflowing up (Fig. 2) has a longer time to migrate to the wall, concentrate and grow, which explains why the elutriationMEreduces from 4.0% in S1 to 2.7% and 2.0% in S2and S3(Table 2). This improves capacity in S2 but when the nozzle is lowered to position #3 in S3the capacity ratio
Cdrops again because of the formation of coarse granules that must be discarded and increaseMR. Notice how the capacity diminishes in S1because more powder is elutriated and in S3due to an excessive agglomeration.
3.2. Atomization, ageing and solid-liquid separation
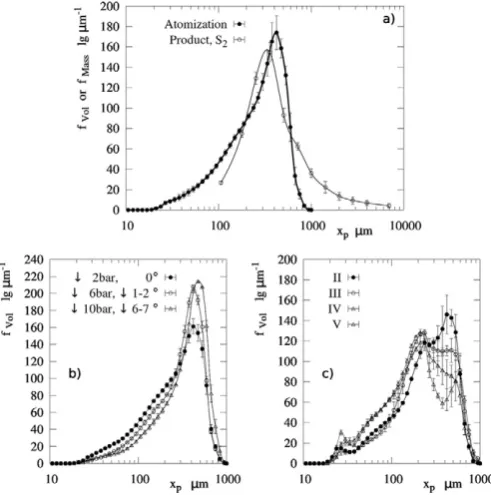
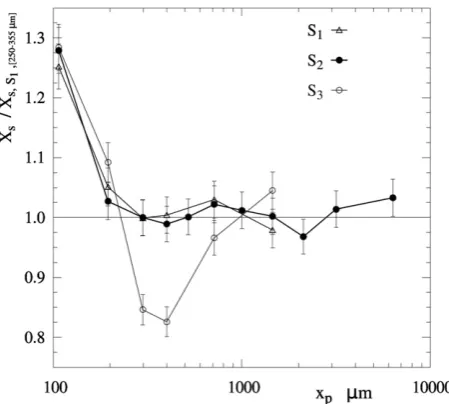
The detergent paste is strongly shear thinning, which facilitates atom-ization; the shear viscosity follows the power lawμ= 85.96⋅γ−0.5634̇ . Fig. 3a compares the initial droplet size distribution to the product size in S2. The droplets show a wide distribution with a negative skew, a modal and median diameterxp, 50between 390 - 425µmand 275 -310µmrespectively;xp, 50andxp, 90are between 77 - 98µmand 521 -549µm. The spray forms a hollow cone with a full angle of 39±1°.
Detergent slurries are complex fluids with several phases, air bubbles and suspended solids. The polymer(s) content and the surfactant(s) microstructure determine the water activity in each phase. As a result the slurry is subject to ageing andμcan increase sig-nificantly during storage, leading to atomization of larger sizes. In a swirl pressure nozzle, a more viscous paste tends to generate a smaller air core at the tip, which thickens the slurry sheet and the size of the drops it breaks into[49].Fig. 3b shows the effect of ageing during stor-age at a constant atomization rate. In order to determine the droplet size characteristic of these experiments (Fig. 3a) all measurements were taken at decreasing storage times until no variation was appreciated.
If the solids suspended in the slurry are large when compared with the slurry sheet formed at the tip, they can affect the breakup. Consider the limiting case of a paste containing mono-sized suspended solids. Only if the droplets formed were much larger than the solids could they have the average composition: if droplets were smaller that the solids, they must be comprised only of liquids and if they were comparable they may contain only a single solid or none. In essence, the liquid phases are excluded from droplets of a similar size to the solids in a paste. In prac-tise, solids are poly-dispersed and the separation of phases depends to a balance between the energy input and the effect of viscosity and surface tension in the breakup of the sheet and the later contraction of ligaments into drops. Previous work on pneumatic and air dual nozzles give evi-dence of the effect of solid-liquid separation in droplet size. Solids N50µmare shown to govern the breakup in cases of low energy input and cause the segregation of solids and liquids into different droplet sizes [50]. The detergent paste used here contains much coarser Table 2
Operation conditions as function of the nozzle position.
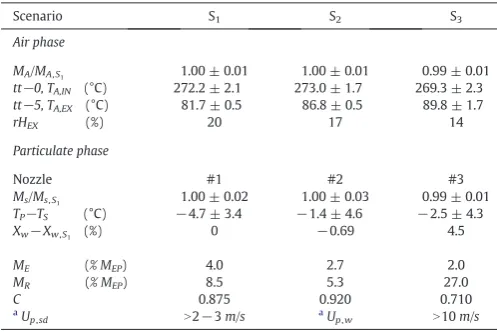
Scenario S1 S2 S3
Air phase
MA/MA,S1 1.00 ± 0.01 1.00 ± 0.01 0.99 ± 0.01
tt−0, TA,IN (°C) 272.2 ± 2.1 273.0 ± 1.7 269.3 ± 2.3 tt−5, TA,EX (°C) 81.7 ± 0.5 86.8 ± 0.5 89.8 ± 1.7
rHEX (%) 20 17 14
Particulate phase
Nozzle #1 #2 #3
Ms/Ms, S1 1.00 ± 0.02 1.00 ± 0.03 0.99 ± 0.01
TP−TS (°C) −4.7 ± 3.4 −1.4 ± 4.6 −2.5 ± 4.3
Xw−Xw,S1 (%) 0 −0.69 4.5
ME (% MEP) 4.0 2.7 2.0
MR (% MEP) 8.5 5.3 27.0
C 0.875 0.920 0.710
a
Up,sd N2−3m/s aUp,w N10m/s
A: air, IN: inlet, EX: exhaust. S: slurry, P: powder at the exit belt, E: powder at the cyclones, R: powder removed as oversized, EP: full rate of spray dried powder.
a
suspended solids (50µmbxpb200µm), which appear larger than many of the droplets formed. In a similar way to the work of Mulhem[50], the ex-clusion of the solids leads to bi-modal size distributions when the energy input decreases sufficiently.Fig. 3c shows the atomization of comparable detergent formulas for decreasingμat the same nozzle and rate. Asμand the energy input rise, both size modes begin to blend and approach the population used in this work (Fig. 3a). Here a second mode is no longer measurable but the phase separation is still significant.
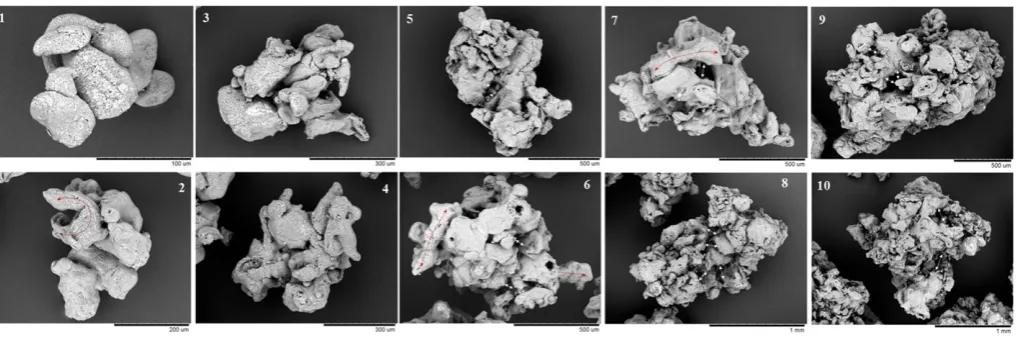
The examination of the product confirms the uneven distribution of phases.Fig. 4presents SEM micrographs offine powder collected at the cyclones to illustrate the morphology of the droplets looking at single dry particles. They reveal a very heterogeneous nature; droplets contain many ligaments and a wide array of amorphous structures from elongat-ed to planar shapes and small spherical drops.Figs. 4.4 to 4.10show the presence of porous spheres of different colour and texture; the use of EDX (Energy dissipative X-Ray spectroscopy) serves as qualitative indi-cator of the origin of different structures e.g. the surface highlighted in Fig. 4.6is linked to a higher content in inorganic salts than amorphous-like particles, which contain more carbon characteristic of the organic phases. Analysis of the powder composition provides further evidence: the smallest droplets contain more liquid phases such surfactant(s), and so the fraction of the productb150μmpresents 25 - 30% more surfactant(s) than the mode size; these difference are exacerbated in the elutriated powder to 33 - 34% in S1and S2and as much as 68% more in S3.
The variation in droplet composition and structure complicates the system. Key properties such as the initial content in water, polymer(s), solid(s), surfactant(s) or the water diffusivity probably change for droplets of different sizes. It is clear that the content in solid(s) or surfactant(s) shall affect the mechanics of any contact, but perhaps the water activity remains a dominant factor for it defines how quick the sur-face dries turning stiff and less prone to agglomerate. The description of “stickiness”and its experimental characterization in drying matter is still an open area[51,52]. In this case only few components undergo tran-sition through a glass state and key phenomena may include the evolu-tion of surfactant(s) microstructures during drying, behaviour of polymers, crystallization processes or the effect that additives or changes
in diffusivity may have in facilitating or impeding the formation of an outer crust when the droplets dry.
3.3. The drying environment
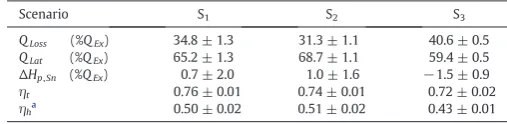
[image:5.595.36.282.53.301.2]The axial profile of the air temperatureTAin the dryer is shown in Fig. 5.TAdecreases approaching the spray, after which it reaches the ex-haust value,TA,EX. A constantTAindicates that the drying rate above the nozzle level must be minimal (i.e. note there is a low relative humidity and no air recirculation; thus drying must cause a noticeable decrease inTA).Table 3presents the energy balance to the chamber, including the fraction of the heat exchanged between the phasesQExthat is utilised in evaporationQLator in losses,QLoss. All cases operate with large heat losses; for the most part they can be explained by theΔTbetween the air distributor (tt - 0,TA,INinTable 2) and the plenum (tt- p inFig. 5). The thermal efficiency,ηt[49]of a dryer is a common way to quantify the amount of energy transferred from the air, decreasing slightly from S1to S2and S3(Table 3). However,ηtdoes not distinguish whether the energy is actually transferred to the solids or to the environment. In S3 the residence time of the powder is reduced and it becomes more difficult to convey the same amount of heat to the solid phase. As a result, the tower reaches higher temperatures and more heat is lost to the environ-ment. This is better accounted for by the heat transfer efficiencyηhgiven Fig. 4.Droplet morphology. Micrographs (1 to 4) show the presence of ligaments, small spherical drops and amorphous structures. Micrographs (6 to 10) show examples of rigid smooth particles associated to inorganic salts. Micrographs (1 to 6) correspond to S2and (7 to10) to the use of two nozzles in M13Part B[46].
[image:5.595.303.551.53.445.2]inTable 3as the ratio of the inlet air enthalpy,HA,IN, utilised in drying and heating the solids.ηhremains constant in S1and S2aroundηh=0.50 and decreases significantly in S3to 0.43, which means that one requires a much higher energy input to dry the product to the same level.
In a counter-current dryer it is not surprising to see most of the heat exchanged at the bottom where the temperature difference between the phases is the highest. However, the drying rate is also largely depen-dent on particle structure. Droplets initially shrink in a period dominated by external heat and mass transfer. Then formulas containing solids or crystalline structures[53]tend to form an outer crust that impedes the diffusion of water to the surface and the droplets start to heat up[12, 54]. Eventually they may reach the boiling temperatureTBoiland experi-ence a sudden formation of vapour[55]. In this case, the water diffusivity drops from 2.5⋅10−10-5.5⋅10−10m2/sat atomization tob10−10m2/sas drying progresses, which ensures that the drying process in a mean size droplet becomes dominated by internal diffusion. However, it is the tem-perature history what determines whether it comes to boil. The satura-tion temperature TBoil increases substantially as the particle dries, particularly when it reaches a low moisture content. Boiling tends to oc-curs preferentially when wet large droplets are sprayed directly into areas of highTA(i.e. S3) because a coarse size impedes diffusion and makes
heating faster, while high moisture reduces the boiling temperature. In contrast, when a large residence timeτpis spent in the cylinder (i.e. S1) the droplets dry progressively andTBoilbecomes too high before they face a highTAat the bottom of the dryer. Given the high temperatures used in counter-current dryers, it is common to consider that the product reaches the boiling threshold. However this is not consistent with the evolution of the efficiency observed inTable 3. Under boiling one expects to see a correlation betweenTPandXwbut in S3the powder reaches the same temperatureTPat a higher water contentXwinTable 2. One must consider that the overall decrease in the drying efficiency when moving the nozzle down in S3(Table 3) is simply proportional to a reduction in residence timeτpand relatively insensitive to the temperature faced by the solids.
3.4. Wall deposits
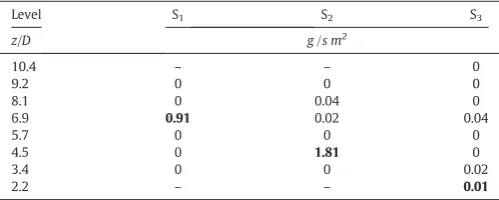
[image:6.595.303.562.55.376.2]The inspection areas and the examination of the deposits are sum-marized inFig. 6. The initial deposition rates are given inTable 4as an indication of the rate of impacts to the wall. The highest rates are asso-ciated to the area of the spray projection (i.e. 6.9Dand 4.5Dfrom posi-tions #1 and #2) where the droplets are still wet and collide the wall at high velocity. Here, thick wet deposits appear and remain subject to drying at relatively low temperatures. The amount of deposits increases when the nozzle is moved down from S1to S2due to the increasing air velocity at the bottom of the chamber and the concentration of more solids. The counter-flow and the swirl are responsible of deposition fluxes ~ 10 - 30 times higher than in co-current devices[42,43]. In S3 no deposition is appreciated at 2.2D. The inspection area lies near the projection from the spray from nozzle #3 (seeFig. 1) but the higher air velocities at the tower bottom are likely to shift the trajectories of the droplets up. The presence of deposits above the nozzle supports the dispersion pattern shown inFig. 2and demonstrates that part Fig. 5.Axial distribution of the air temperature,TAas function of nozzle position. S1(nozzle at
[image:6.595.43.293.55.375.2]z=8.2D), S2(nozzle at z=5.9D), S3(nozzle at z=3.5D). Punctual measurements in t-1 to t-4 and cross-sectional averageTA,avin tt-1 to tt-4. Dimension of the cone not to scale.
Fig. 6.Inspection of the walls of the dryer and axial distribution of deposits.
Table 3
Energy balance and energy efficiency.
Scenario S1 S2 S3
QLoss (%QEx) 34.8 ± 1.3 31.3 ± 1.1 40.6 ± 0.5
QLat (%QEx) 65.2 ± 1.3 68.7 ± 1.1 59.4 ± 0.5
ΔHp,Sn (%QEx) 0.7 ± 2.0 1.0 ± 1.6 −1.5 ± 0.9
ηt 0.76 ± 0.01 0.74 ± 0.01 0.72 ± 0.02
ηha 0.50 ± 0.02 0.51 ± 0.02 0.43 ± 0.01
aηh
[image:6.595.39.293.674.736.2]of the spray is elutriated up and then migrates to the wall at the top. As the nozzle approaches the top inS1, the spray is located close enough to the exit for all thefines to be elutriated and the deposition above the nozzle becomes negligible.
3.5. Sources of agglomeration and growth patterns
Huntington[5]lists different types of contacts depending on the dry-ing stage of the particles, namely, -i- droplet/droplet contacts near a nozzle or -ii- when several sprays overlap, -iii- droplet/particle contacts and -iv- semi-dried/semi-dried contacts resulting from different termi-nal velocities. Contacts of the type -ii- occur only in towers where mul-tiple nozzles are placed at the same level and are not considered here. The remaining are the result of air-borne collisions and their location and likelihood in a chamber can be anticipated. The growth above the spray,ER(Fig. 2), is necessarily limited; it is due to the stagnation of fines near the wall (i.e. responsible of deposits at the top of the dryer inFig. 6) and it involves contacts at low relative velocity (b1m/s) and moderate water contentXwbecause the elutriated powder dries rapidly above the nozzle (i.e.TAremains constant inFig. 5). In the region below the spray projection, SR (Fig. 2) the concentration increases and particle-particle contacts occur at higher velocity due to differences in size (b2m/s), but as soon as the solids move down they enter a region of higher air temperatureTAand are likely to form an outer crust and turn non-deformable, which makes the contacts inefficient. Below the cylinder, inCR(Fig. 2) growth is likely to be negligible because the sur-face of the particles is already dry.
In the same way that the contacts to the wall are most efficient near-by the sprays, the particle-particle interactions occurring within the nozzle regionNRare also the most likely to result in agglomeration: they involve the collisions at the highest momentum carried from the spray, when the surface of the droplets and particles remains wet and when at least one of the colliding partners is still deformable. Three sources of growth are illustrated inFig. 7:
• Coalescence inNIR. Droplet-droplet contacts (i.e. contact -i- by Hun-tington[5]) occur at high relative velocities within the spray (b20m/
s).Fig.7a shows how large droplets, less affected by drag, pick up smaller sizes that decelerate faster and concentrate. Coalescence and rates of collision are estimated from the diameter, concentration and velocity of both partners[48], and become significant only near the nozzle because the spray dilutes rapidly outwards.
• Interaction betweenNIR-NTR. Droplets at high velocity do not con-centrate sufficiently far from the nozzle to coalesce, but when reaching the walls they cruise across an annular region with a high concentration
nof drier powder, depicted inFig. 7b. In this area the spray comes into contact with harder granules (i.e. contact–iii- by Huntington[5]) comprised of (a) wet material recently sprayed, (b) drier clusters re-entrained from the deposits[33]and (c)fine powder that was dis-persed upwards and came back down close to the wall (seeFig. 2). The contacts occur at a high relative velocity and deformability and so
the amount of solids stagnated inNTRmust be a vital contributor to agglomeration.
[image:7.595.306.550.51.509.2] [image:7.595.34.284.85.185.2]•Wall-borne growth sources:Within the spray projection, the impacts to the wall include high velocity wet droplets and drier and smaller particles at low inertia (see Fig. 7c). For decades, deposits were believed to be never re-suspended or detach only as large pieces[5], but as a matter of fact all sizes are involved in the deposition / re-entrainment cycle[45]. The difference between the size of the droplets deposited and the clusters re-entrained represents a net rate of growth at the wall, which responds to how the outer layer ages and breaks up due to drag, gravity and impacts. As a passing note, it can be argued that the high velocity drops that pick up particles close to the wall in Fig. 7b will in essence end up depositing inFig. 7c. Subsequently, the properties of the clusters re-entrained later must be function of how the layer breaks rather than of the contacts before deposition. In this case, one could simplify Fig. 2 and merge WR and NTR into a boundary-layer approach similar to the work in cyclones[56], so that Fig. 7.Depiction of agglomeration sources in a nozzle regionNRresulting from (a) coalescence (b) impacts due to stagnation within the spray projection inNTR
(c) deposition and re-entrainment of clusters inWR. The Particle Image Velocimetry PIV images are reproduced from Hassall[33].
Table 4
Initial net deposition raterd,o, as a function of nozzle position. Bold denotes the spray pro-jection area.
Level S1 S2 S3
z/D g /s m2
10.4 – – 0
9.2 0 0 0
8.1 0 0.04 0
6.9 0.91 0.02 0.04
5.7 0 0 0
4.5 0 1.81 0
3.4 0 0 0.02
[image:7.595.306.548.370.498.2]one could describe a large dryer using a 3Dflow model to determine how the spray disperses intoNTR+WRand a 1D kinetic growth model thereafter.
The evolution of the product size is given inFig. 8. The droplet size distribution inFig. 3a and the product size distributions inFig. 8exhibit the same single size mode i.e. 300 - 425µm[57], but the product is clear-ly comprised of agglomerates, which evidence that such coarse droplets have either deposited or grown further. The statistics are given in Table 5. Mean values do not reflect well the change in the tail, which is key to understand the evolution of capacity (Table 2), energy effi cien-cy (Table 3) and many aspects of performance e.g. packing factor, den-sity, or solubility. When the nozzle operates from a high location, S1, the agglomeration generates the mode size and a shoulder into 600 -850µm. When the spray moves down in S2, the production of granules into the shoulder reduces and the mode narrows. The suppression of ag-glomeration can be explained by the reduction in the efficiency of the particle contacts: the spray faces a higher air temperatureTAin the noz-zle region and so the outer crust of the droplets is produced earlier and the surface becomes less prone to stick, which may reduce the level of coalescence inNIR,Fig. 7a.
One observes the same effect in the transition to a lower position in S3: the shoulder eventually vanishes and the mode keeps on narrowing, but in turn a different source of agglomerates appears forming a plateau in the size distributionN850µm. This phenomenon must be linked to the higher concentration expected near the walls inNTR, and a stronger in-teraction with the deposits inWR. When the spray is brought down one enhances the heat transfer close to the nozzle because it faces higher temperatures but in turn theNRis located in areas of higher velocity. It is possible that the transition into forming a plateau corresponds to the point where the counter airflow starts to be strong enough to accumu-late a significant amount of powder inNTR. If more solids stand in the projection of the spray they will multiply the contacts between high ve-locity droplets and stagnated powder,Fig. 7b, and ultimately the wall, Fig. 7c. Production of agglomerates in this range of size points to interac-tions occurring at the outer layer of the deposits, which are responsible of most of the agglomerates shown inFig. 8N850µmin S2(detailed quantification of the resuspended material during S2is given in[45]).
S1, S2and S3were conducted under initially cleaned walls, but the coverage and thickness of the deposits can affect the structure and tur-bulence of the airflow[58]. For that reason S1was compared to an exact replicate obtained when the dryer initially showed a heavily built up wall, denoted S1−r(for details see[58]). Both productions were indis-tinguishable in terms of efficiency and product size and composition, which suggests that once the operation progresses sufficiently and the deposits achieve a steady state thickness, the disruption to theflow be-came comparable.
3.6. Compartmentalization of swirl towers
The variety of particle contacts in a dryer complicates enormously the formulation of models. The mechanisms shown inFig. 7represent the main growth kinetics in a swirl tower. Eulerian-Lagrangian models are the most common in this context, but they face important chal-lenges in a large vortex: (a) computational expense, (b) issues in track-ing particle dispersion when anisotropy and swirl stability are important, and (c) enough resolution (i.e. parcel numbers/size bins) to track accurately the accumulation of wide particle size distributions or in large devices. The treatment of agglomeration is also computationally expensive and different contact mechanics can only be dealt with by in-creasing complexity. In turn, Eulerian-Eulerian modelling frames are unnecessarily complicated for a spray[48]but can easily deal with in-dustrial scales. The theoretical subdivision proposed here (Fig. 2) facili-tates the development of a large kinetic frame for a dryer. A similar approach to Tan[59]can serve to construct a compartmental model and discriminate the different type of contact associated to each region inFig. 2. Tan rewrites the aggregation rate kernel influidised bed melt granulation as the product of a collision rate (fluid dynamics driven) and the probability of the collisions to result in growth, or collision effi -ciency (particle property driven). As opposed to afluidised bed, in a dryer one expects the functional form of the rate of collisions to vary from the nozzle inertial regionNIR(Fig. 2) where motion is dominated by the spray momentum, to the rest of the chamber where sedimenta-tion kernels may be applicable[60-62]. The collision efficiency varies from one to another region as a function of the water content of the par-ticles. It must change from coalescence in the spray,NIR(Fig. 7a) to a capture efficiency in the interaction betweenNIRand the nozzle termi-nal regionNTR(Fig. 7b) or contacts between semidried droplets at dif-ferent stage inNTR,ERorSR(Fig. 2). At the wall depositsWR(Fig. 7c), the outcome of particle impacts could be computed in terms of a depo-sition efficiency and a resuspension probability, which ultimately de-scribes how particles grow at the walls due to the different size of the droplets deposited and the agglomerates resuspended[45].
A full resolution is very complex but this type of frame opens the way to multi-scale approaches. One can start to tailor experiments and micro-scale models to study how the rate and the efficiency of col-lisions in each region depend on the process conditions, and how the different regions interact, for instance by theflow to and from the wallsWR[45]or through the placement of several nozzles[46]. In this way, a large kinetic frame may be constructed connecting standard models only for the most relevant regions using the same architecture but with different operation conditions.
Table 5
Mass based product size distributions. Confidence intervals provide one standard deviation.
Scenario S1 S2 S3
xp,10,μm 173 ± 4 161 ± 3 195 ± 12
xp,25,μm 261 ± 7 238 ± 5 282 ± 20
xp,50,μm 413 ± 15 360 ± 10 456 ± 98
xp,75,μm 824 ± 64 597 ± 53 2224 ± 1575
xp,90,μm 1724 ± 286 1168 ± 232 xp,83= 4760μm
3.7. Redistribution of active component(s) and particle drying history
The droplet composition varies as a function of size; thus the composition and the drying history of the agglomerates depend on the size of the droplets that formed them.Figs. 9 and 10 show respectively the content in surfactant(s)XSand waterXWas function of particle size. As explained before, liquid phases such as water and surfactant(s) distribute preferentially in small droplets, and thus the finest powder contains more surfactant(s), seeFig. 9. Larger particles start to include droplets rich in solids (poor in liquids) and so they reach a minimum content in surfactant(s) and water inFigs. 9 and 10. Only when the agglomerates become sufficiently coarse to contain many pri-mary particles they tend to show an average surfactant(s) contentXSin Fig. 9. In essence, the agglomeration of droplets of different composition serves to redistribute the surfactant(s) and homogenises the powder. The phase separation is neater in S3because the mode size contains fewer agglomerates and more primary particles (i.e. droplets that did not agglomerate). The surfactant(s) contentXSat the mode size decreases by 17% in S3. The lower content for particlesb850µmevidence that less of the surfactant(s) contained infine droplets have agglomerated into coarse fractions. In contrast, as soon as the plateau starts to form in the size distri-bution shown in atFig. 8for granulesN850µm,XSrecovers inFig. 9. This correlation is a revealing fact: it supports the different origin suspected for the granules at the mode or the plateau i.e. lowering the nozzle in S3 causes simultaneously the suppression of growth into the agglomerates b850µm(likely due to less efficient contacts within the spray) and the promotion into coarser sizes (likely due to a higher concentration in
NTRand interactions at the wallWR).
The distribution of the water contentXW, given inFig. 10responds to the relation between particle size and residence time.XWrises signifi cant-ly for coarse granules because they settle faster and have a higher volume/ surface ratio. It is useful to compare the evolution ofXWand the size dis-tributions. Lowering the nozzle reduces the particle growth from S1to S2 inFig. 8which allows drying the product further inFig. 10. In S3the agglomeration in the mode and shoulder keeps on reducing but the pow-der does not reach the samefinal water content because it has a lower residence time, which is only exacerbated for coarser granules. Therefore, one must associate the loss in drying efficiency (S3,Table 3) not only to formation of the plateau but to a too low nozzle position.
Interestingly the powderb150µmin S1and S2andb355µmin S3also exits with a higher water content. Smaller droplets contain more water due to the phase separation and fragments worn off the deposits[45]
but the powderb150µmwould have dried rapidly faced to high temper-atures at the bottom of the dryer. Fine particles do not experience a lower residence time in the chamber, nor do they exhibit a different drying isotherm.Fig. 11showcases a typical relation between water content
[image:9.595.308.542.51.342.2]XWand powder equilibrium relative humidityerHfor this powder including several other productions of the same formula from nozzle #1 and nozzles #1 and #3[63]. The exception to the trend is the powder elutriated, which does not undergo rapid drying rates at the top of the dryer and shows different porosity. Equilibration during sieving (1-4h) or the transport across the tower belt inFig. 1could be responsible for the absorption of water into the small particles, but not to the extent
[image:9.595.318.538.503.701.2]Fig. 11.Correlation of the powder water contentXwto the equilibrium relative humidity erH(20−25℃) normalised to a reference point. Samples cover all particle size classes in the product and the elutriated powder for several productions of this formulation with single (S1-r, M1-r[63]) and multiple nozzles (M13-r[63]).
Fig. 9.Surfactant(s) content in the product,XS, as function of the particle size, normalised to value of the mode size class in S1.
[image:9.595.46.271.514.716.2]observed inFig. 10. The moisture of thefinest fractions must respond to attrition of fragile granules close to the exit where the full stream of pow-der comes together. The presence of fragments is consistent with the analysis of the morphology and explains why thefinest fraction contains less surfactant(s) than the elutriated powder.
3.8. Generation of structure and density
3.8.1. Morphology
The structure of primary droplets/particles (i.e. droplets that did not undergo agglomeration) is determined by the drying history and the re-sponse to boiling. After a crust is formed, droplets stop shrinking and can follow different evolutions. Earlier works describe how concentra-tion gradients[64]or receding water interfaces[65]develop and more recently include populations of pores[66,67]and the migration of solids to the surface[12]. In every case, after a crust appears drying increases porosity up to a maximum given by the volume of water displaced un-less vapour is formed. In this case, the rise in pressure may be relieved by bubbles bursting out (i.e. leaving behind cavities but no further po-rosity) or by the inflation of the drop (i.e. increasing porosity beyond the displacement of water) in a process referred to as“puffing”and often pointed at in detergent[68]. The inflation depends on the proper-ties of the crust. Most authors assume them a priori, but Handscomb and Kraft[12]describe the limiting cases: (a) a crust that is inelastic: a bub-ble forms at the core and the solids migrate to the surface, forming a hol-low particle that may or nor burst but remains un-inflated, (b) a crust that is elastic but losses elasticity when it dries: the particle inflates and after cooling it retains its shape showing an increased porosity (i.e.“puffing”) or (c) a crust that is elastic: the particle inflates when it boils but after cooling it collapses. Since the primary droplets show large differences in composition, many of these structures appear in the product.Fig. 4shows a variety of ligaments and amorphous struc-tures including spherical particles rich in salts.Fig. 12includes examples of collapsed drops (Figs. 12-1, 12-2), hollow spheres (Fig. 12-3), coiled ligaments (Figs. 12-4, 12-5) and the common porous matrices revealed through bursts and broken sections (Figs. 12-6, 12-7).
[image:10.595.44.292.57.468.2]The vast majority of the powder is in the form of complex shaped ag-gregates and it is unclear how they might respond to boiling.Fig. 12 shows typical solid bridges between the primary particles (Figs. 12-8 to 12-11), which must be formed either by diffusion at a long contact time (perhaps at the wall) or after drying of viscous bridges established at impact[2]. Most particles and bridges show a porous interior and a hollow core (Fig. 12-9), but no evidence of inflation or collapse, which Fig. 12.Particle structure resulting from drying. SEM micrographs show examples of
collapsed droplets (1,2), hollow particles (3), coiled ligaments (4,5) and common porous particles (6,7). Micrographs (8 to 11) show examples of the contacts and the solid bridges established in the agglomerates.
[image:10.595.50.559.550.719.2]suggests that the crust must remain inelastic through the drying pro-cess. The agglomerates themselves evolve from grapelike structures at thefinest fractions (e.g.Figs. 13-1, 13-4) to very complex shapes for large sizes (Figs. 13-5 to 13-10) in part because the primary droplets are deformable and elongated and in part due to the way ligaments ap-pear embedded in the structure (e.g.Figs. 12-4, 12-5, 13-2, 13-5, 13-6). Large agglomerates show high aspect ratios and wide surface cavities larger than the primary particles that form them (e.g.Figs. 13-5to 13-10). Supplementary material describing in more detail the structure of the powder in S2is available elsewhere[63].
Two sources of porosity are easily identified in the product and illus-trated inFig. 14: one associated to agglomeration whereby the surface shows wide cavities that lead into an open structure, and another at the surface of each primary particle, where small pores and bursts lead through a porous crust into the interior.Fig. 14includes details at a higher magnification to illustrate the porous nature of primary parti-cles and evidence of surface pores, bursts and cracks. These features are clearly different from the cavities originated by the agglomeration.
3.8.2. Porosity
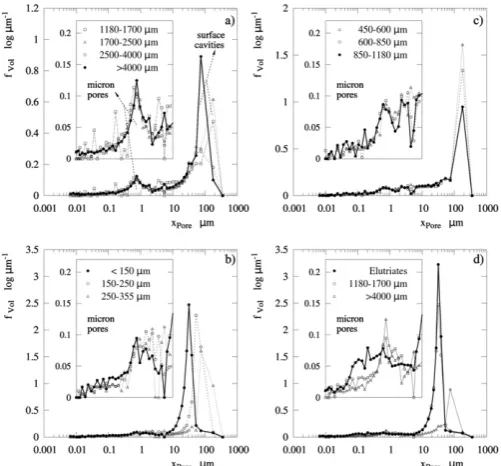
The porosimetry analysis reveals the characteristic pore sizes and highlights the effect of the surface cavities in reducing the particle den-sity.Table 6reports porosityεand density as function of the particle size for S2. The values given for εabsrepresent the volume contained in pores/cavities smaller than a threshold set according to the powder ex-amination and conservative criteria (εunder-predicted). The threshold differentiates pores and cavities (e.g. intra-particle porosity) from inter-particle voids in the intrusion cycle of Hg porosimetry shown inFig. 15. The use of narrow size classes causes a poor packing in the sample and makes inter-particle voids large so that they arefilledfirst and appear as a pick in the right hand side of the graphs. The threshold is clear in small particles (e.g.Fig. 15b and d) and becomes more obscure for larger gran-ules when the pores/cavities start to be comparable to inter-particle voids (e.g.Fig. 15c). In the coarsest fractions the entire volume shown inFig. 15a corresponds to surface cavities and pores. Two clear maxima are visible, one leading to wide cavities between 60.5μmbxporeb90.7μm and clearly associated to the effect of agglomeration, and another to mi-cron pores near 0.8μm and due to drying. The porosity attributable to micron-poresxporeb9μmranges betweenεabs= 23-27% across the en-tire product, and decreases only for the granulesN2500μmtoεabs= 15% for poresxporeb20μm. The micron-size or“drying”pores appear at the same size range for the finest particles and the coarsest
agglomerates (compareFig. 15a and b), which supports the presence of fragments described earlier. In turn, the elutriated powder,Fig. 15d, exhibits no similar micron pores very likely because it does not undergo such rapid drying rates at the top of the dryer.
[image:11.595.35.283.52.256.2]In every case the porosityεis lower than the volume of water displaced from the droplets, and so there is no evidence that inflation during boiling is a dominant way to generate porosity. In contrast, the porosity due to drying can be justified by the formation of an inelastic crust. The morphology of the powder and the contribution of large cav-ities to porosity indicate that the agglomeration must be considered an important contributor to the reduction of density, particularly in frac-tionsN850μm. Furthermore, notice that the values of εabsreported for the coarsest granules represent an underprediction of the porosity be-cause the agglomerates start to contain cavities too wide to be mea-sured (i.e. the bulk densityρbulkis computed atxporeb353μm, and starts to increase inTable 6for fractionsxpN850μm).
Fig. 14.Sources of porosity. Cracks, bursts and pores in the surface of primary particles and surface cavities due to agglomeration.
[image:11.595.305.550.94.257.2]Fig. 15.Pore size distributions in the product for S2(nozzle at z=5.9D). Intrusion curves of Hg as function of particle size a)xpN1180μm, b)xpb355μm, c) 450μmbxpb1180μm, d) comparison of elutriated powder and coarse fractions.
Table 6
Particle density and porosity. Bulk, envelope and skeletal densities,ρbulk,ρenvandρske(see nomenclature) and the porosity between the thresholds for the envelope to the absolute density,εabsand between the envelope and skeletal density,εske.
Size class,μm
Single nozzle operation, S2 kg/m3
%
ρbulk ρenv ρske ρabs εske εabs
Elutriated 0.67 0.971
1.79 1.76 45 45
b152 0.67 0.922
1.55 1.78 41 48
152–250 0.68 1.332 1.79 1.89 26 30
250–355 0.61 1.263 1.68 1.92 25 35
355–450 a a a
1.93 a a
450–600 0.56 1.204
1.77 1.93 32 38
600–850 0.61 1.184
1.69 1.91 30 38
850–1180 0.69 1.114
1.56 1.92 29 42
1180–1800 0.88 1.174
1.69 1.93 31 39
1800–2500 0.81 1.144 1.62 1.91 30 40
2500–4000 1.15 1.314
2.01 1.91 35 31
N4000 1.04 1.114
1.94 1.89 43 41
Average ~0.67 ~1.19 ~1.71 ~1.90 ~30 ~37
1,2,3,4Refer respectively to a pore threshold size to inter-particle cavities of 30.2,33.0,60.5,90.7μm. a
[image:11.595.302.553.474.707.2]4. Conclusions
a) Agglomeration, operation and efficiency:In a swirl tower with a single detergent spray the drying rate above the nozzle level are negligible due to minimal recirculation of powder; most of the heat is exchanged at the bottom and below the cylindrical cham-ber. Wall deposits are caused by direct projection of the sprays and the elutriated powder that migrates to the wall at the top of the dryer. High nozzle positions generate wide product size dis-tributions and promote the elutriation of powder, reducing ca-pacity. Bringing the nozzle down inhibits the agglomeration into the mode size and narrows the distribution. Eventually, the residence time of the product reduces excessively and the nozzle enters areas of higher concentration, which causes insufficient drying and formation of coarse granulesN850μm. The drying ef-ficiencyηhreduces from 0.50 to 0.43 and the excessive agglomer-ation makes capacity to drop from a maximum of 0.920 to 0.710. An optimum location is sufficiently far from the top to allow the fine powder to migrate to the walls and away from the bottom to maintain a sufficient residence time for the product to dry.
b) Composition heterogeneity and structure:The atomization of detergents is prone to the separation of solid and liquid phases, which results in a size dependent distribution of water and active components in the product. The droplets exhibit a heterogeneous structure and contain many ligaments. In majority, the resulting powder comprises of non-spherical granules with high aspect ratios. Primary particles are bounded by solid bridges and form large cavities superimposed to micron pores due to drying. For this formulation no evidence suggests that droplet inflation is a dominant way to reduce density. Porosity is due to micron-sized pores due to drying (εb27% across different size classes) and to the contribution of cavities formed during the agglomeration (up toεN25% for the coarsest granules).
c) Compartmentalization and future work:According to these observations and recent studies of fouling[45]a new compartmen-talization has been proposed to help studying swirl drying towers. It is based in the recognition of the different sources of growth established within (a) the spray, (b) the near wall region in the spray projection (c) and the cycle of deposition/resuspension of ma-terial at the wall. This theoretical frame and the experimental data reported here can help in the extraction of growth kinetics and the development of future kinetic models for a drying tower.
Nomenclature
A Cross-sectional area of the cylindrical chamber, m2
C Capacity ratioC= 1 - ((ME+MR)/MEP),−
D Diameter of the cylindrical chamber, m
d Diameter of the top exit in the dryer, tubular guard, m
erH Equilibrium relative humidity of the product, %
f Normalised size frequency in a probability density function Given in volume or mass base, log (μm)−1
HA Enthalpy rate for the air phase taking ambient temperature as a reference, J s−1
ΔHDA,sn Enthalpy variation between outlet and inlet air in a dry basis, J s−1
ΔHP,sn Enthalpy variation between the outlet product, elutriates and water vapour and the inlet slurry, J s−1
M Mass rate, kg s−1
MS Mass rate of slurry sprayed at the nozzle, kg s−1
ME Mass rate of powder elutriated and collected at the cyclones, kg s−1
MR Mass rate of oversized product exiting the tower belt, kg s−1
MP Mass rate of the product exiting the tower belt, kg s−1
MEP Overall rate of powder exiting the spray drying chamber, kg s−1
n Particle number concentration, m−3
Oh2 Ohnesorge number,Oh2
¼2μp2=x pρpσp
QLat Latent enthalpy rate of the water vapour generated in the chamber, J s−1
QLoss Rate of heat lost to the environment, J s−1
QEx Rate of heat exchanged in the dryer
QEx=QLat+Qloss=−(ΔHDA,sn+ΔHP,sn), J s−1
QS Rate of heat transferred to the solid phase
QS=−(ΔHDA,sn+QLoss) =QLat+ΔHP,sn, J s−1
rd,o Initial net wall deposition rate, g s-1m−2
rH Relative humidity of the air phase, %
T Time averaged temperature, °C
TA,av Cross-sectional average air temperature,TA,av=∫ρAUA,zTAdA / ∫ρUA,zdA where normalised radial profiles forUA,zare taken an from isothermal case[46].
U Time averaged velocity, m s−1
Uav Bulk or superficial air velocity. m s−1
Up,sd Particle sedimentation or free falling velocity (axial compo-nent ofUp,t), m s−1
Up,t Particle terminal velocity, m s−1
Up,w Particle velocity for thefirst wall impact, m s−1
xp Particle/droplet diameter,μm
xpore Pore/cavity/void diameter,μm
Xs Product surfactant(s) mass fraction in a dry basis
Xw Product water mass fraction
z Axial position in the cylindrical chamber measured from the level of the air inlets, m
Greek letters and symbols
εabs Intra-particle porosity in pores below the envelope threshold, %
εske Intra-particle porosity, in pores between the envelope and skeletal thresholds, %
ηt Thermal efficiency in the dryer, ηt= (TA,IN−TA,EX)/(TA,IN−Tamb)
ηh Heat transfer efficiency in the dryer,ηh=Qs/HA,IN μ Slurry viscosity, kg s−1m−1
ρ Density, kg m−3
ρabs Absolute particle density including no pores in He pycnometry, kg m−3
ρbulk Bulk particle density including cavities up toxporeb353μmin Hg porosimetry, kg m−3
ρenv Envelope particle density including pores smaller than the threshold inTable 6in Hg porosimetry, kg m−3
ρske Skeletal particle density, including pores up toxporeb6nmin Hg porosimetry, kg m−3
Ωi Design swirl intensity, non-dimensionalflux of angular mo-mentum[46].
Subscripts, superscripts and caps A For the air phase
DA For dry air
DS For dry slurry
E For the elutriated powder
EP For the full powder exiting the tower (elutriated fraction + product from the bottom)
EX Exhaust conditions
IN Inlet conditions
P For the particle/product exiting the bottom end of the tower
R For the fraction of oversized powder removed from the product
Acknowledgments
VF was supported by an Engineering Doctorate Studentship spon-sored by the Engineering and Physical Sciences Research Council (EPSRC) and Procter & Gamble in the Industrial Doctoral Centre in For-mulation Engineering, School of Chemical Engineering, University of Birmingham. The authors want to thank Mr. Adrien Serout for his valu-able help and advice in the conduction of experiments and the studies of atomization.
References
[1] T.A. Langrish, D.F. Fletcher, Prospects for the modelling and design of spray dryers in the 21st century, Dry. Technol. 21 (2) (2003) 197–215.
[2] S. Palzer, Agglomeration of pharmaceutical, detergent, chemical and food powders. Similarities and differences of materials and processes, Powder Technol. 206 (2011) 2–17.
[3] D.F. Fletcher, B. Guo, D.J.E. Harvie, J.J. Nijdam, J. Williams, What is important in the simulation of spray dryer performance and how do current CFD models perform? Appl. Math. Model. 30 (2006) 1281–1292.
[4] T.A. Langrish, Multi-scale mathematical modelling of spray dryers, J. Food Eng. 93 (2009) 218–228.
[5] D.H. Huntington, The influence of the spray drying process on product properties, Dry. Technol. 22 (6) (2004) 1261–1287.
[6] M.R. Islam, S. Sablani, A. Mujumdar, An artificial neural network model for predic-tion of drying rates, Dry. Technol. 21 (9) (2003) 1867–1884.
[7] S. Keshani, W.R.W. Dauda, M.W. Woo, M.W.M. Talib, A.L. Chuah, A.R. Russly, Artifi -cial neural network modeling of the deposition rate of lactose powder in spray dryers, Dry. Technol. 30 (4) (2012) 386–397.
[8] J. Qian, C.K. Law, Regimes of coalescence and separation, J. Fluid Mech. 331 (1997) 59–80.
[9] Y. Liao, D. Lucas, A literature review on mechanisms and models for the coalescence process offluid particles, Chem. Eng. Sci. 65 (2010) 2851–2864.
[10]N. Dalmaz, H.O. Ozbelge, A.N. Eraslan, Y. Uludag, Heat and mass transfer mecha-nisms in drying of a suspension droplet: a new computational model, Dry. Technol. 25 (1–3) (2007) 391–400.
[11] M. Mezhericher, A. Levy, I. Borde, Theoretical models of single droplet drying kinet-ics: a review, Dry. Technol. 28 (2) (2010) 278–293.
[12] C.S. Handscomb, M. Kraft, Simulating the structural evolution of droplets following shell formation, Chem. Eng. Sci. 65 (2010) 713–725.
[13]I. Zbicinski, Development and experimental verification of momentum, heat and mass transfer model in spray drying, Chem. Eng. J. 58 (1995) 123–133.
[14]I.C. Kemp, D.E. Oakley, Modeling of particulate drying in theory and practice, Dry. Technol. 20 (9) (2002) 1699–1750.
[15] L. Huang, A.S. Mujumdar, Simulation of an industrial spray dryer and prediction of off-design performance, Dry. Technol. 25 (4) (2007) 703–714.
[16]M. Mezhericher, A. Levy, I. Borde, Modeling of droplet drying in spray chambers using 2D and 3D computationalfluid dynamics, Dry. Technol. 27 (3) (2009) 359–370.
[17] M.W. Woo, W.R.W. Daud, A.S. Mujumdar, S.M. Tasirin, M.Z.M. Talib, Role of rheolog-ical characteristics in amorphous food particle-wall collisions in spray drying, Pow-der Technol. 198 (2010) 252–257.
[18] Y. Jin, X.D. Chen, A Fundamental Model of Particle Deposition Incorporated in CFD Simulations of an Industrial Milk Spray Dryer, Dry. Technol. 28 (8) (2010) 960–971.
[19] M. Sadripour, A. Rahimi, M.S. Hatamipour, Experimental study and CFD modeling of wall deposition in a spray dryer, Dry. Technol. 30 (6) (2012) 574–582.
[20]M. Rüger, S. Hohmann, M. Sommerfeld, G. Kohnen, Euler/Lagrange calculations of turbulent sprays: the effect of droplet collisions and coalescence, Atomization Sprays 10 (2000) 47–81.
[21] M. Sommerfeld, Validation of a stochastic Lagrangian modeling approach for inter-particle collisions in homogeneous isotropic turbulence, Int. J. Multiphase Flow 27 (2001) 1829–1858.
[22] R.E.M. Verdurmen, P. Menn, J. Ritzert, S. Blei, G.C.S. Nhumaio, T.S. Sørensen, M. Gunsing, J. Straatsma, M. Verschueren, M. Sibeijn, G. Schulte, U. Fritsching, K. Bauckhage, C. Tropea, M. Sommerfeld, A.P. Watkins, A.J. Yule, H. Schønfeldt, Simula-tion of agglomeraSimula-tion in spray drying installaSimula-tions: the EDECAD project, Dry. Technol. 22 (6) (2004) 1403–1461.
[23] B. Guo, D.F. Fletcher, T.A. Langrish, Simulation of the agglomeration in a spray using Lagrangian particle tracking, Appl. Math. Model. 28 (2004) 273–290.
[24] M. Mezhericher, A. Levy, I. Borde, Probabilistic hard-sphere model of binary particle–particle interactions in multiphaseflow of spray dryers, Int. J. Multiphase Flow 43 (2012) 22–38.
[25] L. Malafronte, L. Ahrné, F. Innings, A. Jongsma, A. Rasmuson, Prediction of regions of coalescence and agglomeration along a spray dryer—application to skim milk pow-der, Chem. Eng. Res. Des. 104 (2015) 703–712.
[26] M.J. Hoeven, Particle-droplet collisions in spray drying(Ph.D. thesis) School of Engi-neering. University of Queensland, Brisbane. Australia, 2008.
[27] C. Focke, M. Kuschel, M. Sommerfeld, D. Bothe, Collision between high and low vis-cosity droplets: direct numerical simulations and experiments, Int. J. Multiphase Flow 56 (2013) 81–92.
[28] M. Kuschel, M. Sommerfeld, Investigation of droplet collisions for solutions with dif-ferent solids content, Exp. Fluids 54 (2013) 1440.
[29] S. Palzer, The effect of glass transition on the desired and undesired agglomeration of amorphous food powders, Chem. Eng. Sci. 60 (2005) 3959–3968.
[30]S. Palzer, Influence of material properties on the agglomeration of water-soluble amorphous particles, Powder Technol. 189 (2009) 318–326.
[31] A. Gianfrancesco, C. Turchiuli, E. Dumoulin, S. Palzer, Prediction of powder stickiness along spray drying process in relation to agglomeration, Part. Sci. Technol. 27 (5) (2009) 415–427.
[32] S. Palzer, C. Dubois, A. Gianfrancesco, Generation of product structures during drying of food products, Dry. Technol. 30 (1) (2012) 97–105.
[33]G. Hassall, Wall Build up in Spray Driers(EngD thesis) Chemical Engineering. Uni-versity of Birmingham, Birmingham. United Kingdom, 2011.
[34] D.J.E. Harvie, T.A.G. Langrish, D.F. Fletcher, A computationalfluid dynamics study of a tall-form spray dryer, TransIChemE 80 (Part C) (2002) 163–175.
[35] M. Ali, Numerical Modelling of a Counter-current Spray Drying Tower(PhD thesis) University of Leeds, Leeds. United Kingdom, 2014.
[36] V. Moshkin, A.V. Desyatov, N.P. Kakurkin, Hydrodynamic stability of the two-phase nonisothermalflow in a countercurrent spray dryer, Theor. Found. Chem. Eng. 41 (6) (2007) 816–821.
[37]I. Zbicinski, R. Zietara, CFD model of counter-current spray drying process, 2004 169–176 (Drying, São Paulo, Brazil, A).
[38]G. Fieg, G. Wozny, K. Buick, L. Jeromin, Estimation of the drying rate and moisture profiles in an industrial spray dryer by means of experimental investigations and a simulation study, Chem. Eng. Technol. 17 (1994) 235–241.
[39]I. Zbicinski, A. Delag, C. Strumillo, J. Adamiec, Advanced experimental analysis of drying kinetics in spray drying, Chem. Eng. J. 86 (2002) 207–216.
[40] I. Zbicinski, M. Piatkowski, Continuous and discrete phase behavior in counter cur-rent spray drying, Dry. Technol. 27 (12) (2009) 1353–1362.
[41] I. Zbiciński, L. Xuanyou, Conditions for accurate CFD modeling of spray-drying, Dry. Technol. 24 (9) (2006) 1109–1114.
[42] L. Ozmen, T.A.G. Langrish, An experimental investigation of the wall deposition of milk powder in a pilot-scale spray dryer, Dry. Technol. 21 (7) (2003) 1235–1252.
[43] K. Kota, T.A.G. Langrish, Fluxes and patterns of wall deposits for skim milk in a pilot-scale spray dryer, Dry. Technol. 24 (8) (2006) 993–1001.
[44]S. Keshani, W.R.W. Daud, M.M. Nourouzi, F. Namvar, G. Mostafa, Spray drying: an overview on wall deposition, process and modelling, J. Food Eng. 146 (2015) 152–162.
[45]V. Francia, L. Martin, A.E. Bayly, M.J.H. Simmons, The role of wall deposition and re-entrainment in swirl spray dryers, AICHE J. 61 (6) (2015) 1804–1821.
[46] V. Francia, L. Martin, A.E. Bayly, M.J.H. Simmons, Agglomeration in Counter-current Spray Drying Towers, Part B: Interaction Between Multiple Spraying Levels (2016),
http://dx.doi.org/10.1016/j.powtec.2016.05.010.
[47]V. Francia, L. Martin, A.E. Bayly, M.J.H. Simmons, An experimental investigation of the swirlingflow in a tall-form counter-current spray dryer, Exp. Thermal Fluid Sci. 65 (2015) 52–64.
[48]J.J. Nijdam, B. Guo, D.F. Fletcher, T.A. Langrish, Lagrangian and Eulerian models for simulating turbulent dispersion and coalescence of droplets within a spray, Appl. Math. Model. 30 (2006) 1196–1211.
[49] K. Masters, Spray Drying: An introduction to Principles, Operational Practice and Ap-plications, Leonard Hill Books, London, 1972.
[50] B. Mulhem, G. Schulte, U. Fritsching, Solid–liquid separation in suspension atomiza-tion, Chem. Eng. Sci. 61 (2006) 2582–2589.
[51] B. Adhikar, T. Howes, B.R. Bhandar, V. Troung, Effect of addition of maltodextrin on drying kinetics and stickiness of sugar and acid-rich foods during convective drying: experiments and modelling, J. Food Eng. 62 (2004) 53–68.
[52] S.R.L. Werner, J.R. Jones, A.H.J. Paterson, Stickiness of maltodextrins using probe tack test during in situ drying, J. Food Eng. 80 (2007) 859–868.
[53] D.E. Walton, C.J. Mumford, Spray dried products—characterization of particle mor-phology, Chem. Eng. Res. Des. 77 (A1) (1999) 21–38.
[54] M. Kadja, G. Bergeles, Modelling of slurry droplet drying, Appl. Therm. Eng. 23 (2003) 7,829–7,844.
[55]C.S. Handscomb, M. Kraft, A.E. Bayly, A new model for the drying of droplets con-taining suspended solids, Chem. Eng. Sci. 64 (2009) 628–637.
[56] C.H. Kim, J.W. Lee, A new collection efficiency model for small cyclones considering the boundary-layer effect, Aerosol Sci. 32 (2001) 251–269.
[57] V. Francia, L. Martin, A.E. Bayly, M.J.H. Simmons, Particle aggregation in large counter-current spray drying towers: nozzle configuration, vortex momentum and temperature, 7th World Congress in Particle Technology WCPT, Beijing, R.P·China, 2014, Procedia Engineering, Vol. 102 2015, pp. 668–675.
[58] V. Francia, L. Martin, A.E. Bayly, M.J.H. Simmons, Influence of wall friction on
flow regimes and scale up of swirl spray dryers, Chem. Eng. Sci. 134 (2015) 399–413.
[59] H.S. Tan, A.D. Salman, M.J. Hounslow, Kinetics offluidized bed melt granulation—II: modelling the net rate of growth, Chem. Eng. Sci. 61 (2006) 3930–3941.
[60] X. Li, B. Logan, Collision frequencies of fractal aggregates with small particles by differential sedimentation, Environ. Sci. Technol. 31 (1997) 1229–1236.
[61] S.B. Grant, J.A. Kim, C. Poory, Kinetic theories for the coagulation and sedimentation of particles, J. Colloid Interface Sci. 238 (2001) 238–250.
[62] P. Horvai, S.V. Nazarenko, T.H.M. Stein, Coalescence of particles by differential sedi-mentation, J. Stat. Phys. 130 (2008) 1177–1195.
[64] G. Meerdink, K. Riet, Prediction of product quality during spray drying, TransIChemE 73 (C) (1995) 165–170.
[65]S. Nesci, J. Vodnik, Kinetics of droplet evaporation, Chem. Eng. Sci. 46 (2) (1991) 527–537.
[66]M. Mezhericher, A. Levy, I. Borde, Theoretical drying model of single droplets con-taining insoluble or dissolved solids, Dry. Technol. 25 (4–6) (2007) 1025–1032.
[67] M. Mezhericher, A. Levy, I. Borde, Heat and mass transfer of single droplet/wet par-ticle drying, Chem. Eng. Sci. 63 (1) (2008) 12–23.