ISSN 1017-6004
eurostat
EXTERNAL TRADE
Monthly statistics
1994
Theme
External trade
Series
Short-term trends
Æ*
6
LIE
eurostat
OFICINA ESTADÍSTICA DE LAS COMUNIDADES EUROPEAS
DE EUROPÆISKE FÆLLESSKABERS STATISTISKE KONTOR
STATISTISCHES AMT DER EUROPÄISCHEN GEMEINSCHAFTEN
ΣΤΑΤΙΣΤΙΚΗ ΥΠΗΡΕΣΙΑ ΤΩΝ
ΕΥΡΩΠΑΪΚΩΝ ΚΟΙΝΟΤΗΤΩΝ
STATISTICAL OFFICE OF THE EUROPEAN COMMUNITIES
OFFICE STATISTIQUE DES
COMMUNAUTÉS EUROPÉENNES
ISTITUTO STATISTICO DELLE COMUNITÀ EUROPEE
BUREAU VOOR DE STATISTIEK DER EUROPESE GEMEENSCHAPPEN
SERVIÇO DE ESTATÍSTICA DAS COMUNIDADES EUROPEIAS
L2920 Luxembourg Tél. 43 011 Télex COMEUR LU 3423
B1049 Bruxelles, rue de la Loi 200 Tél. 299 11 11
Las publicaciones de Eurostat están clasificadas por temas y por series. La clasificación se encuentra al final de
la obra. Para mayor información sobre las publicaciones, rogamos se pongan en contacto con Eurostat.
Para los pedidos, diríjanse a las oficinas de venta cuyas direcciones figuran en la página interior de la
contracubierta.
Eurostats publikationer er klassificeret efter emne og serie. En oversigt herover findes bag i hæftet. Yderligere
oplysninger om publikationerne kan fås ved henvendelse til Eurostat.
Bestilling kan afgives til de salgssteder, der er anført på omslagets side 3.
Die Veröffentlichungen von Eurostat sind nach Themenkreisen und Reihen gegliedert. Die Gliederung ist hinten in
jedem Band aufgeführt. Genauere Auskünfte über die Veröffentlichungen erteilt Eurostat.
Ihre Bestellungen richten Sie bitte an die Verkaufsbüros, deren Anschriften jeweils auf der dritten Umschlagseite
der Veröffentlichungen zu finden sind.
Οι
εκδόσεις της Eurostat ταξινομούνται κατά θέμα και κατά σειρά. Η ακριβής ταξινόμηση αναφέρεται στο
τέλος κάθε έκδοσης. Για λεπτομερέστερες πληροφορίες σχετικά με τις εκδόσεις, μπορείτε να
απευθύ-νεσθε στην Eurostat.
Για τις παραγγελίες μπορείτε να απευθύνεσθε στα γραφεία πώλησης, των οποίων οι διευθύνσεις
αναγράφονται στη σελίδα 3 του εξωφύλλου.
Eurostat's publications are classified according to themes and series. This classification is indicated at the end of
the publication. For more detailed information on publications, contact Eurostat.
Orders are obtainable from the sales offices mentioned on the inside back cover.
Les publications d'Eurostat sont
classées par thème et par série. Cette classification est précisée à la fin
de l'ouvrage. Pour des informations plus détaillées sur les publications, contactez Eurostat.
Pour les commandes, adressez-vous aux bureaux de vente dont les adresses sont indiquées à la page 3
de la couverture.
Le pubblicazioni dell'Eurostat sono classificate per tema e per serie. Tale classificazione è precisata alla fine
dell'opera. Per informazioni più dettagliate sulle pubblicazioni rivolgersi all'Eurostat.
Per eventuali ordinazioni rivolgersi a uno degli uffici di vendita i cui indirizzi figurano nella 3
apagina della
copertina.
De publikaties van Eurostat zijn ingedeeld naar onderwerp en serie. Deze indeling is achter in het boek
opgenomen. Voor nadere informatie over de publikaties kunt u sich wenden tot Eurostat.
Gelieve bestellingen op te geven bij de verkoopbureaus, waarvan de adressen op bladzijde 3 van de omslag zijn
vermeld.
As publicações do Eurostat estão classificadas por tema e por série. Esta classificação está indicada no firn da
obra. Para mais informações sobre as publicações é favor contactar Eurostat.
EXTERNAL TRADE
Monthly statistics
Contents
Preface IV
Abbreviations IX
Trends in Community trade XI
[image:5.595.65.531.0.778.2]Analysis of the preceding month
Table OA: Results of seasonal adjustment XII
Table OB: Global trends XIV
Table OC: Trade by partner countries XVIII
Table OD: Trade by products XXII
Trade of the Member States.
Trends in indices
Table OE: Indices of value, volume and unit value XXVI
Table OF: Cover rate, volumes ratio and terms of trade XXVIII
Table OG: Development of indices of Community trade XXX
World trade 1
Table 1 A: Trends in world trade 3
Table IB: Comparison of trade patterns of EC, the USA, Japan and EFTA 6
Table 1C: Trends in the trade of the most important third countries 8
Table 1D: Main trading partners of third countries 12
Table IE: Main trading partners of the EC 14
Trading partners 15
Table 2A: Development in EC trade 16
with the rest of the world, the USA, Japan and EFTA 17
Table 2B: Trends in the trade of goods with main trading partners - annual data 18
Table 2C: Trends in the trade of goods with main trading partners - monthly data 19
Table 2D: Pattern of trade with main trading partners, by product 24
Products traded 29
Table 3A: Main products traded - annual data 30
Table 3B: Main products traded - monthly data 31
Table 3C: Geographical pattern of trade, by main products 34
Table 3D: Trade in agricultural products (main categories of product) 42
Table 3E: EC trade in petroleum and petroleum derivatives
Member States' external trade 59
Table 4A: Trends in the EC's external trade, by Member State 61
Table 4B: Trends in Member States' trade, by geographical zone 62
Table 4C: Geographical pattern of trade of Member States 70
Table 4D: Pattern of trade of Member States by product 78
EC trade by mode of transport 87
Table 5 : EC trade by mode of transport 88
Annexes 91
Table 6: Conversion rates 92
Standard International Trade Classification (SITC, Rev. 3) 93
Geonomenclature 1993 97
Economic zones 1993 101
[image:5.595.70.532.46.563.2]Foreword
1. Introduction
The monthly bulletin on external trade, published by Eurostat in the Β series, Short-term trends, sets out to provide
within the shortest possible deadlines data on short-term trends in the Community's external trade. In particular, it
contains data on the Community's trade flows with its trading partners and the various economic areas and a
breakdown of this data by major product group. The bulletin also provides an overview, based on data from various
international sources, of the place occupied by the Community in the external trade of its main trading partners and of
third countries. Trade flows between Member States are recorded under the Intrastat system and will be published at a
later date.
The Community's external trade statistics at the most detailed classification level are published monthly on
CD-ROM (B series: Monthly external trade of the EEC).
Trends in external trade since 1958 and a comparison with world trade are contained in the publication
"External
Trade Statistical Yearbook
(Series A)".
External trade statistics are also available on line via the Eurostat data banks (Comext).
The catalogue of Eurostat publications and a detailed methodological description can be found in
"External Trade
Statistics User's Guide"
published in all the Community languages.
2. Sources
Since 1978, the Member States have transmitted Community external trade statistics according to a uniform
methodology laid down by Council Regulation (EEC) No 1736/75. This regulation was amended to take account of
the new developments in 1988, i.e. the introduction of the new external trade classification entitled "Combined
Nomenclature" (CN) and the new "Single Administrative Document".
The tables in this bulletin are compiled by Eurostat from the detailed data transmitted on magnetic tape by the
Member States; these data are broken down according to the eight-digit subheadings of the Combined
Nomenclature.
Eurostat wishes to take this opportunity of thanking the relevant departments in the Member States for their
cooperation, which enables it to compile these harmonized Community statistics and to ensure their quality.
3. Coverage
The results of the Community statistics relate to special trade. This comprises:
1 ) imports of goods placed in free circulation on their arrival at or on leaving warehouses, imports for inward
processing and imports after outward processing (customs procedures);
2) exports of Community goods, exports after inward processing and exports for outward processing (customs
procedures).
Transit and warehousing traffic are not covered by Community statistics.
4. Statistical territory
The statistical territory of the Community comprises the customs territory of the Community excluding the French
overseas departments. Thus Greenland, the Canary Islands and Ceuta and Melilla are not covered, while the Azores
and Madeira for Portugal and the Balearics for Spain are.
From October 1990, the external trade data of the Federal Republic of Germany, the other Member States and EUR 12
relate to the Federal Republic of Germany in its borders after 3 October 1990.
5. Goods classification
In this publication the results are broken down by the sections and divisions of the UN Standard International Trade
Classification (SITC Rev. 3 since 1988) by means of correspondence tables drawn up by Eurostat on the basis of the
Combined Nomenclature (CN).
6. Trading partners: countries and economic areas
The Community results are broken down by country of origin, country of consigment and country of destination in
accordance with the "Country nomenclature for statistics on Community external trade and trade between its
Member States", referred to as the Geonomenclature (Geonom).
When goods that originate in third countries and are not in free circulation in the Community are imported,
Community statistics state the country of origin. When such goods are exported, the country of destination is
specified.
7. Units
Values
The statistical value of goods on import is equal to the customs valuation or to a value determined by reference to the
concept of customs valuation (in the case, for example, of imports from other Member States). It is the CIF value
(cost, insurance, and freight).
The statistical value of goods on export is equal to their value at the place and time at which they leave the statistical
territory of the exporting Member State. It is the FOB value (free on board).
The value is expressed in European units of account (ecus). The ecu is a "basket" currency unit based on the market
exchange rates of a certain quantity of each Community currency according to a weighting system involving the
five-year average of each Member State's gross national product and intra-Community trade balance. The rates used
in this bulletin are averages of daily rates. The bulletin contains a table showing the conversion rates used.
Quantity
The statistics give the net weight of the goods.
8. Confidentiality
Most Member States take measures to guarantee the confidentiality of certain flows of goods. The relevant
legislation, the procedures for implementing it and the range of goods subject to secrecy vary from one Member State
to another.
This confidentiality applies to the most detailed level of the classification used for collecting the data; it may therefore
refer to all or only part of a subheading of the Combined Nomenclature. Similarly, confidentiality may apply to
imports only or to exports only and to only some of the variables recorded (value, statistical procedure, quantities,
country, partner, etc.).
Measures are taken during collection and during processing by Eurostat to minimise the effect of these headings on
the results for the Community as a whole; in particular, trade data on these headings are included at higher levels of
aggregation and in the totals.
9. Corrections
Every month the Member States send Eurostat a magnetic tape containing the results for the current month.
In order to correct these results, the Member States also send every month a magnetic tape containing monthly
corrections covering the previous 24-month period.
Indices
1. Introduction
Changes over time in the value of trade are influenced by variations in prices and the quantities marketed. Indices are
used to measure these two effects. In general, a system of indices is chosen so that the product of the volume index and
the price index expresses the value index. Several systems of indices meeting this requirement may be regularly used.
The results obtained by using one system will generally be different from those obtained by using another. For
various reasons the Member States do not use a common system, and the level of breakdown of their indices by
product group and by partner area also varies. Eurostat has therefore devised its own external trade indices which
enable it to calculate, for each Member State, Community indices on a strictly comparable basis. These indices may
be consulted on the Trend database developed by Eurostat.
2. Sources of data
There are basically two ways of obtaining information on prices: conducting price surveys by directly approaching
importers and exporters and using data collected by the customs authorities. At present only customs data are
available in all the Member States. Eurostat therefore calculates indices of unit values (values divided by quantities)
and uses them as price variation indicators. The computing programs contain a system for automatically identifying
extreme unit values pointing to unlikely price movements.
3. Extreme values
To avoid a number of restrictions involved in using customs data, Eurostat decided to adopt two basic principles in
calculating unit value indices: using the most detailed data possible and always bearing in mind that the object of the
exercise is to break down variations in value into a "price" component and a "volume" component. Two rules are
applied in order to exclude unlikely price movements. The first is that, given the general level of inflation, the price of
a product should not be very different from its level a year ago. Any variation of five or more points is regarded as
suspect. The second - more restrictive - rule is that the variation in the price of a product in relation to the most recent
month for which data are available should not be very different from the average price variation for similar products.
Applying these rules prevents extreme variations due to factors that are unconnected with prices and would otherwise
distort the unit value index. For products whose unit values are rejected, the variations are taken to be the same as
those for similar products.
4. Classification used
The United Nations Standard International Trade Classification (SITC), revised for the third time in 1988, was drawn
up on the basis of the Harmonized Commodity Description and Coding System (HS). Using tables of correspondence
between the various classifications (Nimexe, Combined Nomenclature and SITC), Eurostat has been able to publish
an uninterrupted time series of external trade indices from 1979 to the present.
From 1994 onwards, external trade publications will give indices calculated from 1989 on the basis of the following
SITC Rev. 3 aggregates:
TOTAL: all commodities;
0+1 : foods, beverages and tobacco;
2+4: crude materials, except fuels;
3: fuels
5+6+7+8: manufactured goods.
By compiling other correspondence tables, Eurostat is able to supply complete time series based on other
classifications.
5. Types of indices and rebasing
Eurostat calculates Fisher's "ideal" annual chain indices. Since the "basket of goods" marketed at international level
varies rapidly over time, the annual chain permits the updating of the index weightings. Each month the changes in
unit values in the product groups at detailed level are weighted in order to obtain the changes in unit values in the
various major product categories. Since these changes are based on the previous year, a chain of unit values is
obtained. The corresponding volume index chain is the ratio of the unit value variation to the variation in value for the
month in question compared with the monthly average for the previous year. The indices published each month are
calculated by multiplying the above-mentioned chains by the annual indices for the previous year, a fixed reference
period having been chosen (at present 1990). The annual unit value chains are obtained by weighting the monthly
chains by the volumes, while the annual volume chains are calculated by dividing the annual value variations by the
unit value chains.
6. General comments
Only data on normal trade (statistical procedure 1 ) are used to calculate the unit value indices; however, data on
total trade (covering all the statistical procedures) are used to calculate the value indices from which the volume
indices are obtained.
- The unit value indices are calculated on the basis of values expressed in ecus.
- For any further information on the methods used to calculate the indices, please refer to Eurostat's specialised
publications.
Symbols and abbreviations used
EUR 12: Total of the EC member States
UEBL: Belgo-Luxembourg Economic Union (BLEU)
DK: Denmark
D: Federal Republic of Germany
GR: Greece
E: Spain
F: France
IRL: Ireland
I: Italy
NL: Netherlands
P: Portugal
UK: United Kingdom
USA: United States of America
0: Data less than half the unit used
Mio: Million
Mrd: 1000 millions
ECU: European currency unit
Eurostat: Statistical Office of the European Communities
SITC: Standard International Trade Classification
Data sources
Community
B: Belgique / Luxembourg
DK: Danmark
D: Deutschland
GR: Ελλάδα
E:
España
F:
France
IRL:
Ireland
I:
Italia
NL:
Nederland
Ρ:
Portugal
UK:
United Kingdom
Institut national de statistiques, Bruxelles
Danmarks Statistik, København
Statistisches Bundesamt, Wiesbaden
Εθνική Στατιστική Υπηρεσία Ελλάδας, Αθήνα
Dirección General de Aduanas e Impuestos Especiales, Madrid
Direction générale des douanes et droits indirects, Paris
Central Statistics Office, Dublin
Istituto centrale di statistica, Roma
Centraal Bureau voor de statistiek, Heerlen
Instituto Nacional de Estatistica, Lisboa
HM Customs and Excise, Statistical Office, Southend-on-Sea
Other countries
International Monetary Fund, Direction of Trade
Commentary and graphs
The commentary refers to the state of the CRONOS database on 02.02.1994
TREND database on 02.02.1994
Available data in this issue
April !993
May 1993
June 1993
July 1993
EUR 12
X
X
X
X
UEBL
X
X
X
X
DK
X
X
X
X
D
X
X
X
X
GR
Χ
Χ
Χ
Χ
Ε
Χ
Χ
χ
χ
F
X
χ
χ
χ
IRL
X
Χ
Χ
Χ
Ι
Χ
χ
χ
χ
NL
X
χ
χ
χ
Ρ
χ
χ
χ
χ
υκ
χ
χ
χ
Seasonal Adjustments: Results
Following a period of relative stability from
mid-1991, the seasonally adjusted
European Community exports to the rest of
the world have risen steadily in 1993 (an
increase of 7 % during the first seven
months, compared to the same period in
1992). Despite this trend, the exports for July
1993 were down by 1.2 % on June's figures.
Although the figures for the seasonally
adjusted importation of goods to the
European Community from the rest of the
world have risen slightly during the last two
months (+0.5 % in June and +0.1 % in July)
the figures for the year-to-date indicate a
gradual reduction in imports, reflecting the
economic slowing down in most Member
States. However, this tendency is subject to
significant variations.
The European Community's seasonally
adjusted trade balance has been improving
steadily since early 1992. After a first trade
surplus in May 1993, the balance remained
positive in June (+0.8 billion ECU) and July
(+0.3 billion ECU). This result is mainly
because of increasing exports at the same
time as import levels are falling (-3.1 % for
the first seven months of 1993, compared to
1992).
Exports
Mrd. ECU1 I 1_
Imports
Mrd. ECU1985 1986 1987 1988 1989 1990 1991 1992 1993 1985 1986 1987 1988 1989 1990 1991 1992 1993
Trade Balance
Mrd. ECU1985 1986 1987 1988 1989 1990 1991 1992 1993
Unadjusted Seasonally Adjusted
TABLE OA - EUR 12 EXPORTS, IMPORTS, TRADE BALANCE (1)
Period
Jan-90 Feb-90 Mar-90 Apr-90 May-90 Jun-90 Jul-90 Aug-90 Sep-90 Oct-90 Nov-90 Dec-90 Jan-91 Feb-91 Mar-91 Apr-91 May-91 Jun-91 Jul-91 Aug-91 Sep-91 Oct-91 Nov-91 Dec-91 Jan-92 Feb-92 Mar-92 Apr-92 May-92 Jun-92 Jul-92 Aug-92 Sep-92 Oct-92 Nov-92 Dec-92 Jan-93 Feb-93 Mar-93 Apr-93 May-93 Jun-93 Jul-93
Seasonally Adjusted Series (2)
-Exporte
Not Adjusted
34,1 33,6 37,7 33,3 35,6 35,1 35,5 31,4 31,2 38,8 36,9 35,4 32,6 31,6 34,4 34,5 34,4 34,6 38,6 32,1 34,3 40,0 37,5 38,4 32,7 34,2 38,3 37,0 34,0 35,9 39,4 30,1 35,7 39,8 36,6 40,8 31,1 35,1 40,4 38,7 37,6 42,4 41,9
Seasonally Adjusted 37,2 36,0 35,7 34,9 35,4 34,8 33,9 34,6 33,0 35,2 35,1 34,0 34,9 33,9 34,2 34,2 34,5
343
36,2 36,5 35,8 35,5 36,9 35,7 35,6 36,3 36,2 37,1 35,8 34,7 36,5 35,4 35,9 36,6 35,9 36,8 35,8 37,8 37,8 38,8 40,0 40,1 39,6
■ Mrd. ECU
Imports Not Adjusted
39,6 35,6 40,2 37,1 39,4 37,8 36,8 35,2 36,6 43,9 41,9 36,0 43,0 37,3 39,2 43,3 42,2 40,4 43,9 37,0 41,6 44,5 42,2 38,3 41,4 39,8 44,0 42,5 40,0 40,6 42,0 33,3 39,8 41,4 39,4 40,5 36,3 39,6 43,4 40,8 37,8 41,1 39,8
Seasonally
Adjusted 38,6 37,7 38,1 37,8 37,7 37,7 36,5 38,8 38,1 40,1 40,3 38,9 41,8 39,5 39,1 40,8 41,0 41,5 42,2 41,8 42,6 40,4 41,6 40,1 41,0 41,4 41,2 41,3 40,9 39,2 40,6 39,0 38,6 39,4 39,4 41,1 38,3 41,5 39,4 39,8 39,1 39,3 39,3Trade Balance
Not Adjusted
-5,5 -2.0 -2,5 -3,8 -3,8 -2,7 -1,3 -3,8 -5,3 -5,2 -5,0 -0,6 -10,4 -5,7 -4,9 -8,8 -7,9 -5,7 -5,3 -4,9 -7,3 -4,4 -4,7
0,1
-8,6 -5,6 -5,7 -5,4 -6,0 -4,7 -2,6 ■ -3,1 -4,1 -1,6 -2,9
0,4
-5,2 -4,4 -3,0 -2,1 -0,2
1,3
2,1
Seasonally Adjusted -1,4 -1,6 -2,4 -2,8 -2,3 -2,9 -2,6 -4,2 -5,1 -4,9 -5,2
^ , 9
-6,9 -5,6
^ , 9
-6,6 -6,5 -6,7 -6,0 -5,4 -6,8 -5,0^ , 7
^1,4 -5,4 -5,1 -4,9 -4,2 -5,2 -4,5 -4,1 -3,6 -2,7 -2,8 -3,5 -4,3 -2,5 -3,8 -1,6 -1,1
0,8
0,8
0,3
(1) As from October 1990, the territory of the Federal Republic of Germany includes the territory of the former German Democratic Republic, including East Berlin. Community results are drawn up accordingly.
(2) Seasonal Adjustment via X11/ARIMA procedure.
GLOBAL TRENDS IN EXTERNAL TRADE
EXTRACOMMUNITY TRADE: Results for July 1993.
For the first seven months of 1993, the Community's trade deficit was ECU 10.5 billion,
the United States' ECU 62 billion and Japan's surplus close to ECU 60 billion.
From January to July 1993, the
Community
accumula
ted a trade deficit or ECU 10.5 billion, an improvement
of nearly ECU 28 billion on the same period in 1992.
Exports to nonCommunity countries in the period under
review were 5.8% higher than in the first seven months
of 1992, while imports were 4.4% lower.
The United States'
cumulative deficit for the first seven
months of 1993, at ECU 62 billion, was around ECU 22
billion greater than for the same period in 1992. Imports,
up nearly 18% in terms of ecus (9.5% in dollars),
outstripped exports (10.4% in ecu terms and 2.7% in
dollars).
Japan's trade surplus for the first seven months of 1993
was nearly ECU 60 billion, up from ECU 47 billion for the
same period in 1992. Japanese exports between Ja
nuary and July 1983 showed a marked increase on the
same period in 1992: 15.3% in ecu terms or 7.1% in
dollars. Imports rose by 10.3% in ecus and 2.4% in
dollars. In yen terms, exports fell by 1.4% and imports
8.1%.
GR.0B I IMPORTS AND EXPORTS (CIF, FOB)
(BN ECU)
L π π
issa
ρ
π
■ 1
ίο-IQ
fl
uì
2 0
II·
. 1
1
Ι
Α
Ί
i
p.
ψ:
::ί:
91 92 92 93 92 93
01-07 07
EUR12
91 92
2 93 92 93
01-07 07
USA
i Imports
91 92 92 93
014)7
JAPAN
U Exports
92 93
07
1 billion = 1 0
9e c u s
TABLE OB I - TRADE BALANCE, IMPORTS AND EXPORTS (1)
COUNTRIES
EUR-12 United States " Japan
BLEU Denmark Germany Greece Spain France Ireland Italy Netherlands Portugal United Kingdom
EUR-12 United Stales" Japan
BLEU Denmark Germany Greece Spain France Ireland Italy Netherlands Portugal United Kingdom
EUR-12 United States " Japan
BLEU Denmark Germany Greece Spain France Ireland Italy Netherlands Portugal United Kingdom
Memorandum item
1 USDs.„ECU 1 YEN a.-ECU (1) External Trade Statist (2)Bn=1000.000.000 * Estimate.
" C I F component estima : Not available.
1991
-70,5 -68,9 62,8
-7,2
1,2 6,2
-4,4 -12,5 -3,9 -0,2 -6,2 -20,5 -2,8 -20,2
6,8 1,1 3,8
4,7 3,7
15,6 24,1
7,8 6,2 9,9 2,2 6,1
-2,2 -1,9
0,9 9,9
12,7
2,2 0,6 1,7
12,2
6,9 3,4 6,8 0,3 2,5
-4,2 -5,7
2,8
10,4
1992
-52,1 -80,9 82,2
-5,3
2,2 8,5
-4,1 -113
3,1 0,9
-1,6 -20,9 -2,7 -20,4
1993
I
1993
II
1992 01-07
1993 01-07
TRADE BALANCE (Bn ECU) (2)
-12,6 -22,1 24,9
-0,8
0,6 4,1
-0,8 -1,6 -3,3
0,0
-0,3 -3,9 -0,6 -6,0
-0,7 -27,0 24,8
-0,1
0,7 4,3
-1,1 -1,4
2,9 0,3 2,6
-3,2 -0,7 -4,9
-38,1 -39,5 47,0
-4,0
0,7 2,4
-2,4 -7,6
0,7 0,6
-2,6 -11,2 -1,5 -13,1
IMPORTS
-10,5 -61,9 59,5
-0,5
1,7 9,6
-2,4 -3,2
1,3 0,3 4,5
-8,0 -1,4 -12,3
1992
07
-2,6 -8,4
6,3
-0,2
0,1 0,7
-0,3 -0,9
0,9 0,1 0,5
-1,6 -0,2 -1,7
% change o n the corresponding period of the previous year -1,3
4,4
-5,6
-4,6 -2,3 -0,1 -4,1
1,2
-4,5 -9,2 -3,8
3,1 1,7 0,0
-4,8 16,4
5,7
-8,3 -7,0 -6,0 -8,0 -22,6 -3,6 41,3 -7,4 -5,2 -5,6
4,2
-2,7
16,4 11,5
-6,3 -9,0
0,3
17,4 -16,6
-6,7
13,6
-7,7 -2,5 -8,8
4,2
0,1 5,0
-4,8
-2,7 -0,4
0,5
15,4
4,9
-3,6 -10,5
0,5
-2,7 -0,7
3,0
EXPORTS
-4,4 17,9 10,3
-7,1 -7,3 -3,7
5,8
-19,9 -3,9 .30,5 -3,6 -4,3 -7,9
1,3
-4,4 -7,3 -15,2
-7,4 -19,0 -2,0 66,5 -2,9 -14,0 -16,7 -2,6 -7,1 -10,1 -0,4
% change o n the corresponding period of the previous year
2,9 1,7 3,4
2,2 5,1 1,5 2,5 6,5 5,6
13,0
4,0 4,1 5,8
-0,3
1,3 8,5
10,4
12,1
0,8 3,7
-5,4
0,5
-16,5 19,9
4,6 8,9
-6,5
4,7
11,4
9,7
15,1
19,0
5,9 8,9
72,5 16,1
7,7
12,1 16,4 17,2 -12,3 10,0
4,5 3,3 5,8
1,4 5,7 1,5
10,7 11,8
7,6
21,9
7,4 4,9 5,5 3,1
5,8
10,4 15,3
16,5
6,1 4,7
17,4
8,3
-2,3 17,2 11,4 13,7 -9,1
4,0
2,3
-9,8 -6,7
-4,7 -1,5
2,2
21,3 17,6
0,4
17,5
6,0 1,0 9,2
-1,6
% change o n the corresponding period of the previous year
-4,6
1,4
6,1
12,8 es excluding intra flows (Imports CIF, Exports FOB).
ted.
5,2
24,8
-2,9
2,7
7,9
21,5
-16,2 -8,0
1993
07
2,1
-12,8 . 9,8
0,3 0,2 1,2
-0,5 -0,3
1,7 0,1 2,2
-1,0 -0,1 -1,8
-5,3 26,9 21,0
-5,6 -1,3 -7,7
7,6
-22,0 -8,4 51,0 -14,7 -6,5 -11,4 10,9
6,3
18,9 31,6
21,6 12,5 -3,8 -22,8
6,9 6,3
23,0 14,3 16,9 -7,7 12,1
20,4 40,6
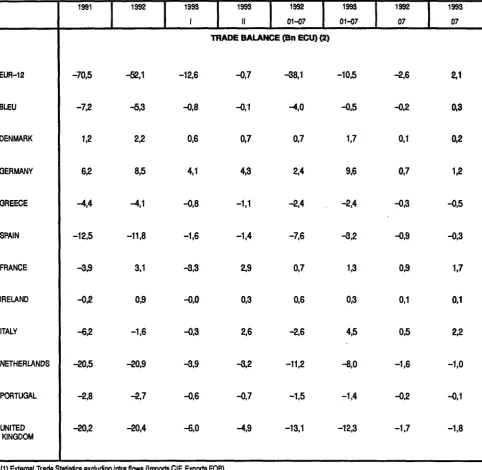
GLOBAL TRENDS IN EXTERNAL TRADE
EXTRACOMMUNITY TRADE OF INDIVIDUAL MEMBER STATES: Results for July 1993.
Germany's cumulative extraCommunity surplus from January to July 1993
amounted to ECU 10 billion .
Most of the Member States' cumulative extraCommu
nity balances over the first seven months of 1993 were
an improvement on the same period in 1992. Germany
recorded a surplus of ECU 9.6 billion, ahead of Italy's
ECU 4.5 billion. Both these countries thus had impro
vements of ECU 7 billion in their foreign trade positions
by comparison with JanuaryJuly 1992. Denmark and
France ran surpluses of ECU 1.7 billion and ECU 1.3
billion, an improvement of ECU 1 billion and ECU 0.6
billion respectively. Ireland's cumulative surplus totalled
ECU 0.3 billion. With a deficit of ECU 0.5 billion, the
BLEU improved its position by ECU 3.5 billion on Janua
ryJuly 1992. Portugal and Greece incurred similar de
ficits to those for the first seven months of 1992, at ECU
1.4 billion and ECU 2.4 billion respectively. Spain and
the Netherlands trimmed their deficits by ECU 4.4 billion
and ECU 3.2 billion, to total ECU 3.2 billion and ECU 8
billion respectively for the first seven months of 1993.
The United Kingdom showed the greatest deficit, at ECU
12.3 billion, despite an improvement of ECU 0.8 billion.
GR.0B II MEMBER STATE'S EXTRATRADE BALANCE
(BN ECU)
1 0
5 J
10
-- 1 5
BL
DK
D
GR
E
EXTRA
F
IRL
I
H
1992 0107
NL
Ρ
UK
□
1993 0107
EUR-12
BLEU
DENMARK
GERMANY
GREECE
SPAIN
FRANCE
IRELAND
ITALY
NETHERLANDS
PORTUGAL
UNITED
KINGDOM
1991
-70,5
-7,2
1,2
6,2
-4,4
-12,5
-3,9
-0,2
-6,2
-20,5
-2,8
[image:19.595.48.531.41.511.2]-20,2
TABLE OB II - EXTRA-EC TRADE BALANCE (1)
1992
-52,1
-5,3
2,2
8,5
-4,1
-11,8
3,1
0,9
-1,6
-50,9
-2,7
-20,4
1993
I
1993
II
1992
01-07
1993
01-07
TRADE BALANCE (Bn ECU) (2)
-12,6
-0,8
0,6
4,1
-0,8
-1,6
-3,3
-0,0
-0,3
-θ,9
-0,6
-6,0
-0,7
-0,1
0,7
4,3
-1,1
-1,4
2,9
0,3
2,6
-3,2
-0,7
-4,9
-38,1
-4,0
0,7
2,4
-2,4
-7,6
0,7
0,6
-2,6
-11,2
-1,5
-13,1
-10,5
-0,5
1,7
9,6
-2,4
-3,2
1,3
0,3
4,5
-8,0
-1,4
-12,3
1992
07
-2,6
-0,2
0,1
0,7
-0,3
-0,9
0,9
0,1
0,5
-1,6
-0,2
-1,7
1993
07
2,1
0,3
0,2
1,2
-0,5
-0,3
1,7
0,1
2,2
-1,0
-0,1
-1,8
(1) External Trade Statistics excluding intra flows (Imports CIF, Exports FOB). (2)Bn=1000.000.000
* Estimate. : Not available.
EXTRA-COMMUNITY TRADE BY PARTNER COUNTRY.
TRADE IN VALUE TERMS: Results for July 1993.
The trade deficit with the industrialised countries fell by ECU 15 billion between January
and July 1993, compared with the same period in 1992, due to a marked decline in imports
from those countries.
Over ECU 15 billion of the improvement in the Commu
nity's trade balance between the first seven-month pe
riods of 1992 and 1993 stemmed from the reduced
deficit with the industrialised countries. Trade with the
United States and Canada from January to July 1993
generated a cumulative deficit of ECU 5 billion, an
improvement of more than ECU 6 billion on the same
period in 1992. The trade deficit with Japan came to
ECU 15 billion, as against ECU 19 billion in January-July
1992. A deficit of ECU 2.2 billion with the EFTA coun
tries represented an improvement of ECU 1.2 billion, and
the surplus of nearly ECU 4 billion in Community trade
with the other countries of Western Europe was ECU 2.3
billion better than for the first seven months of 1992.
The 8.1% drop in imports from the industrialised coun
tries was more marked than for total imports from outside
the Community (-4.4%). Imports from the United States
and Canada were down by 6.9%. Between January and
July 1993 and the same period in 1992 these cost 8%
more in ecu terms due to changes in dollar-ecu rates.
Imports from Japan declined by 12.5%, partly due to the
rise of the yen against the ecu (over 20%). Imports from
the EFTA countries were down nearly 6% between the
first seven months of 1993 and the same period in 1992.
Exports to the industrialised countries rose slightly
(0.8%), with the boost in flows to the United States (5%)
offset by the downturn in goods exported to the EFTA
countries (-4.3%). Exports to Japan showed a modest
improvement (1%).
Trade with the developing countries generated a cu
mulative surplus of ECU 12.4 billion for the first seven
months of 1993, i.e. ECU 9.5 billion more than in Janua
ry-July 1992. The trade surplus with the Mediterranean
countries expanded by ECU 5 billion. Trade with Latin
America and the ACP countries, which had been in
deficit in January-July 1992, showed surpluses for the
corresponding period in 1993, with recoveries of ECU 4
billion and ECU 3 billion respectively. The balance with
the Asian NICs improved by ECU 2.7 billion to reach
ECU 1.7 billion for the first seven months of 1992. The
deficit with the OPEC countries improved by ECU 0.5
billion to a modest ECU 0.2 billion.
Imports from the developing countries in January-July
1983 were down 5.3% on the same period in 1992.
Imports from the OPEC countries fell by 7.4%, although
the cost of the Community's crude oil supplies remained
stable in ecu terms. Imports from the Mediterranean
countries, from Latin America and the ACP countries
slumped (by 10.3%, 15.4% and 27.3% respectively).
Imports from the Asian NICs were roughly on a par with
the first seven months of 1992 (-0.2%).
Exports to the developing countries increased by 5.5%,
buoyed up by rising trade with the Mediterranean coun
tries (10%), Latin America (15.5%) and the Asian NICs
(16.6%), which offset reduced flows to the ACP coun
tries (-0.8%). Exports to the OPEC countries declined
by 5.5% between January-July 1992 and the same
period in 1993.
Community trade with the countries of Central and
Eastern Europe was in surplus by ECU 1.2 billion for
the first seven months of 1993, an improvement of ECU
2 billion on the corresponding period in 1992. Imports
from these countries were up 6.6%, while Community
exports to them soared by 16.1%.
At ECU 4.4 billion in January-July 1993, the trade deficit
with China showed an improvement of ECU 1.6 billion.
Imports from China rose by 15%, but Community exports
to China shot up by 86.6% between January-July 1982
and the same period in 1993.
GR.0C I- EXTRA-BALANCE BY MAIN PARTNER COUNTRY
(BN ECU)
ERA
USA-KANADA
ENTWK. J>
JAPAN
ENTWK.
JAPAN
ENTWK.
USA-KANADA
ΕΠΑ
92 92
01-07 92 07
JAPAN
93
TABLE OC I - EUR-12 TRADE BALANCE AND TRADE FLOWS BY MAIN PARTNERS (1)
EXTRA-EC whose
INDUSTRIALIZED THIRD COUNTRIES
- United States - Canada -Japan
-EFTA
COUNTRIES IN MIDDLE AND EASTERN EUROPE DEVELOPING COUNTRIES (2)
-Asian NICs (3) -OPEC
- Mediterranean Basin -ACP
-Latin America CHINA
EXTRA-EC whose
INDUSTRIALIZED THIRD COUNTRIES
- United States - Canada -Japan
-EFTA
COUNTRIES IN MIDDLE AND EASTERN EUROPE DEVELOPING COUNTRIES (2)
-Asian NICs (3) -OPEC
- Mediterranean Basin -ACP
-Latin America CHINA
EXTRA-EC whose
INDUSTRIALIZED THIRD COUNTRIES
- United States - Canada -Japan
-EFTA
COUNTRIES IN MIDDLE AND EASTERN EUROPE DEVELOPING COUNTRIES (2)
-Asian NICs (3) -OPEC
- Mediterranean Basin -ACP
- Latin America CHINA
1992 STRUC-TURE %
-100,0 59,0 19,6 10,6 22,9 7,5
29,9 6,1 8,8 8,4 3,7 5,0 3,4
100,0 55,1 18,9 4,7 24,7 8,1
35,1 6,3 9,6 10,4 3,9 4,6 1,6
1991
-70,5 -51,1 -21,3 -29,7 -1,9 - 2 , 7
-7,6 -4,8 - 7 , 5 2,4 -3,2 -8,4 -9,4
6,8 6,2 7,6 12,1 2,0 15,1
4,4 15,9 4,2 2,8 -4,9 2,2 41,2
0,9 -3,4 -6,2 - 2 , 5 -2,2 17,2
6,1 10,3 10,9 0,5 -4,3 16,2 5,4
1992
-52,1
-48,0
-13,4
-31,0 -3,9
-1,4
7,1 -2,1 -0,7 4,2 -0,9
-4,5
-9,9
1993 1
1993 II
1992 01-07
1993 01-07
T R A D E BALANCE (Bri ECU)
-12,6 -12,4 -6,0 -6,7 -0,9 0,2
2,3 -0,1 -0,5 2,0 0,5 0,2 -2,4
-0,7 -7,2 -0,3 -6,9 -1,3 1,1 7,2 1,1 0,5 3,7 0,9 0,2 -1,6
-38,1 -34,5 -11,3 -19,1 -3,4 -0,7
2,9 -1,0 -0,7 2,1 -1,3 -3,3 -6,0
IMPORTS
-10,5 -19,1 - 4 3 -15,1 -2,2 1,2
12,4 1,7 -0,2 7,2 1,6 0,7 -4,4
1992 07
-2,6 ^ , 2 0,1 -2,7 -0,8 -0,2
1,7 0,1 0,1 0,4 0,2 -0,2 -0,9
% change o n the corresponding period of the previous year -1,3
-1,9
- « , 0 -0,6
0,8 5,7
-3,1
-2,7 -8,8 -5,4 -6,2 -5,4
12,1
-4,8 -8,6 -6,6 -11,4 -€,6 8,0
-5,2 -2,0 -7,2 -11,6 -28,6 -16,4 11,3
-2,7
-5,9
-7,0
-10,4
-2,3
8,7
-5,1
3,6
-8,7 -7,7
-27,9 -14,2 18,6
0,1 0,1 -3,0 3,1 1,1 1,6
-1,8 -1,6 -6,4 -4,2 -4,1 -5,6 15,0
EXPORTS
-4,4 -8,1 -6,9 -12,5 -5,9 6,6
-5,3 -0,2 -7,4 -10,3 -27,3
-15,4
14,9
-4,4 -5,8 -16,1 -3,0 2,4 10,6
-6,1 -7,1 -13,9 -1,9 -19,9 -8,2 6,4
% change on the corresponding period of the previous year
2,9
- 1 , 0
2,3
-7,4
-1,1 10,4
7,1 7,5 6,9 -1,0 7,0 14,5 22,2
1,3 -4,0 -2,1 -7,4 -5,8 10,2
2,8 10,3 -5,7 1,1 2,2 16,3 58,9
11,4 6,1 13,1 7,7 -1,9 27,8
9,5 23,3 -3,7 17,5 2,0 16,8 104,7
4,5 -0,4 5,5 -7,9 -1,6 11,1
11,4 6,7 12,6 1,1 5,0 22,5 15,6
5,8 0,8 5,0 1,0 ^ , 3 16,1
5,5 16,6 -5,5 9,9 -0,8 15,5 86,6
2,3 -1,6 1,8 -15,4 -1,0 21,6
5,5 0,8 -3,8 -0,3 6,1 16,8 -11,3
1993 07
2,1 0,1 1,4 -1,7 -0,3 -0,1
2,8 0,7 -0,1 1,5 0,2 0,3 -0,6
-5,3 -10,6 -8,5 -17,3 -10,7 -0,8
-2,7 0,4 -2,3 -12,6 -16,4 -13,1 20,5
6,3 3,2 7,9 11,1 -5,8 1,4
5,1 19,9 -6,1 15,2 -13,0 12,9 117,6
(1) External Trade Statistics excluding intra flows (Imports CIF, Exports FOB). Bn = 1000.000.000 (2) Some countries belong to several zones. * Estimate.
(3) Asian NICs include the following countries: Singapore, South Korea, Taiwan and Hong Kong.
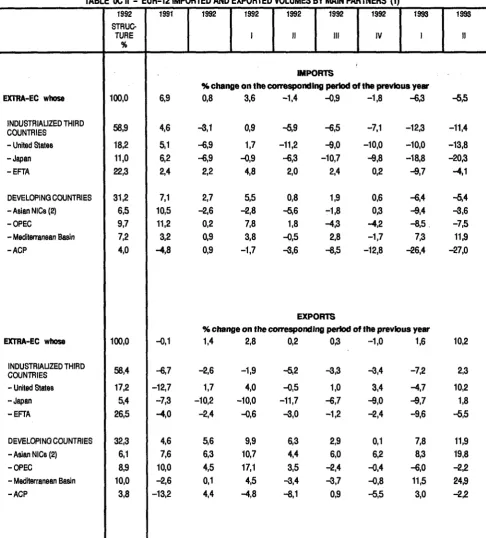
EXTRACOMMUNITY TRADE BY PARTNER COUNTRY.
TRADE IN VOLUME TERMS: Results for the second quarter of 1993.
Imports from the industrialised countries declined by 12% in volume in the first half of the year,
while exports to those countries fell by 7% in the first quarter and then grew by 2% in the second.
Community imports in the first half of 1993 lost 6% by
volume on the first half of 1992, while exports in the first
quarter of 1993 held steady in relation to the same period
in 1992 before climbing by 10% in the second quarter.
Flows from the
industrialised countries
contracted by
nearly 12% between the first halves of 1992 and 1993.
Yearonyear, imports from the United States were down
10% in the first quarter of 1993, and 14% in the second
quarter of 1993. The decline in imports from the EFTA
countries was more modest: 10% in the first quarter of
1993, and 4% in the second. On the other hand,
imports from Japan plummeted by 20% in the first half
of 1993.
Exports to the industrialised countries fell by 7% in the
first quarter and made slight pains between the second
quarters of 1992 and 1993. Flows to Japan showed the
same pattern. Exports to the United States were down
5% in the first quarter of 1993 and up 10% in the second.
Exportsto the EFTA countries snowed a downward
trend in both the first and second quarters of 1993 (10%
and 5% on the corresponding periods in the previous
year).
Imports from the
developing countries
dropped by
nearly 6% between the first halves of 1992 and 1993.
Flows from the Asian NICs were down 10% in the first
quarter and 4% in the second. In volume terms, imports
from the OPEC countries fell by 8% in the first half of
1993, and those from the ACP countries by almost 27%.
Imports from the Mediterranean countries rose by 7% in
the first quarter of 1993 and by 12% in the second.
Exports to the developing countries gained 8% in volume
terms between the first quarters of 1992 and 1993, and
12% between the second quarters, on the strength of
increases of 8% and 20% to the Asian NICs and of 12%
and 25% to the Mediterranean countries. Volumes to
the OPEC countries were down 6% in the first quarter
and 2% in the second. Exports to the ACP countries
rose slightly (3%) in the first quarter and declined (2%)
in the second.
GR. OC II EXTRACOMMUNITY TRADE IN VOLUME BY MEMBER STATES
(% change on the corresponding period of the previous year)
E X T R A E C
mm
] I m p o r t s E x p o r t sINDUSTRIALIZED C O U N T R I E S
D E V E L O P I N G C O U N T R I E S
.
m
-
■
■
m
«8«■
¡¡¡
"
:
m.
-Γ - β
„
'imm
:'::':'/X
::::::::x
Exports
92 11 9 2 III 9 2 IV 93 | 9 3 II
Imports
TABLE OCH - EUR-12 IMPORTED AND EXPORTED VOLUMES BY MAIN PARTNERS (1)
EXTRA-EC whose
INDUSTRIALIZED THIRD COUNTRIES
- United States -Japan -EFTA
DEVELOPING COUNTRIES -Asian NICs (2)
-OPEC
- Mediterranean Basin -ACP
EXTRA-EC whose
INDUSTRIALIZED THIRD COUNTRIES
- United States -Japan -EFTA
DEVELOPING COUNTRIES -Asian NICs (2)
-OPEC
-Mediterranean Basin -ACP
1992
STRUC-TURE
%
100,0
58,9 18,2 11,0 22,3
31,2
6,5
9,7
7,2
4,0
100,0
58,4 17,2
5,4
26,5
32,3
6,1
8,9
10,0
3,8
1991
6,9
4,6
5,1
6,2
2,4
7,1
10,5 11,2
3,2
-4,8
-0,1
-6,7 -12,7 -7,3
-4,0
4,6
7,6
10,0
-2,6
-13,2
1992
1992
1
1992
II
1992
III
IMPORTS
1992
IV
1993
I
%
change on the corresponding period of the previous year
0,8
-3,1
-6,9
-6,9
2,2
2,7
-2,6
0,2
0,9
0,9
3,6
0,9
1,7
-0,9
4,8
5,5
-2,8
7,8
3,8
-1,7
-1,4
-5,9
-11,2
-6,3
2,0
0,8
-5,6
1,8
-0,5
-3,6
-0,9
-6,5
-9,0
-10,7
2,4
1,9
-1,8
-4,3
2,8
-«,5
EXPORTS
-1,8
-7,1
-10,0
-9,8
0,2
0,6
0,3
-4,2
-1,7
-12,8
-€,3
-12,3
-10,0
-18,8
-9,7
-6,4
-9,4
-8,5
7,3
-56,4
% change on the corresponding period of the previous year
1,4
-2,6
1,7
-10,2
-2,4
5,6
6,3
4,5
0,1
4,4
2,8
-1,9
4,0
-10,0
-0,6
9,9
10,7
17,1
4,5
-4,8
0,2
-5,2
-0,5
-11,7
-3,0
6,3
4,4
3,5
-3,4
-8,1
0,3
-3,3
1,0
-€,7
-1,2
2,9
6,0
-2,4
-3,7
0,9
-1,0
-3,4
3,4
-5,0
-2,4
0,1
6,2
-0,4
-0,8
-5,5
1,6
-7,2
-4,7
-^J
-9,6
7,8
8,3
-6,0
11,5
3,0
1993
II
-5,5
-11,4
-13,8
-20,3
-4,1
-5,4
-3,6
-7,5
11,9
-27,0
10,2
2,3
10,2
1,8
-5,5
11,9
19,8
-2,2
243
-2,2
(1) Data Source: TREND. Products of SITC 9 are excluded.
Volume indices of aggregated partner groups may fluctuate because of the Instability of the partner breakdown of trade.
(2) Asian NICs include the following countries: Singapore, South Korea, Taiwan and Hong Kong.
* Estimate.
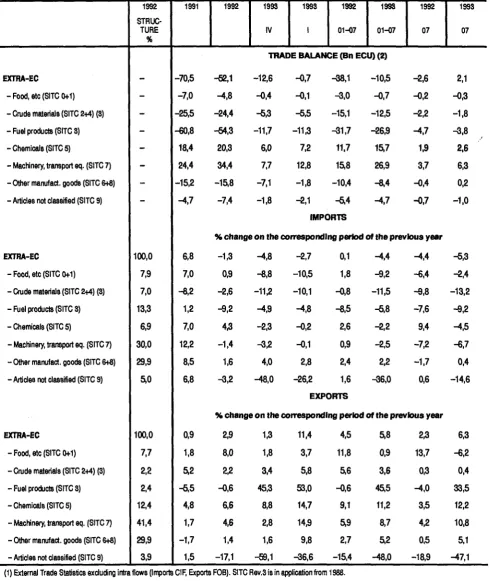
EXTRA-COMMUNITY TRADE BY PRODUCT
TRADE IN VALUE TERMS: Results for July 1993.
Exports of machinery and transport equipment (SITC 7) and chemicals (SITC 5) in the first seven
months of 1993 grew by nearly 10% on the corresponding period of 1992.
The cumulative surplus on trade in
machinery and
transport equipment
(SITC 7) for the first seven
months of 1993 came close to ÉCU 27 billion, an
in-crease of ECU 11 billion on the corresponding period of
1992. The surplus on
chemicals
(SITC 5) rose by ECU
4 billion to ECU 15.7 billion. The reduced deficit in
"other manufactured goods" (SITC 6+8) contributed
ECU 2 billion to the improvement in the Community
balance. The trade deficit in
energy products
(SITC 3J
improved by ECU 4.8 billion to approximately ECU 27
billion. The deficits in crude materials (SITC 2+4) and
food products (SITC 0+1) each grew by around ECU 2.5
billion. In the first seven months of 1993 they amounted
to ECU 12.5 billion and ECU 0.7 billion.
Imports of machinery and transport equipment fell by
2.5% between January-July 1993 and the
correspon-ding period of 1992, while imports of "other
manufactu-red goods" rose by 2.2%. Imports of chemicals declined
by 2.2%. Imported
energy products
were down 5.8%
in cumulative terms over January-July 1992. Imports of
crude materials and food producís showed more marked
declines of 11.5% and 9.2% respectively .
Exports of
machinery and transport equipment
made
strong advances (8.7%), followed by
"other
manufac-turedproducts"
(5.2%). Chemical exports were 11.2%
higher than in the first seven months of 1992.
Commu-nity food exports remained stable (0.9%).
GR.OD I- EXTRA-TRADE BALANCE (PRODUCTS GROUPS)
(BN ECU)
-60
-ίο τ
Prim.goods
-5-Manufactures
Prim.goods
92 93
01-07
92 93
07
TABLE OD I - EUR-12 TRADE BALANCE AND TRADE FLOWS BY BROAD PRODUCT GROUPS (1)
EXTRA-EC
-Food, etc (SITC 0+1) - Crude materials (SITC 2+4) (3) - Fuel products (SITC 3) -Chemicals (SITC 5)
- Machinery, transport eq. (SITC 7) - Other manufact. goods (SITC 6*8) -Articles not classified (SITC 9)
EXTRA-EC
- Food, etc (SITC 0+1) - Crude materials (SITC 2+4) (3) -Fuel products (SITC 3) -Chemical8(SITC5)
- Machinery, transport eq. (SITC 7) -Other manufact. goods (SITC 6+8) - Articles not classified (SITC 9)
EXTRA-EC
-Food, etc (SITC 0+1) - Crude materials (SITC 2+4) (3) - Fuel products (SITC 3) -Chemical8(SITC5)
- Machinery, transport eq. (SITC 7) - Other manufact. goods (SITC 6+8) - Articles not classified (SITC 9)
1992
STRUC-TURE
%
-100,0 7,9 7,0 13,3 6,9 30,0 29,9 5,0
100,0 7,7 2,2 2,4 12,4 41,4 29,9 3,9
1991
-70,5 - 7 , 0 -25,5 -60,8 18,4 24,4 -15,2 -4,7
6,8 7,0 -8,2 1,2 7,0 12,2 8,5 6,8
0,9 1,8 5,2 - 5 , 5 4,8 1,7 -1,7 1,5
1992
-52,1
-4,8
-24,4
-64,3
20,3
34,4
-15,8
-7,4
1993
IV
1993
1
1992
01-07
1993
01-07
TRADE BALANCE (Bn ECU) (2)
-12,6
-0,4
-5,3 -11,7 6,0 7,7 -7,1 -1,8
-0,7 -0,1 -5,5 -11,3 7,2 12,8
-1,8
-2,1
-38,1 -3,0 -15,1 -31,7 11,7 15,8 -10,4 -5,4
IMPORTS
-10,5 -0,7 -12,5 -26,9 15,7 26,9 -8,4 -4,7
1992
07
-2,6 -0,2 -2,2 -4,7 1,9 3,7 -0,4 -0,7
% change o n the corresponding period of the previous year
-1,3
0,9
-2,6
-3,2
4,3
-1,4
1,6
-3,2
-4,8 -8,8 -11,2
-43
-2,3 -3,2 4,0 -48,0
-2,7
-10,5 -10,1
-4,8
-0,2
-0,1
2,8 -26,2
0,1 1,8 -0,8 -8,5 2,6 0,9 2,4 1,6
EXPORTS
-4,4 -9,2 -11,5 -5,8 -2,2 -2,5 2,2 -36,0
-4,4 -0,4 -9,8 -7,6 9,4 -7,2 -1,7 0,6
% change on the corresponding period of the previous year
2,9 8,0 2,2 -0,6 6,6 4,6 1,4 -17,1
1,3 1,8 3,4 45,3 8,8 2,8 1,6 -59,1
11,4 3,7 5,8 53,0 14,7 14,9 9,8 -36,6
4,5 11,8 5,6 -0,6 9,1 5,9 2,7 -15,4
5,8 0,9 3,6 45,5 11,2 8,7 5,2 -48,0
2,3 13,7 0,3 ^ , 0 3,5 4,2 0,5 -18,9
1993
07
2,1 -0,3
-1,8
-3,8 2,6 6,3 0,2 -1,0
-5,3 -2,4 -13,2 -0,2 -1,5 -6,7 0,4 -14,6
6,3 -6,2 0,4 33,5 12,2 10,8 5,1 -47,1
(1) External Trade Statistics excluding intra flows (Imports CIF, Exports FOB). SITC Rev.3 is in application from 1988. (2) Bn = 1000.000.000
(3) Petroleum not included. * Estimate.
EXTRACOMMUNITY TRADE BY PRODUCT
TRADE BY VOLUME: Results for the second quarter of 1993.
Imports of machinery and transport equipment (SITC 7) fell by 10% in the first half of 1993,
while exports flagged slightly in the first quarter before gaining 10% in the second.
In the first half of 1993, imports of
machinery and
transport equipment
(SITC 7) fell by nearly 10%. Im
ports of chemicals were down by 9% between the first
quarters of 1992 and 1993 and by 6% between the
second quarters. The volume of "other manufactured
goods" (SITC 6+8) imported more or less held steady at
the level of the first half of 1992. Imports of energy
products (SITC 3) slipped by 9% and 6% in the first and
second quarters of 1993. Imports of crude materials
(SITC 2+4) and of food products (SITC 0+1 ) declined by
nearly 6% between the first halves of 1992 and 1993.
Exports of machinery and transport equipment lost 2%
by volume between the first quarters of 1992 and 1993,
but gained 10% in the second quarter of 1993. Exports
of
chemicals
and
"other manufactured goods"
clim
bed 4% in the first quarter and then 10% in the second
quarter of 1993. Community food exports in the first half
of 1993 were nearly 7% up on the figures for the first half
of 1992.
GR. OD II EXTRACOMMUNITY TRADE IN VOLUME
(% change on the corresponding period of the previous year)
Food.etc...
SITC 0+1
O
:.■ m:
Chemicals
SITC 5
mi
■ : ■ : ■ : ■ : ■ : ■ :
...
92 III 92 IV
Machinery, transport eq.
SITC 7
w
mi
Other manufactured goods
SITC 6+8
■ : ■ ; ■ > : : * :
mm
Exports
3
Imports
TABLE OD II - EUR-12 IMPORTED AND EXPORTED VOLUMES BY BROAD PRODUCT GROUPS (1)
EXTRA-EC
-Food, etc (SITC 0+1) - Crude materials (SITC 2+4) (2) - Fuel products (SITC 3) - Chemicals (SITC 5)
- Machinery, transport eq. (SITC 7) - Other manufact. goods (SITC 6+8)
EXTRA-EC
-Food, etc (SITC 0+1) - Crude materials (SITC 2+4) (2) -Fuel products (SITC 3) -Chemical8(SITC5)
- Machinery, transport eq. (SITC 7) - Other manufact. goods (SITC 6+8)
1992
STRUC-TURE
%
100,0 7,5 7,0 14,4 6,6 29,9 29,3
100,0 7,1 2,1 2,5 11,9 40,4 30,3
1991
6,9 4,0 -2,1 9,9 4,2 7,1 7,9
-0,1 4,8 7,4 ^ , 8 1,9 -0,8 -1,3
1992 1992
I
1992
II
1992
III
IMPORTS
1992
IV
1993
I
% change o n the corresponding period of the previous year
0,8
3,9
2,5
0,4
3,3
- 5 , 0
4,4
3,6 5,2 5,9 1,9 -1,7 2,5 4,0
-1,4
2,0 0,2 1,9
-0,5
-7,1
1,0
-0,9 1,7 -4,5 -1,8 5 0 -6,8 3,7
EXPORTS
-1,8 1,2 -2,9 -3,0 4,0 -9,1 3,8
-6,3 -7,1 -7,3 -7,2 -8,6 -10,5 0,1
% change o n the corresponding period of the previous year
1,4 5,7 5,9 8,1 4,0 -0,1 1,7
2,8 6,1 8,7 10,8 -0,6 0,4 3,8
0,2 9,1 3,2 9,7 -6,0 -1,3 0,3
0,3 10,7 2,9 2,4 -3,7 -2,8 1,2
-1,0 5,7 1,0 7,6 -10,5 -2,5 -1,0
1,6 7,8 10,1 23,0 4,3 -2,1 3,5
1993
II
-6,5 -7,8
-6,1
-4,7
-5,8 -9,2
-1,4
10,2 6,0 9,3 29,8 9,7 9,5 10,8
(1) Data Source: TREND. SITC Rev.3 is in application from 1988. Products of SITC 9 are excluded. (2) Petroleum not included.
* Estimate.