Papers and Proceedings of the Royal Society of Tasmania, Volume 151, 2017 59
AN IRREPLACEABILITY MAP FOR TASMANIAN PRIORITY PLANT SPECIES
by J.B. Kirkpatrick, O.Carter, F. Faulkner, L. Gilfedder and W. Potts(with three text-figures)
Kirkpatrick, J.B., Carter, O., Faulkner, F., Gilfedder, L. & Potts, W. 2017 (6:xii): An irreplaceability map for Tasmanian priority plant species. 151: 59–63. ISSN: 0080–4703. Discipline of Geography and Spatial Sciences, School of Land and Food, University of Tasmania, Private Bag 78, GPO Hobart, Tasmania, Australia 7001 (JK*, LG): Department of Primary Industry, Parks, Water and Environment, Hobart, Tasmania, Australia 7000 (OC, FF, WP). *Author for correspondence: Email: [email protected]
There is a strong need to map the relative importance of areas for nature conservation both inside and outside reserves, given increasing development pressures and ongoing threats to biodiversity. Nature conservation importance has typically been established using iterative or optimising systems which select areas to achieve explicit targets. Irreplaceability has been a concept used in many of these analyses. We calculated rarity-weighted richness values (irreplaceability scores) from reliable distributional data for all vascular plant species of conservation importance in one square kilometre grid cells covering the State of Tasmania, Australia. The spatial patterns of scores on the irreplaceability index were not strongly related to data collection intensity. Thus, our scores were reliable for most parts of the State, irrespective of survey effort, except where there were no or little survey data. Irreplaceability scores were high in places with concentrations of local endemics, on mountains with persistent snow cover, along the northern part of the coast and on the Bass Strait islands.
Key Words: irreplaceability, planning, plant species conservation, rarity-weighted richness, Tasmania.
degree to which our results are influenced by collection intensity and how they relate to the areas revealed as important for conservation in previous prioritisation work.
METHODS
We used the Tasmanian Natural Values Atlas (NVA) (www. naturalvaluesatlas.tas.gov.au) to determine the number of recorded native vascular plant species and records of native vascular plant species for each 1 x 1 km grid placed over the terrestrial area of Tasmania, Australia. The NVA is curated and contains indicators of reliability and spatial specificity. We excluded unreliable records and those with a specificity of greater than one kilometre.
Numbers of species and records for native vascular plants listed as threatened under the Tasmanian Threatened Species Protection Act 1995 or Australian Environment Protection and Biodiversity Conservation Act 1999, or that were otherwise uncommon, were also extracted from the NVA. These plant species are termed “priority plant species”.
For each priority species, the number of 1 x 1 km grid cells that it occupied (I) was tallied. The irreplaceability index score for each grid cell was the sum of the inverse of I for all species, the rarity weighted richness of Williams et al. (1996). Thus, in a square containing two priority species, one confined to that square would score 1 (the maximum score) and another, present in 10 squares, would score 0.1. The summed score of these two species would be 1.1. We recognise that the distributional knowledge for our priority species is variable, but most of the score for any cell with high scores will derive from the highly localised species, which are the ones that are best known. Thus, the effect of these variations in knowledge on patterns will be low.
In order to test the effect of observation intensity on scores, Pearson’s product moment correlation coefficient INTRODUCTION
There is an ongoing need to identify conservation priorities, especially in the representativeness of elements of biodiversity in protected areas, but also to guide management decisions within existing reserves and development processes inside and outside reserves. Approaches to determine the relative importance of particular areas of land or sea for biotic conservation have been iterative (Kirkpatrick 1983), optimising (Kirkpatrick et al. 2007) or based on approaches to mathematical optimisation (Williams et al. 2004). The concept of irreplaceability, the degree to which an area cannot be replaced to achieve a target (Pressey et al. 1994), has been central to many of these approaches.
Algorithms incorporating the concept of irreplaceability have been widely used for reserve selection (Williams et al. 1996, Pressey & Taffs 2001, Cawardine et al. 2007, Linke et al. 2008, Cuesta et al. 2017). Irreplaceability measures have also been used to establish limits for offsetting (Bekessy et al. 2010, Brownlie et al. 2012, Gardner et al. 2013, Kiesecker et al. 2009, McKenney & Kiesecker 2010, Pilgrim et al. 2013), and, more recently, as a means of determining relative conservation value independent of tenure (Ma et al. 2016).
The general aim of biotic nature conservation is to maintain the diversity of life. However, the specific spatial targets that might achieve this general goal are difficult to determine. Therefore, there may be considerable virtue in measurement of relative importance for biotic conservation independent of specific spatial targets (Wilhere et al. 2008), despite the risk that poor reservation decisions could be made on the basis of the outcomes of this method alone (Segan et al. 2010).
An irreplaceability map for Tasmanian priority plant species 61
was used to determine whether the irreplaceability index was related to the number of non-priority plant species per grid cell or the number of non-priority plant records per grid cell. Grid cells with zero records of non-priority species were excluded from these correlation analyses. In order to gain an indication of the robustness of rarity weighted richness as an indicator of conservation importance, we compared the output of our index to the results of a past iterative approach. We used a Spearman’s rank correlation coefficient on ranked cells scored using our irreplaceability index against the ranks of the places selected iteratively for representation of unreserved dicotyledonous plants in Kirkpatrick et al. (1991). Cells that were not selected in the 1991 paper were not included in the irreplaceability score column.
RESULTS
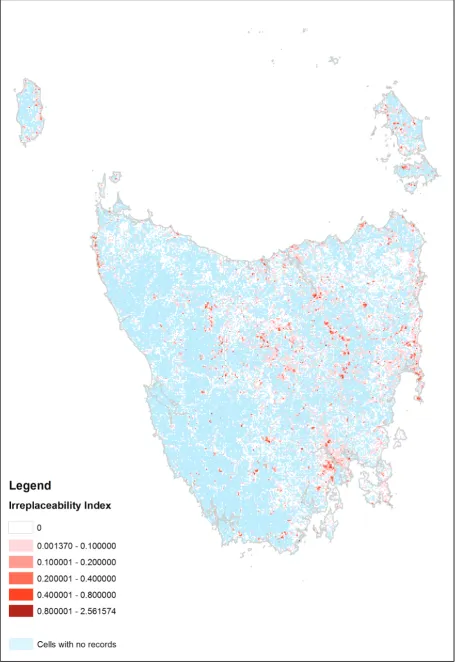
High irreplaceability index values were scattered, with occasional lineations and aggregations (fig. 1). There were high value grid cells in each of the centres of local endemism for plant species: the Asbestos Range, which contains many ultramafic endemics, the southern Midlands, containing semiarid country endemics, the eastern Central Plateau, containing alpine/subalpine endemics, the central east coast, containing dry forest endemics, the Tasman Peninsula, containing exposed headland endemics, the Hobart area, with endemics in a wide variety of environments, and the far south of southwest Tasmania with its alpine/subalpine endemics (Kirkpatrick & Brown 1984, Kirkpatrick 1999). There were sporadic high values in the northern Midlands, along the northern coasts and on the Bass Strait islands. These were concentrations of species whose distribution included mainland Australia, but extended to northern Tasmania. The places in Tasmania with the most persistent snow cover, including Ben Lomond, Mount Field, Mt Anne, Frenchmans Cap and the Du Cane Range, had high irreplaceability values, largely attributable to species that are restricted to habitats with persistent snow, but which are more common in mainland Australia or New Zealand, where there are more extensive areas with persistent snow (Kirkpatrick 1997, Parry et al. 2016).
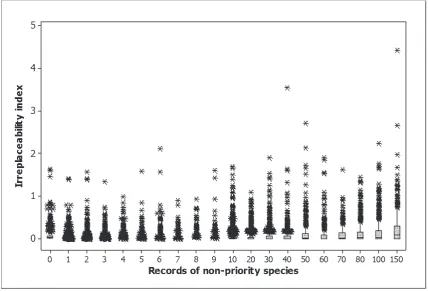
Collection intensity had little effect on irreplaceability scores. Significant (P < 0.001) correlations between the index, species, and records, were found, but had an extremely low level of explanation (r2 = 9.7% for species and
3.8% for records). Grid squares with high irreplaceability scores had few or many records of non-priority species, and few or many non-priority species (figs 2 and 3).
The rank order of plant irreplaceability scores was weakly positively related to the order of selection of places for unreserved plant species by Kirkpatrick et al. (1991) (r = 0.291, df = 68, P = 0.015).
DISCUSSION
Our test of the relationship between the iterative ranking of areas for unreserved dicotyledonous plants in 1991 and ranking of our irreplaceability scores was biased against a positive result by the inclusion of reserved species, monocotyledonous plants and pteridophytes in the latter data set and the quarter century available to accumulate further records. The positive correlation reflects the robustness of both techniques in determining relative value.
Although the magnitudes of irreplaceability scores reflect priorities derived from methods designed to approach or achieve optimisation in relation to targets, target-based approaches to optimisation will be more efficient in selecting reserves (Albuquerque & Beier 2015). With irreplaceability scores, there is no certainty of the value that will include all target species at a defined target level. Nevertheless, irreplaceability scores should give a strong indication of prospective localities for reserves, and be more stable in their patterns than optimisation selections, which shift when reservation is achieved to target for some of the elements targeted. The latter consideration is particularly important when determining whether there would be problems with impacts on priority species as a result of proposed developments within existing reserves.
Our irreplaceability index is designed to provide a first indication of conservation significance for vascular plants in development assessments and environmental management plans. A layer, Distinctiveness of Areas of Threatened and Uncommon Plants, derived from our approach is available for such conservation planning on the Department of Primary Industries, Parks, Water & Environment’s Conservation Information System (www. dpipwe.tas.gov.au/cis).
Although strong patterns are evident in figure 1, users of the output spatial layer should not rely on low irreplaceability index scores, especially where the number of records of all vascular plant species is zero to low, because low values are highly likely to indicate lack of survey effort. The linear patterning of high value cells in some parts of the State (fig. 1) indicates sampling along roadsides, but not in adjacent country, rather than the reality on the ground. The cells with a value of zero are those with very few records overall (fig. 3), and for most cells there are no records at all (fig. 1).
It may be possible to remotely estimate the irreplaceability index from environmental and land use surfaces, using methods such as the deep cognitive imaging systems applied to predict fire incidence from climate data (Dutta et al. 2013). However, any such predictions should be validated by field checking for any development assessments.
FIG. 2. — Box plots showing the relationship between the irreplaceability index and the number of non-priority species in 1 x 1 km grid squares. One quarter of the values in any class are shown as a vertical line and asterisks representing individual 1 x 1 km grid cells. 10 = 10–14, 15 = 15–19, 20 = 20–24, 25 = 25–29, 30 = 30–39, 40 = 40–49, 50 = 50–59, 60 = 60–79, 80 = 80–99, 100 = 100–119, 120 = > 119.
[image:4.595.75.504.416.707.2]An irreplaceability map for Tasmanian priority plant species 63
on elements of nature, and at any scale. The approach is independent of any target, rather than responding to proportionate representation.
ACKNOWLEDGEMENTS
We thank the Department of Primary Industries, Parks, Water & Environment for the use of plant species records from the Natural Values Atlas.
REFERENCES
Albuquerque, F. & Beier, P. 2015: Rarity-weighted richness: a simple and reliable alternative to integer programming and heuristic algorithms for minimum set and maximum coverage problems. Conservation Planning. DOI: 10.1371/ journal.pone.0119905.
Bekessy, S.A., Wintle, B.A., Lindenmayer, D.B., McCarthy, M.A., Colyvan, M., Burgman, M.A. & Possingham, H.P. 2010: The biodiversity bank cannot be a lending bank. Conservation Letters 3: 151–158.
Brownlie, S., King, N. & Treweek, J. 2012: Biodiversity tradeoffs and offsets in impact assessment and decision making: can we stop the loss? Impact Assessment and Project Appraisal 31: 24–33.
Cawardine, J., Rochester, W., Richardson, K., Williams, K., Pressey, R. & Possingham, H. 2007: Conservation planning with irreplaceability: does the method matter. Biodiversity Conservation 16: 245–258.
Cuesta, F., Peralvo, M., Merino-Viteri, A., Bustamante, M., Baquero, F., Freile, J.F., Muriel, P. & Carvajal, O.T. 2017: Priority areas for biodiversity conservation in mainland Ecuador, Neotropical Biodiversity 3: 93–106.
Dutta, R., Aryal, J., Das, A. & Kirkpatrick, J.B. 2013: Deep cognitive imaging systems enable estimation of continental-scale fire incidence from climate data. Scientific Reports 3: 3188; DOI:10.1038/srep03188.
Gardner, T.A., von Hase, A., Brownlie, S., Ekstrom, J.M.M., Pilgrim, J.D., Savy, C.E., Stephens, R.T., Treweek, J.O., Ussher, G.T., Ward, G. & Ten Kate, K. 2013: Biodiversity offsets and the challenge of achieving no net loss. Conservation Biology 27: 1254–1264.
Kiesecker, J.M., Copeland, H., Pocewicz, A. & McKenney, B. 2009: Development by design: blending landscape-level planning with the mitigation hierarchy. Frontiers in Ecology and the Environment 8: 261–266.
Kirkpatrick, J.B. 1983: An iterative method for establishing priorities for the selection of Nature Reserves: an example from Tasmania. Biological Conservation 25: 127–134. Kirkpatrick, J.B. 1997: Alpine Tasmania. Oxford University Press,
Melbourne: 196 pp.
Kirkpatrick, J.B. 1999: A continent transformed. 2nd Edn Oxford University Press, Sydney: 140 pp.
Kirkpatrick, J.B. & Brown, M.J. 1984: The palaeogeographic significance of local endemism in Tasmanian higher plants.
Search 15: 112–113.
Kirkpatrick, J.B., Gilfedder, L., Duncan, F. & Harris, S. 1991: Reservation status and priorities for Tasmanian plants. I. Angiospermae (Dicotyledonae). In: Banks, M.R., Smith, S.J., Orchard, A.E. & Kantvilas, G. (eds) Aspects of Tasmanian botany: a tribute to Winifred Curtis. Royal Society of Tasmania, Hobart: 163–172.
Kirkpatrick, J.B., Jensen, A. & Bridle, K.L. 2007: The future of the run country. In: Kirkpatrick, J.B. & Bridle, K.L. (eds) People, Sheep and Nature Conservation: the Tasmanian Experience. CSIRO Publishing, Collingwood: 183–208. Linke, S., Norris, R.H., & Pressey, R.L. 2008: Irreplaceability
of river networks: towards catchment-based conservation planning. Journal of Applied Ecology 45: 1486–1495. Ma, L., Sun, B.Q., Qu, Y. & Li, J.Q. 2016: Applying systematic
conservation planning to constitute a protection strategy for broad-leaved Korean pine forests in the Changbai Mountains, China. Journal of Mountain Science 13: 493–507.
McKenney, B.A. & Kiesecker, J.M. 2010: Policy development for biodiversity offsets: a review of offset frameworks. Environmental Management 45: 165–176.
Parry, J., Kirkpatrick, J.B. & Marsden-Smedley, J. 2016: Explaining the distribution, structure and species composition of snow patch vegetation in Tasmania, Australia. Australian Journal of Botany 64: 484–491. Pilgrim, J.D., Brownlie, S., Ekstrom, J.M.M., Gardner, T. A.,
von Hase, A., Kate, K., Savy, C.E., Stephens, R.T.T., Temple, H.J., Treweek, J., Ussher, G.T. & Ward, G. 2013: A process for assessing the offsetability of biodiversity impacts. Conservation Letters 6: 376–384.
Pressey, R.L., Johnson, I.R. & Wilson, P.D. 1994: Shades of irreplaceability: towards a measure of the contribution of sites to a reservation goal. Biodiversity and Conservation 3: 242–262.
Pressey, R.L. & Taffs, K.H. 2001: Scheduling conservation action in production landscapes: priority areas in western New South Wales defined by irreplaceability and vulnerability to vegetation loss. Biological Conservation 100: 355–376. Segan, D.B., Carwardine, J., Klein, C., Grantham, H. &
Pressey, R. L. 2010: Letter to the editor: can we determine conservation priorities without clear objectives? Biological Conservation 143: 2–4.
Wilhere, G.F., Goering, M. & Wang, H. 2008: Average optimacity: an index to guide site prioritization for biodiversity conservation. Biological Conservation 141: 770–781. Williams, J.C., ReVelle, C.S. & Levin, S.A. 2004: Using
mathematical optimization models to design nature reserves. Frontiers in Ecology and Environment 2: 98–105. Williams, P., Gibbons, D., Margules, C., Rebelo, A., Humphries, C. & Pressey, R.L. 1996: A comparison of richness hotspots, rarity hotspots and complementary areas for conserving diversity using British birds. Conservation Biology 10: 155–174.