Bulletin of the American Meteorological Society
EARLY ONLINE RELEASE
This is a preliminary PDF of the author-produced
manuscript that has been peer-reviewed and
accepted for publication. Since it is being posted
so soon after acceptance, it has not yet been
copyedited, formatted, or processed by AMS
Publications. This preliminary version of the
manuscript may be downloaded, distributed, and
cited, but please be aware that there will be visual
differences and possibly some content differences
between this version and the final published version.
The DOI for this manuscript is doi: 10.1175/BAMS-D-18-0057.1
The final published version of this manuscript will replace the
preliminary version at the above DOI once it is available.
If you would like to cite this EOR in a separate work, please use the following full citation:
Santoso, A., H. Hendon, A. Watkins, S. Power, D. Dommenget, M. England, L. Frankcombe, N. Holbrook, R. Holmes, P. Hope, E. Lim, J. Luo, S. McGregor, S. Neske, H. Nguyen, A. Pepler, H. Rashid, A. Sen Gupta, A. S. Taschetto, G.
Wang, E. Abellán, A. Sullivan, M. Huguenin, F. Gamble, and F. Delage, 2018: Dynamics
AMERICAN
METEOROLOGICAL
SOCIETY
and predictability of the El Niño-Southern Oscillation: An Australian perspective on progress and challenges. Bull. Amer. Meteor. Soc. doi:10.1175/ BAMS-D-18-0057.1, in press.
1
Dynamics and predictability of the El Niño-Southern Oscillation: An Australian 1
perspective on progress and challenges 2
3
Agus Santoso1,2,3, Harry Hendon4, Andrew Watkins4, Scott Power4, Dietmar Dommenget5,6, 4
Matthew England1,2, Leela Frankcombe1,2, Neil Holbrook7,8, Ryan Holmes1,2,9, Pandora 5
Hope4, Eun-Pa Lim4, Jing-Jia Luo4,10, Shayne McGregor5,6, Sonja Neske5,6, Hanh Nguyen4, 6
Acacia Pepler4, Harun Rashid11, Alex Sen Gupta1,2, Andréa S. Taschetto1,2, Guomin Wang4, 7
Esteban Abellán1, Arnold Sullivan11, Maurice Huguenin12, Felicity Gamble4, Francois 8
Delage4 9
1
Climate Change Research Centre and ARC Centre of Excellence for Climate System Science, 10
University of New South Wales, Sydney, Australia 11
2ARC Centre of Excellence for Climate Extremes, University of New South Wales, Sydney, Australia
12
3
Centre for Southern Hemisphere Oceans Research, CSIRO Oceans and Atmosphere, Hobart, 13
Australia 14
4
Australian Bureau of Meteorology, Melbourne, Australia 15
5
School of Earth, Atmosphere, and Environment, and ARC Centre of Excellence for Climate System 16
Science, Monash University, Melbourne, Australia 17
6
ARC Centre of Excellence for Climate Extremes, Monash University, Melbourne, Australia 18
7
Institute for Marine and Antarctic Studies, University of Tasmania, Hobart, Australia 19
8
ARC Centre of Excellence for Climate Extremes, University of Tasmania, Hobart, Australia 20
9
School of Mathematics and Statistics, University of New South Wales, Sydney, Australia 21
10
Collaborative Innovation Center on Forecast and Evaluation of Meteorological Disasters /KLME / 22
ILCEC, Nanjing University of Information Science and Technology, Nanjing, China 23
11CSIRO Oceans and Atmosphere, Aspendale, Australia
24
12Institute for Atmospheric and Climate Science, ETH Zürich, Zürich, Switzerland
25
26
Corresponding author: Agus Santoso ([email protected]) 27
28
For Bulletin of the American Meteorological Society (Essay) 29
30
2
Capsule summary (30 words max.): Many scientific challenges remain that need to be 31
addressed in order to manage risk of future ENSO impacts in countries like Australia that are 32
strongly affected by ENSO event diversity. 33
34
Abstract: 35
El Niño and La Niña, the warm and cold phases of the El Niño Southern Oscillation (ENSO), 36
cause significant year-to-year disruptions in global climate including in the atmosphere, 37
oceans and cryosphere. Australia is one of the countries where its climate, including droughts 38
and flooding rains, is highly sensitive to the temporal and spatial variations of ENSO. The 39
dramatic impacts of ENSO on the environment, society, health, and economies worldwide 40
make the application of reliable ENSO predictions a powerful way to manage risks and 41
resources. An improved understanding of ENSO dynamics in a changing climate has the 42
potential to lead to more accurate and reliable ENSO predictions by facilitating improved 43
forecast systems. This motivated an Australian national workshop on ENSO dynamics and 44
prediction that was held in Sydney, Australia, in November 2017. This workshop followed 45
the aftermath of the 2015/16 extreme El Niño which exhibited different characteristics to 46
previous extreme El Niños and whose early evolution since 2014 was challenging to predict. 47
This essay summarizes the collective workshop perspective on recent progress and challenges 48
in understanding ENSO dynamics and predictability, and improving forecast systems. While 49
this essay discusses key issues from an Australian perspective, many of the same issues are 50
important for other ENSO-affected countries, and for the international ENSO research 51
community. 52
3
1. Motivation 54
1.1. The Australian context 55
ENSO has long been recognized to strongly influence global and regional climate. Australian 56
climate is particularly impacted by ENSO (e.g., McBride and Nicholls 1983; Ropelewski and 57
Halpert 1987; Power et al. 1998). The associated changes in circulation, rainfall and 58
temperatures are strong enough to impact its terrestrial and marine ecosystems (e.g. Nicholls 59
1985, 1991; Norman and Nicholls 1991; Holbrook et al. 2009). Although the impact can vary 60
markedly from decade to decade (Power et al. 1999), bushfires, heatwaves and droughts 61
generally tend to be more severe during El Niño years (e.g., Williams and Karoly 1999; 62
Loughran et al. 2016), while the frequency of tropical cyclones across the north and flooding 63
throughout much of the east tend to be enhanced during La Niña (e.g., Nicholls 1979; Werner 64
and Holbrook 2011; Power and Callaghan 2016). To provide timely information on the 65
likelihood of upcoming disruption of climate, ENSO outlooks have been issued routinely by 66
the Australian Bureau of Meteorology since 2000. 67
The complex dynamics of ENSO manifest in diverse spatial and temporal evolution across 68
events that lead to differing regional impacts (e.g., Power et al.1999; Ashok et al. 2007; 69
Wang and Hendon 2007; Capotondi et al. 2015a). For instance, in Australia, the magnitude 70
of an El Niño event alone does not provide clear guidance on its impacts (Power et al. 2006; 71
Wang and Hendon 2007; Chung and Power 2017). For example, the impact of the 1997/98 72
extreme El Niño was limited to the south-eastern region and Tasmania, but much more severe 73
and widespread drought occurred during the moderate 2002/03 El Niño (Wang and Hendon 74
2007; Taschetto and England 2009; Lim and Hendon 2015), leading to a massive 25% drop 75
4
The 2002/03 event was not only notably weaker in intensity than the 1997/98 extreme event, 77
but also exhibited a characteristically different pattern of sea surface temperature (SST) 78
anomalies. The 1997/98 El Niño had SST anomalies (~+3C) that peaked toward South 79
America while those during 2002/03 event peaked in the central Pacific (~+1C). The 80
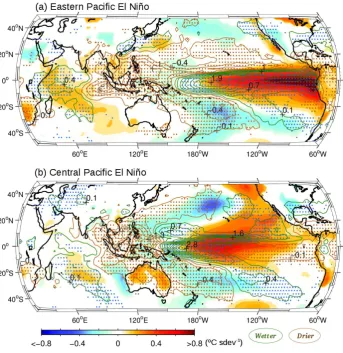
contrast in spatial patterns fits the notion of two archetype structures of ENSO: “Eastern 81
Pacific” (EP) and “Central Pacific” (CP) events (e.g., Ashok et al. 2007; Kao and Yu 2009) 82
following an earlier assessment of ENSO SST patterns by Trenberth and Stepaniak (2001). 83
This is illustrated in Fig. 1 which also shows that an event may not necessarily fall into either 84
category – a pattern that is a mix of EP and CP types is possible as part of the ENSO 85
continuum arising from non-linear dynamics, stochasticity, and remote forcing, which can 86
also give rise to temporal evolution diversity (e.g., Takahashi et al. 2011; Dommenget et al. 87
2013; Lee et al. 2014; Takahashi and Dewitte 2016). This intrinsic ENSO complexity was 88
recently summarized by Timmermann et al. (2018). As such, a clear classification of certain 89
ENSO events into EP and CP can be difficult and be sensitive to the choice of index (e.g., 90
Capotondi et al. 2015a). 91
The typical surface temperature and rainfall anomaly patterns associated with EP and CP 92
ENSO are different over Australia, as well as other regions across the globe (Fig. 2). 93
Specifically, CP events tend to be associated with larger and more widespread rainfall and 94
temperature changes in Australia than EP events – analogous to the difference in impacts 95
between the 2002/03 and 1997/98 events, even though EP El Niños tend to be stronger than 96
CP events (e.g., Capotondi et al. 2015a; Fig. 1). Investigating the cause for the differing 97
impact between EP and CP events is still an open area of research, but based on investigating 98
the difference between 2002/03 and 1997/98 events, the contrast may be due to the forcing 99
center of CP events that is closer to Australia (Wang and Hendon 2007; Lim and Hendon 100
5
tightly linked to the magnitude of La Niña than they are to the magnitude of El Niño (Power 102
et al. 2006), as stronger La Niña events tend to be of a CP type (Fig. 1). As such, predicting 103
the spatial structure of ENSO events is important for impact preparedness over regions like 104
Australia (Hendon et al. 2009). Apart from classification of individual events, other factors 105
such as event precursors, local processes (e.g., antecedent soil moisture, anomalies in 106
regional seas), random disturbances, as well as other modes of climate variability, also matter 107
in determining impacts. 108
The Australian continent extends from the tropics to the mid-latitudes, and is surrounded by 109
warm tropical Indo-Pacific oceans to the north and the Southern Ocean to the south. Thus, it 110
is not only affected by direct tropical impacts of ENSO via the Southern Oscillation but also 111
by extratropical teleconnections due to ENSO-induced changes in tropical convection. 112
Furthermore, Australian climate is affected by a rich interplay between ENSO and other 113
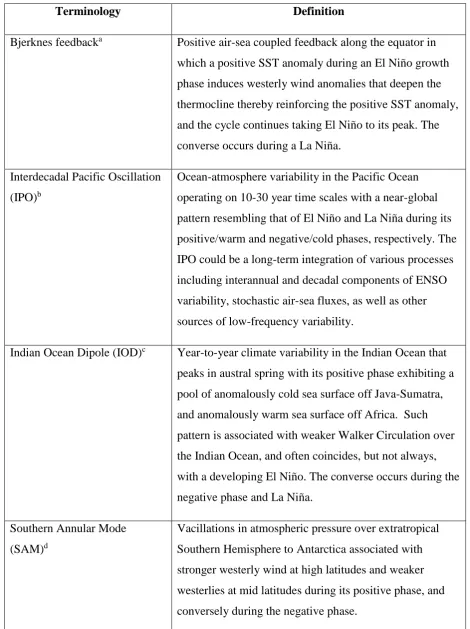
climatic events such as the Indian Ocean Dipole (IOD) and the Southern Annular Mode 114
(SAM) (e.g. Hendon et al. 2007; Meyers et al. 2007; Risbey et al. 2009; Cai et al. 2011; 115
Taschetto et al. 2011; Pui et al. 2012; Lim and Hendon 2015). Ocean surface temperature 116
variations surrounding northern Australia, which tend to covary with ENSO also exert strong 117
influence on Australian climate (e.g., Drosdowsky and Chambers 2001; Hendon et al. 2012; 118
Ummenhofer et al. 2015) and may even affect development of ENSO itself (Nicholls 1984). 119
This complexity of impacts and interactions combined with the uniqueness of every ENSO 120
event poses grand challenges for predicting Australian climate. For example, unlike the 121
extreme 1997/98 event, the extreme 1982/83 El Niño, which is also classified as an EP event, 122
had a particularly strong impact on Australia, likely due to relatively strong cold sea surface 123
anomaly to the north-northeast of Australia (van Rensch et al. 2015). Severe drought gripped 124
6
bushfires in the southeast (Voice and Gauntlett 1984). For these reasons, and given 126
Australia’s susceptibility to future climate change, ENSO is at the forefront of climate 127
research in Australia. 128
1.2. Unexpected turns of events 129
Following the extreme El Niño events in 1982/83 and 1997/98, the most recent major El Niño 130
event occurred in 2015/16 (Blunden and Arndt 2016; Xue and Kumar 2017; L’Heureux et al. 131
2017). This first extreme El Niño of the 21st Century (Santoso et al. 2017) followed a “false 132
alarm” in 2014. In 2014, the equatorial Pacific warm water volume (WWV) increased 133
rapidly during the austral autumn following a strong westerly wind burst (WWB) event, 134
reaching a level not seen since 1997 (McPhaden 2015). Increased WWV and increased 135
activity of WWBs are typical precursors for an El Niño (see Table 1 for WWV and WWB 136
definitions). However, the much anticipated big El Niño did not emerge at the end of 2014 137
(Hannam 2014), but it did instead in 2015. 138
The “roller-coaster” evolution of the 2014-2016 events and their prediction are illustrated in 139
Figure 3, using the ENSO Outlook indicator from the Australian Bureau of Meteorology. The 140
Bureau raised its ENSO Outlook to “watch” in February and March 2014, and subsequently 141
elevated to “alert” in April-July, indicating the increasing possibility of an El Niño (of any 142
magnitude) later in the year. This coincided with a spike in WWV that often precedes El 143
Niño events, in line with the ENSO recharge oscillator theory (Jin 1997). However, the 144
outlook status was downgraded back to “watch” in August-October, and then elevated again 145
to “alert” in November-January. This outlook variation appears to be in line with WWV 146
decline since the previous April before a slight increase again around July. A strong El Niño 147
never materialized, which was later shown to be due to a combination of impeding factors, 148
7
burst (Hu and Fedorov 2016), as well as a mean-state associated with the negative phase of 150
the Interdecadal Pacific Oscillation (IPO) that is less favourable for Bjerknes feedbacks at the 151
root of El Niño growth (Wang and Hendon 2017) and an anomalously warm Indian Ocean 152
surface (Dong and McPhaden 2018) – both factors are associated with stronger Pacific 153
Walker Circulation. The tropical Pacific was nonetheless left anomalously warm, but fell 154
short to being considered an El Niño condition (e.g., Santoso et al. 2017). 155
In early 2015 clear signs of an emerging El Niño were detected, and the outlook status was 156
raised to “event” in May 2015 (Watkins 2015). A strong El Niño developed in the latter half 157
of 2015. The tropical Pacific then cooled, with a borderline La Niña developing in austral 158
summer of 2016-17 declared by some agencies (but not the Bureau) followed by the Bureau’s 159
official declaration of a weak La Niña in December 2017. 160
Amidst the widespread speculation in early 2014 of a strong El Niño that year, the Bureau's 161
coupled model, POAMA (Predictive Ocean Atmosphere Model for Australia), predicted only 162
a weak event when initialized in austral autumn 2014 (Wang and Hendon 2017; see their Fig. 163
3a). In contrast, other models surveyed by the Bureau predicted a strong El Niño for 2014 164
(http://www.bom.gov.au/climate/ahead/archive/models/201405-ms.shtml). On the other
165
hand, while issuing a stronger forecast for El Niño in 2015 than in 2014, POAMA initially 166
underestimated the strength of the 2015/16 El Niño (Fig. 3b of Wang and Hendon 2017; the 167
observed Niño3 falls outside the forecast 5-95% uncertainty range), and was weaker than the 168
other surveyed models, until POAMA was initialized with late austral winter conditions (see 169
the Bureau’s 2015 archive; e.g., 170
http://www.bom.gov.au/climate/ahead/archive/models/201508-ms.shtml). This is not
171
surprising though as predicting the magnitude of ENSO is challenging, more so than 172
8
The challenge in anticipating and predicting the evolution and magnitude of the 2014-2016 174
chain of events, led to much retrospection about the state of our understanding of ENSO 175
dynamics beyond the classical recharge-discharge oscillator theory, as well as the current 176
state of the art climate models used to make predictions. 177
At an international ENSO workshop held in Sydney in 2015, key aspects of ENSO extremes 178
and the associated open questions were discussed (Santoso et al. 2015). However, at that 179
meeting, our knowledge of extreme El Niño was largely based on the 1982/83 and 1997/98 180
events – the only two extreme El Niño events in the modern instrumental record that showed 181
distinct characteristics from other ENSO events. These characteristics include: (i) intense 182
WWB activity in the western/central Pacific during event onset and development phases; (ii) 183
a dramatic eastward and equatorward shift of atmospheric convection as El Niño emerges and 184
matures, thereby inducing unusually high rainfall in the climatologically dry and cold eastern 185
equatorial Pacific; and (iii) prominent eastward propagation of anomalous SSTs along the 186
equatorial Pacific Ocean over event onset to decay phase1. However, the latter two 187
properties, which had previously been thought to typify an extreme El Niño, were less 188
apparent during the 2015/16 El Niño (Santoso et al. 2017). In particular, while the 2015/16 189
El Niño did produce heavy rainfall over the eastern equatorial Pacific with December-190
February average rainfall in the Niño3 region (5°S-5°N, 150°W-90°W) close to 5 mm day-1, a 191
threshold used by Cai et al. (2014) to define an extreme El Niño, it exhibited record breaking 192
rainfall over the Central Pacific, in stark contrast to the relatively weak El Niño-related 193
rainfall in 1982/83 and 1997/98 events (Santoso et al. 2017). 194
1The propagation signature is diagnosed as the time-longitude slope of maximum equatorial
9
The peculiarity of the 2015/16 event, the volatile 2014-2015 ENSO outlook (Fig. 3) and the 195
complex ENSO behaviour and its impacts over Australia (section 1.1), motivated a second 196
workshop on ENSO dynamics and prediction which was held in Sydney, Australia in 197
November 2017 and involved 25 Australian ENSO researchers 198
(www.climatescience.org.au/content/1182-enso-dynamics-workshop). Here we present the
199
outcomes of this workshop, outlining recent research progress, knowledge gaps, impediments 200
and recommendations to further advance ENSO research and prediction systems and service. 201
These issues are discussed within each of five themes outlined in section 2, based largely on 202
the studies presented by the workshop participants as referenced therein. A summary is 203
provided in section 3 along with closing remarks on infrastructures and synergy behind 204
ENSO research in Australia. Definitions of some terminologies discussed in the paper are 205
provided in Table 1. 206
207
2. Discussions 208
2.1. Insights from the 2015/16 El Niño 209
The emergence of the strong 2015/16 El Niño showed that an extreme El Niño does not 210
necessarily exhibit SST anomalies peaking toward the far eastern Pacific as in the 1982/83 211
and 1997/98 events, which have until recently been used as a benchmark for defining an 212
extreme El Niño (see Santoso et al. 2017 for a review). The global climate context for the 213
2015/16 El Niño was different from that for the1982/83 and 1997/98 events (see also 214
Newman et al. 2018). For instance, there was a much more significant and persistent 215
signature of extra-tropical influence in the 2015/16 El Niño, with warm SST anomalies 216
10
Pacific Meridional Mode, than in the 1982/83 and 1997/98 events (Santoso et al. 2017; Paek 218
et al. 2017). 219
Unlike the previous two extremes, the large amplitude of the 2015/16 El Niño was built upon 220
an already abnormally warm tropical Pacific from 2014, rather than relying solely on a 221
vigorous Bjerknes feedback (Abellán et al. 2017). The weak 2014/15 El Niño-like condition 222
prevented a large discharge of warm water out of the equatorial Pacific (Levine and 223
McPhaden 2016) that would normally occur following a strong El Niño. This allowed 224
anomalous equatorial warming to persist into 2015, priming the ocean for the subsequent El 225
Niño. The suite of processes leading up to the 2015/16 El Niño, along with a build-up of 226
ocean heat content in the off-equatorial Western Pacific over the previous decade, may have 227
triggered a shift in the phase of the IPO, from negative before to positive after 2014 (Meehl et 228
al. 2016). This can be invoked to partially explain the difference in amplitude between the 229
2014/15 and 2015/16 events (Wang and Hendon 2017), as a mean state associated with a 230
positive IPO is more conducive to the Bjerknes positive feedbacks for El Niño development 231
in the eastern Pacific (e.g., Zhao et al. 2016) – although the IPO itself is, in turn, partially a 232
long-term imprint of ENSO variability (Power and Colman 2006; Newman et al. 2016). The 233
subsequent decay of the 2015/16 event was also different from the 1982/83 and 1997/98 234
events in that it had persistent warm SST anomalies near the dateline, which lingered right 235
through the austral fall of 2016 and significantly delayed the Bjerknes feedback required for 236
the development of a following La Niña (Lim and Hendon 2017). 237
The distinctive characteristics of the 2015/16 extreme El Niño demonstrate that our 238
observational record is still too short to fully sample the diversity of ENSO characteristics. 239
Furthermore, there are uncertainties in observed SST data prior to the satellite era especially 240
11
homogeneous (e.g., Ishii et al. 2005). This is particularly the case for meteorological 242
variables over the ocean, meaning that comparisons to past events using a single index based 243
on SST, and other variables for that matter, may not be accurate in terms of relative strength 244
or variability. These issues mean that multiple observational products and indices beyond the 245
commonly used ENSO metrics in operational forecast (e.g., Niño3.4, WWV, WWB, 246
Southern Oscillation Index) are required to capture the diversity of ENSO extremes. 247
Refinement of existing indices is also needed to better describe ENSO event diversity (e.g., 248
Sullivan et al. 2016). In addition, the background climate upon which ENSO evolves is 249
changing due to greenhouse warming and internal multi-decadal variability. To detect these 250
long-term changes and the impact on ENSO characteristics, continuous high-quality 251
observations are critical and so are reliable paleo-reconstructions for resolving characteristics 252
of past ENSO events. 253
254
2.2. ENSO predictability 255
According to conventional ENSO theory (e.g., Jin 1997), WWV is a key precursor and hence 256
predictor for ENSO. Consequently, WWV or the associated subsurface information is utilized 257
in initializing forecast models to help alleviate the drop in ENSO prediction skill in austral 258
autumn – widely known as the “(boreal) spring predictability barrier” (Webster and Yang 259
1992). However, anomalous WWV, while necessary, is not the only requirement for 260
development of ENSO events, as demonstrated by the 2014 case. El Niño is typically 261
triggered by a series of WWBs in the western/central Pacific (Vecchi and Harrison 2000). On 262
the other hand, a negative WWV anomaly during austral autumn appears to be a better 263
12
A better understanding of the relationship between WWV, WWB, and ENSO is important in 265
ENSO prediction. 266
On this front, Neske and McGregor (2018) showed that WWBs themselves can create a 267
significant WWV response that can be decomposed into two components: the “adjusted 268
response” (which relies on slow ocean dynamics associated with Rossby wave reflection as 269
depicted by the recharge oscillator theory) and the “instantaneous response” (which 270
represents surface Ekman transport in response to WWB). The adjusted response is identified 271
as the source of predictability and it has weakened since the start of the 21st Century – the 272
reason for this decline remains unclear but may be associated with a shift in the background 273
climate toward the cold phase of the IPO (Zhao et al. 2016) through modulation of governing 274
ENSO processes (e.g., WWBs, WWV, etc.). The instantaneous response, which has increased 275
in prominence in recent decades, emphasizes that ENSO is event-like rather than cyclical. 276
This research highlights that the balance of the two components can vary on decadal time 277
scales, giving rise to decadal modulation of ENSO predictability. 278
ENSO predictability does not lie solely within the tropical Pacific. Climate variability in 279
other oceanic basins also plays a role. Remote climate anomalies induce atmospheric 280
changes that are transmitted into the tropical Pacific through atmospheric planetary waves or 281
changes in the Walker Circulation, thereby affecting ENSO evolution. This remote influence 282
is highlighted by two recent studies that investigated the predictability of recent La Niña 283
events. Using two coupled models, Luo et al. (2017) showed that the Indian and Atlantic 284
Ocean warming contributed to the two-year lead predictability of the 2010-2012 series of La 285
Niña events. The multi-year surface warming in these oceans enhanced the Trade Winds over 286
the central-western Pacific that tend to favour La Niña development. The role of the Indian 287
13
Niña in 2016, although weak, was promoted by earlier than normal development of a record 289
strong negative IOD, which tends to enhance convection over the Indo-Pacific warm pool 290
thereby strengthening the Pacific Trade Winds. They showed that using realistic ocean 291
conditions in the Indian Ocean in late April 2016 was sufficient to produce the strong 292
negative IOD during austral winter and spring and was necessary for delivering an improved 293
La Niña forecast. 294
295
2.3. Response to greenhouse forcing 296
While the Pacific Ocean is projected to warm in the future, and that the anthropogenic 297
warming is already evident in the western part of the basin (Wang et al. 2016), there is still 298
uncertainty around whether ENSO events (typically measured through equatorial Pacific SST 299
anomalies) will change in terms of their spatial patterns, amplitude, and frequency. Climate 300
models produce contrasting projections due to different relative importance of ENSO 301
feedback processes, different patterns of changes in the mean climate, as well as different 302
depictions of decadal variability (e.g., Collins et al. 2010; DiNezio et al. 2012; Kim et al. 303
2014a; Chen et al. 2017). The power spectra of ENSO SST variability also exhibit large 304
discrepancies across models and paleo reconstructions (Hope et al. 2017). However, there is a 305
better inter-model consensus on a general increase in ENSO-driven tropical rainfall in the 306
equatorial central and eastern Pacific in response to global warming, reflecting the consensus 307
for more mean warming in the eastern equatorial Pacific (Power et al. 2013; Chung et al. 308
2014). 309
According to CMIP5 scenario simulations, the projected weakening of the Walker 310
Circulation in the 21st century (e.g., Vecchi et al. 2006; Kociuba and Power 2014) with faster 311
14
atmospheric convection into this usually cold and dry region, resulting in more occurrences 313
of heavy precipitation that characterize an extreme El Niño (Cai et al. 2014). The projection 314
does not arise from the climatological increase in mean rainfall and is robust when using 315
atmospheric vertical velocity (Cai et al. 2017). The associated weakening of the 316
climatological equatorial ocean currents is expected to promote eastward propagating SST 317
anomalies – a characteristic of the 1982/83 and 1997/98 extreme El Niño events (Santoso et 318
al. 2013). On the other hand, increased occurrences of extreme La Niña events characterized 319
by anomalous surface cooling in Central Pacific could also arise due to faster warming of the 320
Maritime Continent and eastern Pacific than the Central Pacific (Cai et al. 2015b). The 321
warming background climate can enhance ENSO teleconnection and thus its impact, even if 322
the SST anomalies themselves do not intensify (Cai et al. 2015a; Power et al. 2018). Even if 323
global warming is kept below 1.5C or 2C, the risk associated with increased extreme El 324
Niño frequency and ENSO-related major rainfall disruptions is likely to persist or even 325
increase (Wang et al. 2017; Power et al. 2017a). In fact, global warming might have already 326
made ENSO events more disruptive (Power et al. 2017a), enhancing ENSO-driven variability 327
in many regions around the world (Bonfils et al. 2015; Power et al. 2018). 328
These projections may be sensitive to model deficiencies in simulating ENSO. As shown by 329
Vijayeta and Dommenget (2017) using the recharge oscillator framework, models tend to 330
underestimate ENSO feedback processes. Realistic simulation of ENSO behavior may stem 331
from error-compensation rather than from correct simulation of the governing feedback 332
processes. Confidence in projections is also reduced by the inability of climate models to 333
capture decadal 'La Niña-like' trends as strong as those observed in the Pacific in recent 334
decades (e.g., Kociuba and Power 2014; England et al. 2014), and a tendency to overestimate 335
Pacific warming over the past 50 years (Power et al. 2017b). Possible reasons include model 336
15
in the upper ocean thermal stratification (Kohyama et al. 2017), as well as biases in the inter-338
basin warming contrast across the three oceans and in the SST-cloud forcing feedback (Luo 339
et al. 2018). To reduce uncertainty in ENSO future projections, it is clear that much work 340
needs to be done to improve climate models. 341
342
2.4. ENSO modelling 343
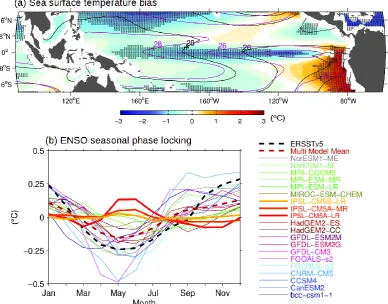
Poor simulation of ENSO is often linked to the persistent 'cold-tongue' bias in which the cold 344
upwelled water in the eastern equatorial Pacific extends too far west toward the Maritime 345
Continent (Fig. 4a). A "double Intertropical Convergence Zone (ITCZ)" is also associated 346
with this cold tongue bias. These biases can affect ENSO simulation through 347
misrepresentation of air-sea feedbacks (Kim et al. 2014b; Wengel et al. 2018). Graham et al. 348
(2017) showed that the cold tongue bias leads to a propensity for occurrences of spatially 349
double-peaked ENSO SST anomalies (peaking concurrently in both the eastern and central 350
Pacific), which are not apparent in historical observations. 351
Another important ENSO feature is its synchronisation to the annual cycle, with peak SST 352
anomalies typically occurring during austral summer. However, many models still do not 353
represent this accurately (Fig. 4b). Worse, in some models (such as those highlighted in Fig. 354
4b) the seasonality is completely reversed (Taschetto et al. 2014). A suite of important 355
processes shapes ENSO seasonality and the incorrect seasonality indicates that the underlying 356
ENSO dynamics (e.g., SST-cloud and thermocline feedbacks) in the models are unlikely to 357
be correct (Rashid and Hirst 2016). This, together with the bias in anomaly patterns, has 358
ramifications for determining ENSO teleconnections and predicting ENSO impacts on 359
16
How these unrealistic ENSO features affect future projections needs to be carefully 361
considered and investigated through detailed analysis of the underlying coupled feedbacks 362
(e.g., Guilyardi et al. 2016; Capotondi et al. 2015b), which are also dependent upon the mean 363
state. As an example, Rashid et al. (2016) found that the strengths of the zonal wind stress 364
forcing and wind-convection coupling simulated by the CMIP5 models largely determine 365
whether the ENSO amplitude will increase or decrease under global warming in those 366
models. Importantly, improvement of the model’s mean state is critical. For instance, by 367
taking into account the effect of ocean currents on the momentum transfer to the atmosphere 368
(Pacanowski 1987), Luo et al. (2005) found a notable reduction in the cold tongue bias in 369
their climate model. 370
The equatorial Pacific cold tongue is also affected by small-scale oceanic processes such as 371
tropical instability waves (TIWs). TIWs are not well resolved by current state-of-the-art 372
climate models which are still run at relatively coarse ocean resolution. TIWs heat the Pacific 373
cold tongue at a rate comparable to atmospheric heating (up to 1C/month; e.g., Menkes et al. 374
2006) and can potentially be an important nonlinear negative feedback on ENSO (An and Jin 375
2004). Research into TIWs influence on ENSO is still limited. Holmes et al. (2018) address 376
how TIWs modify the response of the Central and Eastern Pacific to WWBs, providing a first 377
estimate of TIWs contribution to ENSO irregularity, with implications for ENSO prediction 378
(also see Ham and Kang 2011). 379
In addition, the Pacific cold tongue is a region of strong atmospheric heat uptake, and 380
vigorous turbulent mixing that transports this heat into the ocean interior. Recent research by 381
Holmes et al. (in preparation) has highlighted the global significance of air-sea fluxes and 382
turbulent mixing in this region for modulating ocean heat uptake. However, the 383
17
improvements are required in order to reduce model biases (e.g., Sasaki et al. 2013; Zhu and 385
Zhang 2018). 386
387
2.5. Low frequency variability 388
ENSO properties vary on decadal and longer time scales (e.g., Holbrook et al. 2014; 389
Wittenberg 2015; Power and Smith 2007) through changes in air-sea feedbacks linked to 390
noise, chaotic dynamics, and slow variations in the mean state (e.g., Wittenberg 2009; 391
Newman et al. 2011; Wittenberg et al. 2014; Zhao et al. 2016). While the mean-state 392
variations are thought to be in part a rectified effect of changes in ENSO (e.g., Power and 393
Colman 2006; Ogata et al. 2013), they also affect the interactions between ENSO and other 394
modes of variability such as the SAM (e.g. Lim et al. 2016), as well as their eventual impact, 395
such as on atmospheric cyclones and anticyclones. It is therefore crucial to understand the 396
processes governing mean-state changes and their impact on ENSO. 397
The impact of mean-state change was highlighted by the 1970s climate shift that saw the 398
Pacific climate system transition into a positive IPO that lasted until the late 1990s. Since 399
then, the issue has been reignited by the recent short-lived slowdown in global surface 400
warming that coincided with a negative IPO phase (approx. 1999-2012). In contrast to the 401
preceding positive IPO, this negative IPO period was marked by a lack of strong El Niño, 402
more frequent Central Pacific El Niños, more prominent La Niñas (e.g., see Fig. 3 of Santoso 403
et al. 2017), and reduced seasonal predictability (Zhao et al. 2016). This change in ENSO 404
characteristics and predictability was attributed by Zhao et al. (2016) to reduction in the 405
strength of the Bjerknes feedback in the central and eastern Pacific as a result of the IPO-406
18
The IPO can be partially explained as the accumulated response to interdecadal variability in 408
ENSO activity (Power et al. 2006; Newman et al. 2016). However, other factors may be 409
involved, and the extent to which the IPO influences ENSO activity requires further study. 410
More research is needed into the processes governing decadal variability, including those 411
during the slowdown period as well as periods of more rapid warming. For instance, the 412
cause for the unprecedented strength of the Pacific Trade Winds during the global warming 413
hiatus period (England et al. 2014) needs to be better understood, including the roles of 414
interbasin warming contrast, radiative forcing, and ENSO rectification onto the mean-state. 415
Modelling studies have shown that these factors can influence the strength of Pacific climate 416
change (e.g., Luo et al. 2018; Kohyama et al. 2017). 417
Recent studies indicate that warming trends in other ocean basins could be the cause for the 418
record strong Pacific trade winds during 1999-2012. In particular, the role of the Atlantic 419
warming trend appears to be important (e.g., McGregor et al. 2014; Luo et al. 2017). Models 420
tend to underestimate the recent Pacific wind acceleration and to have strong climatological 421
biases in the Atlantic Ocean. Indeed, there is an inter-model relationship between these two 422
aspects (Kajtar et al. 2017; McGregor et al. 2018), highlighting the need to account for other 423
basins in studying Pacific decadal variability. 424
In addition, using an eddy-permitting ocean model, Maher et al. (2017) showed that the 425
recent Pacific Trade Wind acceleration can explain heat content trends in the Pacific Ocean, 426
and in the Indian Ocean via the Indonesian Throughflow. They also showed that these heat 427
content anomalies do not entirely dissipate with the abatement of the Pacific winds, leaving 428
residual heat in the ocean. The impact of low-frequency subduction of heat on ENSO 429
processes, particularly over decadal timescales, warrants further investigation. 430
19
3. Summary and closing remarks 432
The following key issues were raised during the workshop: 433
Characteristics of ENSO extremes: The 2015/16 El Niño demonstrated potential 434
diversity in extreme El Niño events than previously realized. It highlights the need 435
for a better understanding of the causes and predictability of extreme ENSO events, 436
supported by high-quality observational data and metrics toward better monitoring, 437
predicting, and analyzing future events. 438
ENSO predictability: There is scope to improve our understanding of ENSO 439
development and ENSO representation in climate models, toward better operational 440
predictive capability. Other than WWV and WWBs, climate variability and trends 441
outside the tropical Pacific are also important factors. Decadal variability and long-442
term changes of these factors have important implications for the decadal 443
predictability of ENSO. 444
Response to greenhouse forcing: There is an indication that extreme ENSO events 445
may become more frequent in a warmer future, and the present global warming may 446
already be great enough to exacerbate the ENSO-induced rainfall disruption in the 447
Pacific. Given existing model biases, there is a need to continually revise these 448
assessments with improved models (e.g., CMIP6). 449
Model bias: Current state-of-the-art climate models still have problems simulating 450
the detailed nuances of ENSO and its seasonality, and these problems may be linked 451
to the persistent cold tongue bias and its broader effects (e.g., double ITCZ bias) as 452
well as biases in other basins that can impact ENSO through atmospheric and oceanic 453
20
Synoptic-scale oceanic processes: Tropical instability waves, which are not well 455
resolved in climate models, are an under-represented source of ocean mixing. Our 456
understanding of ENSO irregularity would benefit from quantifying the relative 457
effects of ocean noise and atmospheric stochasticity. 458
Mechanisms for decadal variability and trends: Further research is needed to 459
clarify the manner in whichthe IPO and other aspects of decadal variability interact 460
with ENSO, and the extent to which the IPO is attributed to red noise associated with 461
ENSO and other factors including external forcing and the role of remote oceanic 462
basins. 463
The key elements of our discussions are summarized in Figure 5 which highlights areas of 464
challenges and the ramifications associated with understanding ENSO dynamics and 465
predictability. While ENSO predictability and the regional impacts can vary across events 466
and decades (e.g., Power et al. 1999; Barnston et al. 2012; Karamperidou et al. 2014; Zhao et 467
al. 2016) and ENSO predictability limit is not yet known (e.g., Newman and Sardeshmukh 468
2017), improved understanding of the interaction of these processes and their depiction in 469
climate models could ultimately improve seasonal forecasts, decadal predictions, and future 470
projections of ENSO. This should also lead to more accurate identification of ENSO 471
impacts, with longer lead times and potential benefits to improved climate risk management. 472
These are especially important for Australia given the pronounced and complex ENSO 473
impacts on its regional climate (section 1), but this should also be applicable to all other 474
ENSO-affected countries. The way forward is to sustain and expand ENSO research through 475
further advances in modelling, observations, theoretical frameworks, forecasts, analysis 476
techniques, and development of new metrics/indices, coordinated across a collaborative 477
21
Such endeavors have been ongoing in Australia and nurtured by various government 479
initiatives, organizations, universities, and industries. Research collaboration and student 480
training across institutions are fostered through, for example, the currently active National 481
Environmental Science Program (www.environment.gov.au/science/nesp), and the Australian 482
Research Council (ARC) Centre of Excellence for Climate Extremes 483
(https://climateextremes.org.au), both of which integrate various ENSO related topics within
484
their overarching research programs. The ARC Centre has extended the collaborative 485
network to include several international institutions. ENSO is a core research element in the 486
recently established Centre for Southern Hemisphere Oceans Research (CSHOR; 487
https://cshor.csiro.au), which is a partnership between the CSIRO and Qingdao National 488
Laboratory for Marine Science and Technology (QNLM), with UNSW and University of 489
Tasmania as partners. 490
Australia has the National Computational Infrastructure (NCI) that provides high-491
performance computing and data intensive services to researchers, supporting model 492
development such as Australia’s national climate model, the Australian Community Climate 493
and Earth System Simulator (ACCESS) that contributes to CMIP and IPCC. The 494
development of ACCESS has involved close international partnerships, particularly with the 495
UK Met Office (UKMO) and the US Geophysical Fluid Dynamics Laboratory (GFDL). 496
The seasonal forecast system that is used to produce ENSO outlook continues to advance at 497
the Bureau, with POAMA to be replaced in 2018 by the seasonal forecast version of 498
ACCESS (ACCESS-S) which is of a higher resolution and better than POAMA in 499
distinguishing between EP and CP El Niño events, particularly at increasing lead times 500
(Hudson et al. 2017). Development and improvement of the Bureau's coupled model 501
22
continue to be strongly supported by various agricultural research and development 503
corporations with matching funding from the Australian Government through the Managing 504
Climate Variability Program (http://managingclimate.gov.au). Some of the key focus of the 505
Bureau’s research directions toward improved seasonal predictions include tackling key 506
model biases that are affecting the simulation and prediction of ENSO diversity, improving 507
data assimilation techniques for more accurate forecast model initialization, extending ENSO 508
prediction lead times, and exploring the potential for multi-year prediction of ENSO. 509
Observing the tropical Pacific for ENSO, of which the TAO/TRITON mooring arrays 510
(www.pmel.noaa.gov/gtmba) have been instrumental, is an integral part of international effort 511
in ocean observations under the auspices of Global Ocean Observing System (GOOS). While 512
not a contributor to TAO/TRITON, Australia is a major contributor to GOOS through 513
deployment of Argo floats operated by the Integrated Marine Observing System (IMOS; 514
imos.org.au). The global array of Argo profiling floats provides real-time data of temperature, 515
salinity, and currents up to 2000-m depth over the global oceans including the tropical 516
Pacific. The Bureau relies on Argo subsurface temperature and salinity data for initializing 517
their seasonal prediction models. 518
Australian ENSO researchers have also actively participated in international initiatives and 519
organizations, such as the World Climate Research Program, TPOS 2020, IPCC, among 520
many others, that in turn foster and enrich ENSO research activities. The future success of 521
ENSO research and prediction in Australia will certainly benefit from sustained cross-522
institutional synergies in a conducive environment of the multi-national network. 523
524
23
The authors thank the Australian Research Council (ARC) Centre of Excellence for Climate 526
System Science and the ARC Centre of Excellence for Climate Extremes for supporting the 527
workshop. The workshop stemmed in part from discussions at a meeting of the National 528
Environmental Science Program (NESP) Earth System and Climate Change Hub Project 2.2 529
science team. Andrew Wittenberg and two anonymous reviewers provided constructive 530
comments and suggestions that improved the manuscript. The writing of this essay is partly 531
supported by NESP, and Centre for Southern Hemisphere Oceans Research (CSHOR), a joint 532
research centre for Southern Hemisphere ocean research between QNLM and CSIRO. 533
534
References 535
Abellán, E., S. McGregor, M. H. England, and A. Santoso, 2017: Distinctive role of ocean 536
advection anomalies in the development of the extreme 2015–16 El Niño, Climate Dynamics. 537
https://doi.org/10.1007/s00382-017-4007-0 538
Ashok, K., S. K. Behera, S. A. Rao, H. Weng, and T. Yamagata, 2007: El Niño Modoki and 539
its possible teleconnection. J. Geophysical Research, 112, C11007. 540
https://doi.org/10.1029/2006JC003798 541
An, S. and F.-F. Jin, 2004: Nonlinearity and Asymmetry of ENSO, J. Climate, 17, 2399-542
2412. 543
Bjerknes, J., 1969: Atmospheric teleconnections from the equatorial Pacific. Mon Wea. Rev., 544
97, 163-172. 545
Bonfils, C.J., B.D. Santer, T.J. Phillips, K. Marvel, L.R. Leung, C. Doutriaux, and A. 546
Capotondi, 2015: Relative Contributions of Mean-State Shifts and ENSO-Driven Variability 547
to Precipitation Changes in a Warming Climate. J. Climate,28, 9997– 548
24
Barnston, A. G., et al., 2012: Skill of Real-Time Seasonal ENSO Model Predictions during 550
2002–11: Is Our Capability Increasing?. Bull. Amer. Meteor. Soc., 93, 631–651, doi: 551
10.1175/BAMS-D-11-00111.1 552
Blunden, J., and D. S. Arndt, Eds., 2016: State of the Climate in 2016. Bull. Amer. Meteor. 553
Soc., 98 (8), Si–S277, doi:10.1175/2017BAMSStateoftheClimate.1. 554
Cai, W., P. van Rensch, T. Cowan, and H.H. Hendon, 2011: Teleconnection Pathways of 555
ENSO and the IOD and the Mechanisms for Impacts on Australian Rainfall. J. 556
Climate,24, 3910–3923, https://doi.org/10.1175/2011JCLI4129.1 557
Cai, W. et al., 2014: Increasing frequency of extreme El Niño events due to greenhouse 558
warming. Nature Climate Change, 4, 111–116, doi:10.1038/nclimate2100 559
Cai, W. et al., 2015a: ENSO and greenhouse warming, Nature Climate Change,5, 849–859, 560
doi:10.1038/nclimate2743 561
Cai, W., et al., 2015b: Increased frequency of extreme La Niña events under greenhouse 562
warming. Nature Climate Change, 5, 132-137, doi:10.1038/nclimate2492 563
Cai, W., G. Wang, A. Santoso, X. Lin, and L. Wu, 2017: Definition of extreme El Niño and 564
its impact on projected increase in extreme El Niño frequency. Geophysical Research Letters, 565
44, 11,184–11,190. https://doi.org/10.1002/2017GL075635 566
Capotondi, A., et al., 2015a: Understanding ENSO diversity. Bull. Amer. Met. Soc., 96, 921-567
938. doi: 10.1175/BAMS-D-13-00117.1 568
Capotondi, A., et al., 2015b: Climate model biases and El Niño Southern Oscillation (ENSO) 569
simulation. U.S. CLIVAR Variations, 13 (1), 21-25. 570
Chen, C., et al., 2017: ENSO in the CMIP5 simulations: Life cycles, diversity, and responses 571
to climate change. J. Climate, 30 (2), 775-801. doi: 10.1175/JCLI-D-15-0901.1 572
Chung, C.T.Y., S. B. Power, J. M. Arblaster, H. A. Rashid and G. L. Roff, 2014: Nonlinear 573
precipitation response to El Niño and global warming in the Indo-Pacific, Climate Dynamics, 574
25
Chung, C.Y.Y., and S. B. Power, 2017: The non-linear impact of El Nino, La Nina and the 576
Southern Oscillation on seasonal and regional Australian precipitation. J. Southern 577
Hemisphere Earth System Sci., 67, 25-45. DOI: 10.22499/3.6701.003. 578
Collins, M. et al., 2010: The impact of global warming on the tropical Pacific Ocean and El 579
Niño, Nature Geoscience,3, 391–397, doi:10.1038/ngeo868. 580
DiNezio, P., et al., 2012: Mean climate controls on the simulated response of ENSO to 581
increasing greenhouse gases. J. Climate, 25, 7399-7420. doi: 10.1175/JCLI-D-11-00494.1 582
Dommenget, D., T. Bayr, and C. Frauen, 2013: Analysis of the non-linearity in the pattern 583
and time evolution of El Niño Southern Oscillation. Climate Dynamics, 40(11-12), 2825– 584
2847. https://doi.org/10.1007/s00382-012-1475-0 585
Dong, L., and M. J. McPhaden, 2018: Unusually warm Indian Ocean sea surface 586
temperatures help to arrest development of El Niño in 2014. Scientific Rep., 8, 2249, doi: 587
10.1038/s41598-018-20294-4 588
Drosdowsky, W. and L.E. Chambers, 2001: Near-Global Sea Surface Temperature 589
Anomalies as Predictors of Australian Seasonal Rainfall. J. Climate,14, 1677–1687, 590
doi:10.1175/1520-0442(2001)014<1677:NACNGS>2.0.CO;2 591
England et al., 2014: Recent intensification of wind-driven circulation in the Pacific and the 592
ongoing warming hiatus, Nature Climate Change, 4, 222–227, doi:10.1038/nclimate2106. 593
Graham, F. S., J. N. Brown, A. T. Wittenberg, S. J. Marsland, and N. J. Holbrook, 2017: 594
Understanding the double peaked El Niño in coupled GCMs. Climate Dynamics, 48, 2045-595
2063, doi:10.1007/s00382-016-3189-1. 596
Guilyardi, E., et al., 2016: Fourth CLIVAR Workshop on the Evaluation of ENSO Processes 597
in Climate Models: ENSO in a Changing Climate. Bull. Amer. Meteor. Soc., 97 (5), 817-820. 598
doi: 10.1175/BAMS-D-15-00287.1 599
Ham, Y.-G., and I.-S. Kang, 2011: Improvement of seasonal forecasts with inclusion of 600
26
Hannam, P., 2014: “Most-watched” El Niño gathers pace in the Pacific. Sydney Morning 602
Herald. http://www.smh.com.au/environment/weather/mostwatched-el-Niño-gathers-pace-in-603
pacific-20140617-zsaw6.html 604
Hendon, H., D. Thompson, and M. Wheeler, 2007: Australian rainfall and surface 605
temperature variations associated with the southern annular mode. J. Climate, 20, 2452– 606
2467. 607
Hendon, H. H., E. Lim, G. Wang, O. Alves and D. Hudson, 2009: Prospects for predicting 608
two flavors of El Nino. Geophys. Res. Lett., 36, L19713, doi:10.1029/2009GL040100. 609
Hendon, H. H., E.-P. Lim, and G. Liu, 2012: The Role of Air–Sea Interaction for Prediction 610
of Australian Summer Monsoon Rainfall. J. Climate,25, 1278–1290, 611
https://doi.org/10.1175/JCLI-D-11-00125.1 612
Henley, B., et al., 2016: A tripole index for the Interdecadal Pacific Oscillation. Climate 613
Dyn., 45, 3077-3090. 614
Holbrook, N. J., J. Li, M. Collins, E. Di Lorenzo, et al., 2014: Decadal climate variability and 615
cross-scale interactions: ICCL 2013 Expert Assessment Workshop. Bulletin of the American
616
Meteorological Society, 95, ES155-ES158. doi: 10.1175/BAMS-D-13-00201.1. 617
Holbrook, N. J., J. Davidson, M. Feng, A. J. Hobday, J. M. Lough, S. McGregor, and J. S. 618
Risbey, 2009: Chapter 4: El Niño – Southern Oscillation. In Report Card of Marine Climate 619
Change for Australia: detailed scientific assessment, Eds. E. S. Poloczanska, A. J. Hobday 620
and A. J. Richardson, NCCARF Publication 05/09, pp.29-51, ISBN 978-1-921609-03-9. 621
Holmes, R. M., S. McGregor, A. Santoso, and M. H. England, 2018: Contribution of Tropical 622
Instability Waves to ENSO Irregularity. Climate Dynamics, https://doi.org/10.1007/s00382-623
018-4217-0 624
Hope, P., B. J. Henley, J. Gergis, et al., 2017: Time-varying spectral characteristics of ENSO 625
over the Last Millennium, Climate Dynamics, 49, 1705. https://doi.org/10.1007/s00382-016-626
27
Huang, B., P. Thorne, V. Banzon, T. Boyer, et al., 2017: Extended reconstructed sea surface 628
temperature version 5 (ERSSTv5): Upgrades, validations, and intercomparisons. Journal of 629
Climate, 30(20), 8179–8205. https://doi.org/10.1175/JCLI-D-16-0836.1 630
Hu, S., and A. V. Fedorov, 2016: Exceptionally strong easterly wind burst stalling El Niño of 631
2014. PNAS, 113(8), 2005–2010. doi:10.1073/pnas.1514182113 632
Hudson, D., et al. 2017: ACCESS-S1: The new Bureau of Meteorology multi-week to 633
seasonal prediction system. J. Southern Hemisphere Earth Systems Science, 67 (3), 132-159. 634
Ishii, M, A. Shouji, S. Sugimoto, and T. Matsumoto, 2005: Objective analyses of sea-surface 635
temperature and marine meteorological variables for the 20th century using ICOADS and the 636
Kobe collection, Int. J. Climatology, 25(7), 865-879. 637
Jin, F.-F., 1997: An equatorial ocean recharge paradigm for ENSO. Part I: Conceptual 638
model. Journal of the Atmospheric Sciences, 54(7), 811–829. https://doi.org/10.1175/1520-639
0469(1997)054%3C0811:AEORPF%3E2.0.CO;2 640
Kajtar, J. B., A. Santoso, S. McGregor, and M. H. England, 2017: Model under-641
representation of decadal Pacific trade wind trends and its link to tropical Atlantic bias. 642
Climate Dynamics, https://doi.org/10.1007/s00382-017-3699-5 643
Kalnay, K., et al., 1996: The NCEP/NCAR 40-year reanalysis project. Bulletin of the 644
American Meteorological Society, 77(3), 437–471. https://doi.org/10.1175/1520-645
0477(1996)077%3C0437:TNYRP%3E2.0.CO;2 646
Kao, H.-Y., and J.-Y. Yu, 2009: Contrasting eastern Pacific and central Pacific types of El 647
Niño. J. Climate, 22, 615–632. 648
Karamperidou, C., et al., 2014: Intrinsic modulation of ENSO predictability viewed through a 649
local Lyapunov lens. Climate Dyn., 42, 253-270. doi: 10.1007/s00382-013-1759-z 650
Kim, S.-T., W. Cai, F.-F. Jin, A. Santoso, L. Wu, E. Guilyardi, S.-I. An, 2014a: Response of 651
El Niño sea surface temperature variability to greenhouse warming. Nature Climate Change, 652
28
Kim, S.-T., W. Cai, F.-F. Jin, and J.-Y. Yu, 2014b: ENSO stability in coupled climate models 654
and its association with mean state. Clim. Dyn., 42, 3313-3321. doi: 10.100/s0382-013-1833-655
6 656
Kohyama, T., D. L. Hartmann, and D. S. Battisti, 2017: La Niña–like mean-state response to 657
global warming and potential oceanic roles. J. Climate,30, 4207–4225, 658
https://doi.org/10.1175/JCLI-D-16-0441.1 659
Lee, S.-K., et al., 2014: Spring persistence, transition and resurgence of El Niño. Geophys. 660
Res. Lett., 41 (23), 8578-8585. doi: 10.1002/2014GL062484 661
Levine, A. F. Z., and McPhaden, M. J., 2016: How the July 2014 easterly wind burst gave the 662
2015–2016 El Niño a head start. Geophysical Research Letters, 43, 6503–6510. 663
https://doi.org/10.1002/2016GL069204 664
L’Heureux, M. L., K. Takahashi, A. B. Watkins, A. G. Barnston, E. J. Becker, et al., 2017: 665
Observing and predicting the 2015/16 El Niño. Bulletin of the American Meteorological 666
Society, 98(7), 1363–1382. https://doi.org/10.1175/BAMS-D-16-0009.1 667
Lim, E.-P. and H. H. Hendon 2015: Understanding the contrast of Australian springtime 668
rainfall of 1997 and 2002 in the frame of two flavors of El Niño J. Climate., 28, 2804-2822 669
Lim, E.-P. and H. Hendon, 2017: Causes and predictability of the negative Indian Ocean 670
Dipole and its impact on La Niña during 2016. Scientific Reports, 7,12619 671
doi:10.1038/s41598-017-12674-z 672
Lim, E.-P., H. H. Hendon, J. M. Arblaster, C. Chung, A. F. Moise, P Hope, G. Young and M. 673
Zhao, 2016: Interaction of the recent 50 year SST trend and La Niña 2010: amplification of 674
the Southern Annular Mode and Australian springtime rainfall. Climate Dynamics, 47, 2273-675
2291. 676
Loughran, T. F., S. E. Perkins-Kirkpatrick, and L. V. Alexander, 2017: Understanding the 677
spatio-temporal influence of climate variability on Australian heatwaves. Int. J. Climatol., 37, 678
29
Lu, L., and D. Hedley, 2004: The impact of the 2002–03 drought on the economy and 680
agricultural employment. Economic Roundup Autumn 2004, The Treasury, Australian 681
Government, 25–44. [Available online at http://www.treasury.gov.au/ 682
documents/817/PDF/roundup_autumn_2004.pdf.] 683
Luo, J.-J., G. Liu, H. Hendon, O. Alves, and T. Yamagata, 2017: Inter-basin sources for two-684
year predictability of the multi-year La Niña event in 2010–2012. Scientific Reports, 7, 2276. 685
http://doi.org/10.1038/s41598-017-01479-9 686
Luo, J.-J., G. Wang, and D. Dommenget, D, 2018: May common model biases reduce 687
CMIP5’s ability to simulate the recent Pacific La Niña-like cooling? Climate Dyn., 50, 1335. 688
https://doi.org/10.1007/s00382-017-3688-8 689
Luo, J., S. Masson, E. Roeckner, G. Madec, and T. Yamagata, 2005: Reducing Climatology 690
Bias in an Ocean–Atmosphere CGCM with Improved Coupling Physics. J. 691
Climate,18, 2344–2360, https://doi.org/10.1175/JCLI3404.1 692
Maher, N., M. H. England, A. Sen Gupta, et al., 2017: Role of Pacific trade winds in driving 693
ocean temperatures during the recent slowdown and projections under a wind trend reversal, 694
Climate Dynamics, https://doi.org/10.1007/s00382-017-3923-3 695
McBride, J. L., and N. Nicholls, 1983: Seasonal relationship between Australian rainfall and 696
Southern Oscillation. Mon. Wea. Rev., 111, 1998-2004. 697
McGregor, S., A. Timmermann, M. F. Stuecker, M. H. England, M. Merrifield, F.-F. Jin, and 698
Y. Chikamoto, 2014: Recent Walker circulation strengthening and Pacific cooling amplified 699
by Atlantic warming, Nature Climate Change, 4, 888–892, doi:10.1038/nclimate2330 700
McGregor, S., M. F. Stuecker, J. B. Kajtar, M. H. England, and M. Collins, 2017: Model 701
tropical Atlantic biases underpin diminished Pacific decadal variability, Nature Climate 702
Change, 8, 493-498, https://doi.org/10.1038/s41558-018-0163-4. 703
McPhaden, M. J., 2015: Playing hide and seek with El Niño. Nature Climate Change, 5(9), 704
30
Meinen, C. S., and M. J. McPhaden, 2000: Observations of warm water volume changes in 706
the equatorial Pacific and their relationship to El Niño and La Niña. J. Climate, 13(30), 707
3551-3559. 708
Menkes, C. et al., 2014: About the role of the westerly wind events in the possible 709
development of an El Niño in 2014. Geophys. Res. Lett., 41, 6476-6483, doi: 710
10.1002/2014GL061186 711
Menkes, C. et al., 2006: A modeling study of the impact of tropical instability waves on the 712
heat budget of the eastern equatorial Pacific. J. Phys. Oceanogr., 36, 847-865. 713
Meyers, G., P. McIntosh, L. Pigot, and M. Pook, 2007: The years of El Niño, La Niña, and 714
interactions with the tropical Indian Ocean. J. Climate, 20, 2872–2880. 715
Neske, S., and S. McGregor, 2018: Understanding the warm water volume precursor of 716
ENSO events and its interdecadal variation. Geophysical Research Letters, 45. 717
https://doi.org/10.1002/2017GL076439 718
Newman, M., S.-I. Shin, and M. A. Alexander, 2011: Natural variation in ENSO flavors. 719
Geophys. Res. Lett., 38, L14705, doi: 10.1029/2011GL047658 720
Newman, M., et al., 2016: The Pacific Decadal Oscillation, Revisited. J. Climate, 29, 4399– 721
4427, https://doi.org/10.1175/JCLI-D-15-0508.1 722
Newman, M., et al., 2018: The extreme 2015/16 El Niño, in the context of historical climate 723
variability and change. [in “Explaining Extreme Events of 2016 from a Climate 724
Perspective”]. Bull. Amer. Meteor. Soc., 99, S16-S20, doi:10.1175/BAMS-D-17-0118.1. 725
Nicholls, N., 1984: The Southern Oscillation and Indonesian Sea Surface Temperature. Mon. 726
Wea. Rev.,112, 42 - 432, doi: 10.1175/15200493(1984)112<0424:TSOAIS>2.0.CO;2 727
Nicholls, N., 1985: Impact of the Southern Oscillation on Australian crops. J. Climatology, 728
5, 553-560. 729
Nicholls, N., 1991: The El Nino/Southern Oscillation and Australian vegetation. Vegetatio, 730
31
Norman, F. I., and N. Nicholls, 1991: The Southern Oscillation and variations in waterfowl 732
abundance in southeastern Australia. Australian J. Ecology, 16, 485-490. 733
Ogata, T., et al., 2013: Interdecadal amplitude modulation of El Niño-Southern Oscillation 734
and its impacts on tropical Pacific decadal variability. J. Climate, 26, 7280-7297. doi: 735
10.1175/JCLI-D-12-00415.1 736
Pacanowski, R., 1987: Effect of equatorial currents on surface stress. J. Phys. 737
Oceanogr., 17, 833–838. 738
Paek, H., J.Y. Yu, and C. Qian, 2017: Why were the 2015/2016 and 1997/1998 extreme El 739
Niños different? Geophysical Research Letters, 44,1848–1856. doi:10.1002/2016GL071515 740
Power, S. B., and I. N. Smith, 2007: Weakening of the Walker Circulation and apparent 741
dominance of El Niño both reach record levels, but has ENSO really changed? Geophys. Res. 742
Lett., 34, L18702, doi:10.1029/2007GL030854. 743
Power, S., Tseitkin, F., Torok, S., Lavery, B., and B. McAvaney, 1998: Australian 744
temperature, Australian rainfall, and the Southern Oscillation, 1910-1996: Coherent 745
variability and recent changes. Aust. Meteorol. Mag., 47, 85-101. 746
Power, S., Folland, C., Colman, A., and V. Mehta, 1999: Inter-decadal modulation of the 747
impact of ENSO on Australia. Climate Dynamics, 15, 319-324. 748
Power, S., F. Delage, C. Chung, G. Kociuba, and K. Keay, 2013: Robust twenty-first-century 749
projections of El Niño and related precipitation variability, Nature, 502, 541–545, 750
doi:10.1038/nature12580 751
Power, S. B., F. P. D. Delage, C. T. Y. Chung, H. Ye, and B. F. Murphy, 2017a: Humans 752
have already increased the risk of major disruptions to Pacific rainfall. Nature 753
Communications, doi: 10.1038/ncomms14368. 754
Power, S., Delage, F., Wang, G. et al., 2017b: Apparent limitations in the ability of CMIP5 755
climate models to simulate recent multi-decadal change in surface temperature: implications 756
for global temperature projections, Climate Dynamics, 49, 53. 757
32
Power, S.B. and J. Callaghan, 2016: Variability in Severe Coastal Flooding, Associated 759
Storms, and Death Tolls in Southeastern Australia since the Mid–Nineteenth Century. J. 760
Appl. Meteor. Climatol.,55, 1139–1149, https://doi.org/10.1175/JAMC-D-15-0146.1 761
Power, S.B., and R. Colman, 2006: Multi-year predictability in a coupled general circulation 762
model. Climate Dynamics, 26, 247-272. 763
Power, S., M. Haylock, R. Colman, and X. Wang, 2006: The predictability of interdecadal 764
changes in ENSO and ENSO teleconnections. J. Climate, 8, 2161-2180. 765
Power, S., and F.P.D. Delage, 2018: El Niño–Southern Oscillation and Associated Climatic 766
Conditions around the World during the Latter Half of the Twenty-First Century. J. Climate, 767
31, 6189-6207, https://doi.org/10.1175/JCLI-D-18-0138.1. 768
Pui, A., A. Sharma, A. Santoso, and S. Westra, 2012: Impact of the El Niño Southern 769
Oscillation, Indian Ocean Dipole, and Southern Annular Mode on daily to sub-daily rainfall 770
characteristics in East Australia. Monthly Weather Review, 140, 1665-1682. 771
Puy, M., J. Vialard, M. Lengaigne, and E. Guilyardi, 2016: Modulation of equatorial Pacific 772
westerly/easterly wind events by the Madden-Julian Oscillation and convectively-coupled 773
Rossby waves. Climate Dyn., 467, 2155-2178. 774
Rashid, H. A., A. C. Hirst and S. Marsland, 2016: An atmospheric mechanism for ENSO 775
amplitude changes under an abrupt quadrupling of CO2 concentration in CMIP5 models. 776
Geophysical Research Letters, 43, 1687–1694, doi:10.1002/2015GL066768. 777
Rashid, H. A., and A. C. Hirst, 2016: Investigating the mechanisms of seasonal ENSO phase 778
locking bias in the ACCESS Coupled Model. Climate Dynamics, 46, 1075–1090. 779
Risbey, J.S., M.J. Pook, P.C. McIntosh, M.C. Wheeler, and H.H. Hendon, 2009: On the 780
Remote Drivers of Rainfall Variability in Australia. Mon. Wea. Rev.,137, 3233– 781
3253,https://doi.org/10.1175/2009MWR2861.1 782
Ropelewski, C.F. and M.S. Halpert, 1987: Global and Regional Scale Precipitation Patterns 783
Associated with the El Niño/Southern Oscillation. Mon. Wea. Rev., 115, 1606– 784