er E du ca tio n I ns titu te s: 2 01 4 A ud it S na ps ho t 2014–15:31 M ay 20 15 Level 24 35 Collins Street Telephone 61 3 8601 7000 Facsimile 61 3 8601 7010
Victorian Auditor-General’s Report
May 2015
2014–15:31
Technical and Further Education Institutes:
2014 Audit Snapshot
Technical and Further
Education Institutes:
2014 Audit Snapshot
Ordered to be published VICTORIAN GOVERNMENT PRINTER May 2015This report is printed on Monza Recycled paper. Monza Recycled is certified Carbon Neutral by The Carbon Reduction Institute (CRI) in accordance with the global Greenhouse Gas Protocol and ISO 14040 framework. TheLifecycle Analysis (LCA) for Monza Recycled is cradle to grave including Scopes 1, 2 and 3. It has FSC Mix Certification combined with 55% recycled content.
The Hon. Bruce Atkinson MLC The Hon.Telmo Languiller MP
President Speaker
Legislative Council Legislative Assembly
Parliament House Parliament House
Melbourne Melbourne
Dear Presiding Officers
Under the provisions of section 16AB of the Audit Act 1994, I transmit my report Technical
and Further Education Institutes: 2014 Audit Snapshot.
This report comments on the outcomes of the 2014 financial audits of the 12 technical and further education (TAFE) institutes and their controlled entities. The report makes comment on the results, trends and risks. It also comments on performance reporting and risk management at the TAFEs, being two key areas of governance within TAFEs.
The report demonstrates that the financial performance of the TAFE sector is in decline with combined net deficits for the 2014 and 2013 financial years. Our indicators of financial sustainability risks show short-term challenges at six TAFEs, and longer-term risks emerging for nine TAFEs as spending on asset replacement and renewal is decreasing. Yours faithfully
John Doyle Auditor-General 28 May 2015
Contents
Auditor-General's comments ... vii
Audit summary ... ix
Conclusions ...x
Findings ...x
Recommendations ... xii
Submissions and comments received ... xiii
1. Context... 1
1.1 Introduction ... 1
1.2 Audits for the year ending 31 December 2014 ... 2
1.3 TAFE revenue and funding ... 4
1.4 TAFE expenditure ... 8
2. Financial outcomes ... 9
2.1 Introduction ... 10
2.2 Conclusion ... 10
2.3 Financial overview of the sector ... 10
2.4 Financial sustainability risks ... 15
2.5 Responding to funding changes ... 17
3. Performance reporting... 21
3.1 Introduction ... 22
3.2 Conclusion ... 22
3.3 Framework for reporting and progress to date ... 23
3.4 Performance statements ... 23
4. Risk management ... 27
4.1 Introduction ... 28
4.2 Conclusion ... 28
4.3 Risk management framework ... 28
Appendix C. Financial sustainability ...39
Appendix D. Risk management framework ... 45
Appendix E. Glossary ... 47
Auditor-General’s comments
Victoria's technical and further education (TAFE) institutes have undergone a period of structural change since 2012 when the then government altered its funding model. The agility of TAFEs to respond to these changes and associated challenges has varied, and not all have responded in a timely and/or financially sustainable way. Consequently, I am reporting a further deterioration in the financial performance of the sector for 2014.
The 10 TAFEs whose financial reports are finalised and commented on in this report had a combined net deficit of $84.3 million for 2014. This result follows a combined net deficit of $15.1 million generated by the sector in 2013 and was characterised by revenue decreasing at a faster rate than expenditure.
The declining financial performance of TAFEs has been reflected in the results of our analysis where six TAFEs have been assessed as having high financial sustainability risks with short-term challenges that need to be addressed. Further, nine TAFEs have been assessed as having longer-term financial sustainability risks in terms of the funding of asset renewal and replacement. I note that while the level of spending on new assets and asset renewal has been decreasing year on year, an additional net $56.8 million in capital funding was provided for the period to 2016–17 in the recently announced State Budget. This should reduce the risk that TAFE assets may eventually cease to be fit for purpose if they are not renewed or replaced as required.
While some steps have been taken by the sector to respond to the structural changes, bigger steps are needed by TAFE boards and the Department of Education & Training to turn around the financial decline within the sector.
Shortly after this report is tabled in Parliament an interim report will be presented to government arising from a review into funding of the sector. This is an important piece of work that I hope will provide a way forward for cost efficient and competitive TAFEs, and a financially sound TAFE sector.
TAFEs wrote down the carrying value of the Student Management System (SMS) by $43.2 million during 2014. These write downs directly contributed to the poor financial outcomes of the sector. Although the state had spent $94.9 million building the SMS, it had written off $21.1 million prior to transferring it to the TAFEs. I question whether the TAFEs received the value purported to have been provided as capital, and whether the state received value for money as the SMS is now valued at 32.2 per cent of the original cost only one year after it was put into service.
John Doyle
Auditor-GeneralAudit team
Simone Bohan Engagement Leader Helen Grube Team Leader Matthew Graver Audit Senior Ryan Ackland AuditorEngagement Quality
Control Reviewer
Roberta Sklirosat TAFEs are not well-articulated or comprehensively covered in TAFE risk registers, and that two TAFEs did not have a functioning risk register at the time of our audits.
John Doyle
Auditor-General
Audit summary
At 31 December 2014, there were 12 publicly-owned technical and further education (TAFE) institutes, 10 of which have since finalised their 2014 financial report.
The number of TAFEs has decreased since 2013 as the former Advance and Central Gippsland TAFEs amalgamated on 1 May 2014 to become Federation Training, and the former Bendigo and Kangan TAFEs merged on 1 July to become Bendigo Kangan TAFE.
Federation Training has not completed their 2014 financial report at the date of preparation of this report. While acknowledging that this TAFE was created during the financial year as a result of an amalgamation, Federation Training has failed to meet legislative reporting time frames for financial reporting and therefore
breached the requirements of the Financial Management Act 1994. Consequently, the financial results and performance reporting of this TAFE are not included in this report, but our observations and conclusions on their risk management practices are included.
The 2014 financial statements of Wodonga Institute of TAFE were finalised on 17 March 2015. We have subsequently become aware that the 2014 financial statements are materially misstated. It is expected that the financial statements will be reissued and certified by Wodonga Institute of TAFE incorporating the
appropriate amendments, and another audit opinion issued. The outcome of this matter will be acquitted to Parliament in a subsequent VAGO report. The financial results of this TAFE have been removed from this report when commenting on sector financial outcomes.
This report comments on the financial results, trends and risks arising from our audits of TAFE financial and performance statements, and the financial statements of the 16 entities they control.
TAFEs must have robust governance frameworks to monitor and oversee
operations, including sound risk management and performance reporting. We have looked at both these components of governance in this report, commenting on the annual performance reports which we have audited, and conducting a high-level review over the risk management policies, procedures and tools in use at the 12 TAFEs.
arrangements. Consequently the sector has short- and long-term financial sustainability risks that need to be monitored and managed by TAFE boards and the Department of Education & Training (DET).
Due to the financial challenges of the sector, strong governance is required. Our audits found there is an opportunity to improve risk management practices and performance reporting to enhance the management and oversight of TAFEs.
Findings
Financial outcomes
The TAFEs with finalised 2014 financial reports reported a combined net deficit of $84.3 million for 2014, compared to the deficit generated by the sector of
$15.1 million in 2013. This is the second year of deficits since changes were implemented to the sector's government funding arrangements in 2012.
Since 2012, TAFEs no longer receive direct government funding. All government funding is contestable, and is provided as student subsidies which vary in amount from course to course, and sometimes from year to year. Also total student numbers have declined during this period. Most TAFEs have been unable to effectively adapt to this change in operating environment. The impact of this has been that—at the sector level—TAFE revenue is declining faster than expenditure, which has caused the continued deficit position for the sector in 2014.
This declining position has been mirrored in the results of our analysis where six TAFEs are now considered to have high financial sustainability risks, with short-term concerns regarding their financial position and performance, and their ongoing viability.
Indeed, two TAFEs, Sunraysia Institute of TAFE and Melbourne Polytechnic, disclosed that there was a material uncertainty around the going concern assumption when preparing their 2014 financial reports. Both TAFEs have produced future cash flow forecasts that show additional financial support may be required, and this has been provided for both entities by DET.
Coupled with this, our longer-term financial sustainability risk indicators highlight risks relating to the funding of asset renewal and replacement. Further, nine TAFEs have decreased spending on new assets and asset renewals in 2014 to a point where our indicators suggest that the level of spending may not be sufficient to maintain assets in their current condition. The 2015–16 State Budget announced a
Student management system
The former Department of Education and Early Childhood Development (DEECD) developed a student management system (SMS) to assist TAFEs with the
monitoring and administration of enrolled students. DEECD initially recognised $94.9 million as the capital cost of this system, before impairing the value to $73.8 million at the completion of the SMS. The SMS was impaired at this stage because changes in scope during the system build had added costs to the project but not enhanced the value of the asset. On 31 December 2013, the finalised SMS was handed over to nine TAFEs who elected to use it.
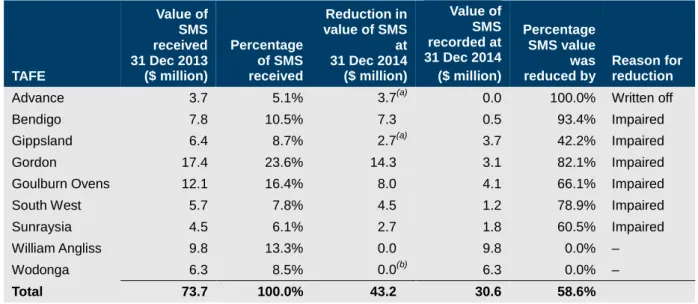
In line with accounting standards, all nine TAFEs have reviewed the value of their portion of the SMS at 31 December 2014. One TAFE wrote off the system as a consequence of mergers as the SMS was no longer going to be used. A further six TAFEs impaired the SMS as the value in their financial reports was higher than the expected value to be derived from its use. Collectively, the net impact is that the value of the SMS has been further reduced by another $43.2 million to
$30.6 million.
As a result, the carrying value of the state built system is now only 32.2 per cent of the total amount spent on it only two years after completion. This indicates that the state did not receive value for money from the $94.9 million expended on creating the SMS.
Performance reporting
Performance reporting in the TAFE sector changed in 2014 with performance statements recording actual outcomes against the key performance indicators (KPI) agreed by each institute with the former Minister for Higher Education and Skills. The agreed KPIs, as set in the statement of corporate intent of each TAFE, are intended to report on whether, and how well, each TAFE has met their individual strategic objectives.
Positive changes included moving away from measuring TAFE performance against a suite of mandated indicators that were common across all institutes, and the inclusion of comparative information and variance explanations.
Performance reporting could be further improved by setting KPIs for all strategic objectives. DET has also committed to develop a new performance and
accountability framework that will include both a common set of KPIs, and KPIs set by each TAFE to measure achievement of its strategic objectives. This framework should address the gap created by the new approach where an absence of commonality in KPIs means there is an inability to compare TAFE performance.
We observed that frameworks to support risk management are in place at TAFEs, and in a majority of cases their policies and procedures incorporated better practice elements.
Two TAFEs—Bendigo Kangan and Goulburn Ovens—did not have functioning risk registers during 2014, nor an alternative framework to capture and monitor risks. Yet both TAFEs provided a risk attestation statement in their 2014 annual report that they had a risk management framework in place in line with the Australian/New Zealand Risk Management Standards. This is clearly misleading and contrary to the requirements of the Minister for Finance's Standing Directions pursuant to the
Financial Management Act 1994.
Further, financial sustainability risks and other risks arising from the changing operating and funding environment at TAFEs are not well articulated or
comprehensively covered in risk registers. Consequently, TAFEs risk management frameworks can be improved in this regard.
Recommendations
Number Recommendation Page
1. That TAFEs address issues raised in audit management letters on a timely basis so that any weaknesses in their control environment are rectified promptly.
8
2. That TAFE audit committees implement appropriate monitoring mechanisms to ensure audit findings are resolved by management.
8
3. That TAFEs link key performance indicators to all strategic objectives to ensure there are performance measures and outcomes for all strategic activities.
25
4. That TAFEs improve the variance explanations on performance statements to provide a better understanding of the reasons why performance targets have not been achieved.
25
5. That TAFEs include details of how the actual results for their key performance indicators have been calculated to provide a better understanding of performance for the user of the performance statement.
25
6. That, as a matter of priority, Bendigo Kangan and
Goulburn Ovens TAFEs develop a risk register and apply it as part of a comprehensive risk management framework.
31
7. That TAFEs review, update, monitor and seek to mitigate all risks that might impact their financial and operational
Submissions and comments received
We have professionally engaged with the Department of Education & Training and each of the 12 TAFEs throughout the course of this audit. In accordance with section 16(3) of the Audit Act 1994 we provided a copy of this report, or relevant extracts, to those entities and requested their submissions and comments. We have considered those views in reaching our audit conclusions and have represented them to the extent relevant and warranted. Their full section 16(3) submissions and comments are included in Appendix F.
1
1.1
Introduction
This report details the outcomes of the 2014 financial audits of the 12 Technical and Further Education (TAFE) Institutes and the 16 entities they control.
During the 2014 financial year, there were two amalgamations of pre-existing TAFE entities. On 1 May 2014, Advance TAFE and Central Gippsland Institute of TAFE amalgamated to create Federation Training. On 1 July 2014, Bendigo Institute and Kangan Institute amalgamated to form the new Bendigo Kangan Institute.
This report identifies and discusses the key issues within the TAFE sector that arose during the financial audits, and provides an analysis of the information included in the TAFE financial statements and performance statements. Figure 1A outlines the structure of the report.
Figure 1A Report structure
Report part Description
Part 1: Context Provides an overview of the funding arrangements of TAFEs, including
recent changes to the funding structure by the state government. Discusses the internal control issues identified during the 2014 financial audits.
Part 2: Financial
outcomes Comments on the financial outcomes of the TAFE sector over the five-year period to 31 December 2014, including discussion of key
financial issues impacting the 2014 financial statements Discusses the financial sustainability risks faced by the sector. Part 3:
Performance reporting
Comments on performance reporting in the TAFE sector, including the new approach introduced in 2014.
Part 4: Risk
management Assesses the adequacy of risk management frameworks at the 12 TAFEs.
Source: Victorian Auditor-General’s Office.
Pursuant to section 20(3) of the Audit Act 1994, unless otherwise indicated, any
persons named in this report are not the subject of adverse comment or opinion. The total cost of this report was $155 000.
1.2
Audits for the year ending 31 December 2014
1.2.1
Opinions issued
Independent audit opinions add credibility to financial statements by providing reasonable assurance that the information reported is reliable and accurate. A clear audit opinion confirms that the financial statements present fairly the transactions and balances for the reporting period, in accordance with the requirements of relevant accounting standards and legislation.
Twenty-seven clear audit opinions were issued to TAFE sector entities for the financial year ending 31 December 2014. The financial audits of these entities were undertaken in accordance with the Australian Auditing Standards. Melbourne Polytechnic and Sunraysia TAFEs received emphasis of matter paragraphs in their opinions—these are discussed further in Part 2 of this report. Details of each opinion issued have been provided in Appendix A.
At the date of preparation of this report, the financial report for Federation Training and its ceased predecessor, Advance Training, had not been finalised. As a consequence, the financial results and position of these TAFEs are not included in this report. The results of Advance TAFE and Central Gippsland TAFE, the predecessors of Federation Training, are included in the prior year results throughout this report.
Federation Training is still addressing a number of financial reporting issues and amalgamating the financial information of the two former TAFEs. These issues have been unable to be resolved in a timely manner and consequently the reporting
time lines set by the Financial Management Act 1994 have been breached.
The 2014 financial statements of Wodonga Institute of TAFE were finalised on
17 March 2015. The Wodonga Institute of TAFE 2014 Annual Report, containing the
audited financial statements, was tabled in the Parliament during April 2015. We have subsequently become aware that the 2014 financial statements are materially
misstated. This matter was under investigation at the time of preparing this report. It is expected that the financial statements will be reissued and certified by Wodonga Institute of TAFE incorporating the appropriate amendments, and another audit opinion issued. The outcome of this matter will be acquitted to Parliament in a subsequent VAGO report. The financial results of this TAFE have been removed from this report when commenting on sector financial outcomes.
1.2.2
General internal controls
In conducting our financial audits, we noted that the financial reporting internal controls at the TAFEs, to the extent we tested those controls during our audit, were adequate for maintaining the reliability of financial reporting. Nevertheless, we identified a number of instances where important internal controls need to be strengthened.
Weaknesses in internal controls that are found during an audit are reported to the board, chief executive officer and the audit committee through a formal letter, called a management letter. Typically, two management letters will be provided throughout a financial audit—an interim and a final.
In 2014, across the 12 TAFEs, 16 extreme, high and medium rated control issues were reported through interim and final management letters. Figure 1B shows the reported issues by area and risk rating. The definitions of the risk ratings are detailed in Appendix B.
Figure 1B
2014 reported issues by area and risk rating
Risk rating of issue
Area of issue Extreme High Medium Total
Financial sustainability 1 3 – 4
Reconciliation – – 3 3
IT controls – – 1 1
Revenue – – 1 1
Expenditure (including payroll) – – 4 4
Governance – – 1 1
Assets – – 2 2
Total 1 3 12 16
Source: Victorian Auditor-General's Office.
As discussed in Part 2 of this report, the significant concerns raised in management letters relate to the financial condition of TAFEs. These findings are consistent with the analysis we have conducted in this report and should serve as an area for concern and close monitoring at all TAFEs.
Our management letters also highlighted inadequate reconciliation checks between bank accounts, the Student Management System (SMS) and the general ledger. As these systems provide material information that flows into the financial statements, these weaknesses should be rectified as soon as possible to reduce the possibility of material misstatements in the financial statements. Timely and independent
reconciliations also reduce the risk of error and fraud occurring through these systems. Similarly, the issues raised regarding payroll systems indicate the need to ensure that timely independent checks are performed on key reconciliations to reduce the risk of errors and fraud.
TAFEs should seek to address all issues raised to remove potential weaknesses in their control frameworks. Recommended time lines for the resolution of these issues are included in the rating definitions in Appendix B.
Status of prior period issues
The status of internal control weaknesses identified in prior periods is presented and communicated to TAFEs and their audit committees through the current years' management letters. These issues are monitored to ensure weaknesses identified in the control environments by previous audits are resolved promptly. Figure 1C shows the internal control weaknesses in the prior period with the resolution status by risk.
Figure 1C
Prior period internal control weaknesses—resolution status by risk
Risk rating
Area of issue Extreme High Medium Total
Unresolved 1 – 6 7
Resolved – 1 12 13
Total 1 1 18 20
Source: Victorian Auditor-General's Office.
The unresolved extreme-risk matter relates to Melbourne Polytechnic's financial sustainability—which is discussed further in Part 2 of this report.
While it is positive that TAFEs have started to address all issues raised, the lack of timely resolution means that the control frameworks in place at these entities are not as effective as they should be. Management should seek to address all issues raised on a timely basis, to rectify any weaknesses in their control environment to mitigate the risk of material errors occurring in their financial statements.
1.3
TAFE revenue and funding
TAFEs are funded by two main revenue streams—government grants from the state government, and fees charged to students. Additional revenue is also generated from interest and the sale of specific goods and services—such as the provision of car parking. The TAFEs who have finalised their 2014 financial reports generated $896.4 million in revenue in 2014, a 19.4 per cent reduction on the $1 111.6 million generated by the sector in 2013.
Figure 1D
TAFE revenue: 2014 financial year
Source: Victorian Auditor-General’s Office.
1.3.1
State government funding for TAFEs in 2014
For the TAFEs that had finalised their 2014 financial reports, government funding made up 47.6 per cent ($427.1 million) of TAFE revenue. This is provided to TAFEs through the Department of Education & Training (DET) as subsidies based on the courses undertaken by students. Students can then be charged an additional fee to contribute to their area of study.
Different courses attract different subsidies, with higher rates being awarded for courses that DET determines to 'target areas of greatest public benefit and future jobs
growth', as detailed in DET's April 2012 publication Refocusing Vocation Training in
Victoria.
Subsidy rates
The subsidy rate is set based on maximum payable hours of contact between student and tutor—called a 'contact hour'—regardless of whether a course of study is
undertaken at a private or public (TAFE) provider. The amount paid to a TAFE for a contact hour varies between course and qualification, it can also vary year on year for a particular course, and within a year at the discretion of DET. Similarly, the limit on the total contact hours that will be subsidised varies widely between qualifications, each year and for the total course.
As a result, the total subsidy funding received by a TAFE for a course can vary
significantly. The lowest subsidy paid is $1 per contact hour, up to $14 per contact hour and total contact hours can range from 60 hours to 4 300 hours.
Additional government funding is provided if a student qualifies for a concession due to their financial circumstances, if the course is provided in a regional location and or if the course will benefit the local area's economy.
The challenge for a TAFE in this operating environment is to establish a mix of courses and qualifications, the efficient delivery of which maximises the funding revenue from government while delivering the courses in demand by students and Victorian industries. To optimise funding year on year, and to maintain a financially sustainable model, TAFEs also need to adapt their course mix as subsidy levels change.
1.3.2
Recent changes in government funding structure
Since 1 January 2013, TAFEs no longer receive recurrent government funding. Government course funding is contestable and available to all providers—both public and private. Further, the former state government has required TAFEs to operate on a commercial basis. This means that as well as reducing their reliance on government revenue, they need to be able to:
• recover depreciation costs through operational income
• maintain, renew and replace non-current assets as required
• achieve a prescribed rate of return on non-current assets
• achieve a range of strategic objectives and targets, as agreed annually with the
minister.
This change in the government funding structure, coupled with reducing student enrolments, has resulted in a drop in government grants paid to TAFEs to assist in covering the costs of staff and asset repair/maintenance. In the 2012 financial year— the last reporting period before the changes to government funding took effect—the TAFE sector received 64 per cent ($774.9 million) of their revenue from government. In the 2014 financial year, government funding provided through student subsidises and concessions, made up 47.6 per cent ($427.1 million) of TAFE revenue. This represents a 44.9 per cent reduction in government funding for TAFEs since the changes in the funding structure were implemented.
This change in government grant funding has meant that TAFEs have increased student fees and fee-for-service activities to assist them to meet their expenditure obligations. For the TAFEs with finalised 2014 financial reports, student revenue— including fee-for-service revenue—made up 45.2 per cent ($405.8 million) of all TAFE revenue, compared to 29 per cent ($352.8 million) in 2012 for the TAFE sector. This is a significant change when considering student enrolments have decreased over this time. Figure 1E shows the changes in student and grant revenue received by TAFEs during the past five financial years.
Figure 1E
Student revenue and grant funding received by TAFEs for the financial year ending 31 December 2014
Note: The 2014 data, shown with the unbroken line, only includes the TAFEs with finalised 2014 financial statements. The broken line also includes estimated data for the two TAFEs which had not finalised their 2014 financial statements, refer Section 1.2.1.
Source: Victorian Auditor-General's Office.
1.3.3
Potential future changes to the funding structure
Following the election in November 2014, new funding of $320 million over five years was announced for TAFEs to rebuild facilities and reopen campuses, and to fund community service obligations. By 31 December 2014, $20 million of this funding had been allocated across seven TAFE's as an initial distribution of rescue funds for immediate needs.
The 2015–16 State Budget included 'Rescue Funding' for TAFEs, made up of $100 million in capital funding and $200 million in operating funding. The TAFE Structural Adjustment Fund includes $28 million for 2015–16. In addition the state provided $50 million in funding for the TAFE Back to Work Fund for 2014–15. On 9 February 2015, the Minister for Training and Skills announced a review into the funding and sustainability of Victoria's vocational education and training (VET) system—including TAFEs. An interim report of this review is expected in June 2015, with a final report later in the year. The government expects to consider the report's recommendations prior to the start of 2016, and this may lead to further funding changes for the sector.
0 100 200 300 400 500 600 700 800 900 2010 2011 2012 2013 2014 $ million
Government grants (Estimated) Government grants (Audited)
1.4
TAFE expenditure
The TAFEs with finalised 2014 financial reports had $980.7 million of expenditure in the 2014 financial year. Figure 1F details the main categories of expenditure by the 10 TAFEs with finalised financial reports during the 2014 financial year.
Figure 1F
TAFE expenditure: 2014 financial year
Source: Victorian Auditor-General’s Office.
Since the structural changes in government funding, TAFEs have reduced their overall expenditure by 13.6 per cent between 31 December 2012 ($1 136.2 million) and 31 December 2014 ($980.7 million). The composition of this expenditure has not changed significantly, with employee benefits still making up the main category of expenditure—67.4 per cent for the sector in 2012 ($765.5 million) compared to 60.4 per cent for the TAFEs with finalised financial reports in 2014 ($592.6 million). Part 2 of this report includes comment on additional items of expenditure by TAFEs in the 2014 financial year, including discussion of the impairment of the SMS.
Recommendations
1. That TAFEs address issues raised in audit management letters on a timely basis so that any weaknesses in their control environment are rectified promptly. 2. That TAFE audit committees implement appropriate monitoring mechanisms to
2
At a glance
Background
This Part looks at the collective 31 December 2014 financial position of the 10 technical and further education (TAFE) institutes that had completed their financial statements at the time of preparing this report. It details the main drivers behind the net results achieved, and analyses the sector against four financial sustainability risk indicators.
Conclusion
The financial position and outcomes of the TAFE sector have significantly declined in 2014 and our indicators have highlighted that half of the TAFEs have high financial sustainability risks, requiring immediate and continued attention.
Findings
• The 10 TAFEs had a combined net deficit of $84.3 million for 2014 following a net
deficit of $15.1 million in 2013. This increasing loss indicates that restructuring of the sector to respond to funding changes has yet to yield any positive financial impact.
• Material uncertainties existed that put at risk the ability of Sunraysia Institute of
TAFE and Melbourne Polytechnic to report on a going concern basis when preparing their 31 December 2014 financial statements. Both TAFEs may need to access additional money from the Department of Education & Training.
• The risk of the TAFE sector not being financially sustainable has increased with
six TAFEs rated as having high financial sustainability risks in 2014.
• Long-term sustainability risks have continued as an issue as nine TAFEs
decreased spending on new assets and asset renewals to a level less than they are consuming, and our indicators show they are not generating sufficient cash flows from operations to fund new assets and asset renewals.
• The state built a Student Management System for TAFEs at a total cost of
$94.9 million. At 31 December 2014, $64.3 million has been written off or written down by the Department of Education & Training and the TAFEs. The write offs
2.1
Introduction
This Part looks at the collective 31 December 2014 financial position of the 10 technical and further education (TAFE) institutes that had completed their financial statements at the time of publication, and the results for one TAFE that ceased during the 2014 financial year. The results and financial position of Advance TAFE—for the period ending 30 April 2014—Federation Training and Wodonga Institute have not been included as they were incomplete at the time of preparation of this report. This Part details the main drivers behind the net result achieved and analyses the sector against four financial sustainability risk indicators. We discuss the results both collectively and through examples of entities that are at risk.
2.2
Conclusion
The financial position and outcomes of the TAFE sector have declined in 2014 as revenues continued to decline faster than expenditure. Six TAFEs have high financial sustainability risks with both short- and long-term financial sustainability challenges. This is not a sustainable path and requires the continued and immediate attention of TAFE boards and the Department of Education & Training (DET).
2.3
Financial overview of the sector
At 31 December 2014, the TAFEs who had finalised their 2014 financial reports reported a collective net loss of $84.3 million. This deficit is the second since the change in approach to government funding was introduced in 2012. Figure 2A shows the net results of the TAFE sector for the financial years ending 31 December 2010 to 2014.
Figure 2A
Net result of TAFE sector financial years ending 31 December 2010 to 2014
Note: The 2014 data, shown with the solid line, only includes the TAFEs with finalised 2014 financial statements. The broken line also includes estimated data for the two TAFEs which had not finalised their 2014 financial statements, refer Section 1.2.1 of this report.
Source: Victorian Auditor-General’s Office.
Figure 2A shows clearly the year on year decline in TAFE profitability over the past five years. The decline can be mapped to the key funding changes discussed in Part 1 of this report. In particular, the sector moved into a net deficit position in 2013 and 2014 as TAFEs have sought to restructure their business to respond to the funding changes. However, Figure 2A shows that the TAFE structural changes made to date are yet to have a positive effect on the net results.
Figure 2B illustrates the revenue and expenditure changes across the TAFE sector over the same period. This shows that revenue has declined at a faster rate than expenditure since the funding changes. Between 31 December 2012 and
31 December 2014, revenue across the TAFE sector has decreased by 25.5 per cent and expenditure by 13.6 per cent. There has been a year on year decline in the sector's net result.
-150 -100 -50 0 50 100 150 200 2010 2011 2012 2013 2014 $ million
Figure 2B
Revenue and expenditure changes across the TAFE sector
Note: The 2014 data, shown with the solid line, only includes the TAFEs with finalised 2014 financial statements. The broken line also includes estimated data for the two TAFEs which had not finalised their 2014 financial statements, refer Section 1.2.1 of this report.
Source: Victorian Auditor-General’s Office.
2.3.1
Reducing revenue
In addition to the funding changes discussed in Part 1 of this report, during the 2014 operating year the funding levels and eligibility for recognition of prior learning and foundation skills courses was reduced. Consequently, there were limitations put on who could undertake foundation skills courses, how many times they could undertake these courses and what funding would be provided for them. Similarly, the funding provided for recognition of prior learning was decreased.
TAFE institutes who relied on third-party providers to deliver recognition of prior learning and foundation skills courses were negatively impacted as a result of these reductions, coupled with a new requirement restricting third-party delivery unless approved by DET.
Goulburn Ovens TAFE and Sunraysia TAFE were both particularly affected by this change in funding. The year on year change in government operating revenue was a decrease of 67 per cent at Goulburn Ovens TAFE and 56 per cent at Sunraysia TAFE. Both TAFEs also had a similar level of decrease in contract costs as a result of reduced third-party relationships.
Also contributing to reduced revenue for TAFEs is a decrease in the overall number of
student enrolments. Figure 2C shows a table from the Victorian Training Market Report
2014 detailing how the enrolments in the TAFE sector have decreased over the past
850 900 950 1 000 1 050 1 100 1 150 1 200 1 250 2010 2011 2012 2013 2014 $ million
Revenue (Estimated) Revenue (Audited)
Fewer enrolments mean that TAFEs have to work harder to attract a share of the market so that revenue is maximised. A reduction in student revenue, combined with reduced government funding, have created a challenging financial environment for the sector. The financial position of the TAFEs has consequently been dependent on their ability to manage and decrease expenditure, and find alternate sources of revenue in response to the revenue changes, yet this has not occurred at a fast enough pace.
Figure 2C
Government subsidised students enrolled at TAFEs 2009 to 2014
Note: AQF— Australian Qualifications Framework
Source: Victorian Training Market Report 2014, Department of Education and Training, March 2015.
2.3.2
Other issues impacting expenses
While the main driver of the 2014 financial year deficit is revenue in the sector decreasing more than expenditure; there are two other issues that have impacted the 2014 net result:
• write offs and write downs of the recently installed Student Management System
(SMS) in seven TAFEs
• staff redundancies.
Student Management System
The former Department of Education and Early Childhood Development (DEECD) built the SMS for the Victorian TAFE sector, at a capitalised cost of $94.9 million. The SMS was designed to enrol, invoice and manage student data and information over the period of their study, and produce management information and reports that comply with reporting standards.
At 31 December 2012, DEECD reviewed the value of the SMS and wrote it down 22 per cent ($21.1 million), because changes in scope during the build process had added costs to the project but not enhanced the asset, and therefore could not be capitalised.
The SMS was completed in 2013. Control of the SMS was then passed on to the nine TAFEs who elected to use the system. The remaining capitalised balance of
At 31 December 2014, each TAFE considered whether the value of the SMS in their financial statements was impaired as they are required to do under accounting standards—this means the TAFEs considered whether the value of the SMS system recorded in their books was too high when compared to the value expected to be derived from its use. As a result of this, six of the nine TAFEs wrote down a combined value of the SMS by $39.5 million.
One TAFE wrote off the full amount of the asset ($3.7 million) as a decision had been made by 31 December 2014 that the SMS was no longer going to be used as a result of TAFE amalgamations.
In accordance with Australian Accounting Standards, the write offs and write downs were recorded as an expense in the financial statements of the relevant TAFEs— directly impacting their net result.
Figure 2D summaries the value of the SMS system provided to each TAFE at
31 December 2013, and the movement in SMS values at 31 December 2014. It shows that collectively the TAFE sector has written off 58.6 per cent of the SMS asset given to them, in the first year of use. The expense of impairing the system has contributed to the overall net deficit of the TAFE sector in the 2014 financial year.
Figure 2D SMS impairment at 31 December 2014 TAFE Value of SMS received 31 Dec 2013 ($ million) Percentage of SMS received Reduction in value of SMS at 31 Dec 2014 ($ million) Value of SMS recorded at 31 Dec 2014 ($ million) Percentage SMS value was
reduced by Reason for reduction
Advance 3.7 5.1% 3.7(a) 0.0 100.0% Written off
Bendigo 7.8 10.5% 7.3 0.5 93.4% Impaired
Gippsland 6.4 8.7% 2.7(a) 3.7 42.2% Impaired
Gordon 17.4 23.6% 14.3 3.1 82.1% Impaired
Goulburn Ovens 12.1 16.4% 8.0 4.1 66.1% Impaired
South West 5.7 7.8% 4.5 1.2 78.9% Impaired
Sunraysia 4.5 6.1% 2.7 1.8 60.5% Impaired
William Angliss 9.8 13.3% 0.0 9.8 0.0% –
Wodonga 6.3 8.5% 0.0(b) 6.3 0.0% –
Total 73.7 100.0% 43.2 30.6 58.6%
(a) As per Federation Training TAFE's estimated financial statements for the period ending 31 December 2014. (b) As per Wodonga TAFE's estimated financial statements for the period ending 31 December 2014.
Source: Victorian Auditor-General's Office.
Figure 2E summarises the valuation movements for the SMS from inception. The carrying value of the asset the state built is now only 32.2 per cent of the total amount spent, two years after completion. This indicates that the state did not receive value for
Figure 2E
Valuation movements for the SMS
($ million)
Total amount capitalised as cost of the system 94.9
Impairment by former DEECD at 31 December 2012 -21.1
Write offs and impairments by the TAFE sector at 31 December 2014 -43.2
Total carrying value at 31 December 2014 30.6
Source: Victorian Auditor-General's Office.
Redundancies
Employee benefits are the most significant expenditure of a TAFE, as education is a labour intensive service. In 2014, they represented 60.4 per cent of expenses, down from 61.0 per cent in 2013.
Contributing to that expense line is the cost of redundancies which occurred at eight of the 10 TAFEs in the 2014 financial year. Reducing staff numbers through redundancies has been one of the key industry responses to the change in funding structure and falling student numbers, as it reduces costs in the long term.
In 2014, $10.3 million was spent on redundancy payments in total at 10 TAFEs— thereby contributing to the net deficit result of the sector. Melbourne Polytechnic and Box Hill Institute had the largest redundancy expenses in 2014, costing $4.4 million and $2.5 million respectively.
2.4
Financial sustainability risks
To be financially sustainable, TAFEs should aim to generate sufficient revenue from operations to meet their financial obligations, and to fund asset replacement and asset acquisitions.
We use four financial sustainability risk indicators taken over a five-year period to assess the potential financial sustainability risks in the TAFE sector. An overall risk rating is determined for each TAFE taking into account short- and long-term risks. Appendix C describes the financial sustainability indicators, risk assessment criteria and benchmarks we use in this report, as well as detailing the indicator results calculated for each TAFE for 31 December 2010 through to 2014.
Our analysis for 2014 shows that TAFE sector's risk of not being financially sustainable has increased. Figure 2F summarises the financial sustainability risk ratings for the sector for the past five years. This shows the risk increasing year on year as the number of TAFE's assessed as high risk has increased to six, and the number assessed as low risk has remained at just one in 2014.
Figure 2F
Financial sustainability risk analysis – 2010 to 2014
Source: Victorian Auditor-General’s Office.
Short-term risks
At 31 December 2014, nine TAFEs recorded a negative underlying result indicating that not enough revenue is being generated to pay total operating costs. This can lead to short-term financial sustainability concerns, particularly where a TAFE has had successive years of negative underlying results which have had a consequential impact on cash reserves. With the exception of two TAFEs, a positive for the sector is that liquidity for most TAFEs was above a result of one—that is current assets
exceeded current liabilities—at 31 December 2014. This indicates they are likely to be able to pay short-term liabilities as they fall due, within the next 12 months. Refer Figure C4 in Appendix C.
Longer-term risks
The TAFE sector has emerging long-term financial sustainability risks that will need to be managed. The two long-term financial sustainability indicators we use look at the adequacy of the cash flows from operations to fund asset renewal and replacement (self-financing) and the spending on asset renewal and replacement compared to asset consumption (capital replacement indicator). There has been a deterioration across the board for both indicators since 2011, with most TAFEs flagging these two indicators as at risk. Refer to Appendix C.
The ability of a TAFE to self-finance the purchase of new assets or asset renewal has been flagged as a risk in nine TAFEs in 2014, with those same TAFEs also receiving a red flag for consuming more assets than they bought or renewed in 2014.
0% 25% 50% 75% 100% 2010 2011 2012 2013 2014
In the 2015–16 State Budget capital funding for TAFEs increased by a net $56.8 million for the period 2016–17. This is as a result of $43.2 million in capital funding from the TAFE structural adjustment fund being redirected to operating funding, and new TAFE capital funding of $100 million being announced as part of the TAFE 'rescue fund'. New projects of $23.9 million will be funded in 2015–16 from this fund.
This new fund should reduce the risk that under-investing in capital assets over the long term may mean the condition of teaching and student facilities will deteriorate and eventually will no longer be fit for the purpose of delivering education and services. This ultimately puts at risk the effective delivery of the TAFEs core business.
2.5
Responding to funding changes
As discussed in Part 1 of this report, since 1 January 2013 the TAFE sector receives funding from government as subsidies for courses delivered. No additional government funding is provided to assist TAFE's in managing their operations.
These changes were announced in the May 2012 State Budget, which meant that TAFEs had approximately six months to prepare. Some TAFEs responded quickly by undertaking significant redundancies in the 2012 financial year, and by increasing fee-for-service revenue and student fees from 1 January 2013 to compensate for the reductions in government funding.
Where TAFEs took longer to respond to the funding changes, this adversely impacted their financial performance and position, and concerns about future financial
sustainability.
For Sunraysia Institute of TAFE (SuniTAFE) and Melbourne Polytechnic, financial sustainability risks have crystallised, with each disclosing a material uncertainty regarding their ability to continue as a going concern at 31 December 2014.
Consequently each received an emphasis of matter in their audit opinion bringing the reader's attention to the disclosures within their financial statements where they identify the material uncertainties and risks.
2.5.1
Sunraysia Institute of TAFE
At 31 December 2014, SuniTAFE reported a net deficit from operations of $10.7 million and negative cash flows from operating activities of $0.7 million. This is a significant decline from 2013 when the TAFE made a net surplus of $2 million and had positive cash flows from operations. The TAFEs liquidity ratio has declined from 2.0 in 2013 to 0.9 in 2014. We have assessed this TAFE as having high financial sustainability risks. The principal reason for this turnaround was lower than expected student revenue as a result of the funding adjustments to recognition of prior learning. These funding adjustments were not known when the 2014 budget was struck. A $2.7 million expense associated with impairing their SMS also contributed to the 2014 loss.
A review of SuniTAFE's actual revenue and expenditure, against its 2014 financial year budget shows that the TAFE had budgeted for a deficit of $0.5 million. This budgeted deficit was underpinned by revenue of $36.4 million and expenditure of $36.9 million. Actual revenue was lower than expected by 32 per cent. Although expenditure was also lower, it did not decrease as much as revenue causing the consequential increased loss.
SuniTAFE conducted a mid-year budget review in June 2014 to develop strategies to address the emerging financial issues. This budget review proposed redundancies and campus closures scheduled to occur in late 2014. However, following the election of a new state government in November 2014, these strategies were not actioned at the government's request. SuniTAFE has to identify new ways of becoming more financially sustainable.
To assist SuniTAFE in responding to these challenges, the former government provided it with $2.8 million in funding from the TAFE Structural Adjustment Fund (TSAF). To improve their longer-term financial sustainability, SuniTAFE is planning to:
• grow profitable areas of the business, and expand the areas where student
demand exceeds available places
• exit courses making a loss
• review current business models and current campus operations
• explore shared support services opportunities and review the current staffing
profile.
The cash reserves at SuniTAFE had decreased to $2.6 million at 31 December 2014 as a result of the negative financial result for the year. As further support, on
20 March 2015 the TAFE obtained a letter from DET offering a $5 million line of credit which can be accessed as required. Any credit used is repayable by 30 June 2016 and no interest is payable.
SuniTAFE has prepared a cash flow budget for the 18-month period to April 2016, which predicts the TAFE will have a cash surplus of $705 592 at the end of this period. However, it also shows that the TAFE will not have sufficient cash to pay operating costs in March 2015. The government line of credit may be required by SuniTAFE to enable it to continue, but it may struggle to repay any amounts drawn down by 30 June 2016 given the predicted tight cash situation.
2.5.2
Melbourne Polytechnic
This is the second financial year end that Melbourne Polytechnic has received an emphasis of matter in their audit opinion drawing attention to their potential inability to report on a going concern basis.
In the year ended 31 December 2014, Melbourne Polytechnic reported a net deficit of $20.54 million after reporting a $31.69 million net deficit in the 2013 financial year. Two successive years of deficits combined with net cash outflows from operations of $23.3 million in 2013, and $6.9 million in 2014, has impacted the cash reserves of Melbourne Polytechnic. We have assessed this TAFE as having high financial sustainability risks.
The delayed response of Melbourne Polytechnic to the changed market conditions in 2013 is one of the key drivers for their ongoing poor financial position. Melbourne Polytechnics revenue decreased when TAFE funding moved to subsidised hourly funding as it lost market share and the associated student revenue. At the same time costs were stagnant, causing the loss in 2013.
In 2014, Melbourne Polytechnic had taken steps to turn around its financial position. In particular, they were focused on:
• restructuring course fees and reviewing all current courses and programs for
commercial viability, as well as any future courses and programs
• exploring avenues for increasing operational revenues, particularly fee-for-service
revenue
• analysing operations for cost-effectiveness and organisational efficiencies,
including reviewing the current organisational structure and staffing profile
• continuing the expansion of activities at their Prahran campus.
As a result of commencing some of these steps, revenue increased in 2014 by 8 per cent while at the same time expenditure decreased by 2 per cent. While these movements were not sufficient to turn the net result positive in 2014, they indicate the changes implemented in 2014 are moving revenue and expenditure in the right direction. However, further significant changes in revenue and expenditure will be required to put Melbourne Polytechnic on a financially sustainable footing.
Melbourne Polytechnic has received $4 million in funding from the TAFE 'rescue fund' in 2015 to retrain and redeploy staff. In addition, DET have provided financial support by way of an interest-free loan to be drawn on where additional cash flow is required. The loan is for $16 million, of which $3 million was drawn in 2014 leaving a further $13 million available as needed.
Melbourne Polytechnic has prepared a conservative cash flow forecast which predicts cash outflows to continue to 31 March 2016. It is expected that even with $27.2 million in government funding for students, the $4 million in rescue funding and using the $13 million government loan, the net cash outflow will be $10.7 million leaving the TAFE with only $1.6 million of cash at 31 March 2016. A non-conservative cash flow has been prepared which predicts the TAFE will have $4.3 million at 31 March 2016. These cash flow projections indicate that the TAFE will continue to be in a marginal position and requiring government support in the short term.
Recommendation
We have raised no recommendations in relation to the findings in this Part as we acknowledge the current review being undertaken of TAFE sector funding by
government. Based on the scope of that review, we hope it will address the concerns raised in this chapter.
3
At a glance
Background
Fundamental changes were made to performance reporting by technical and further education (TAFE) institutes in 2014, moving away from reporting against mandated indicators to reporting against individually set measures. This Part covers the results of the 2014 audits of performance statements for the 10 TAFEs who had prepared them for 31 December 2014, and comments on the changes implemented for 2014.
Conclusion
TAFEs have made positive progress in performance reporting tailoring key performance indicators (KPI) for individual strategic objectives. To ensure
comprehensive performance reporting, the Department of Education & Training (DET) needs to deliver on its commitment to establish and mandate a performance reporting framework by 2016.
Findings
• Ten TAFEs received clear audit opinions on their performance statements for the
year ending 31 December 2014.
• The change to TAFE-specific KPIs leaves a gap for comparability of performance
between TAFEs' that should be addressed in the DET planned performance and accountability framework.
• Reporting on performance was not comprehensive as KPIs were not set and
measured for all strategic objectives across all TAFEs.
• Variance explanations were provided in performance statements, however, the
quality needs to improve so that a reader can understand why the target has not been achieved.
Recommendations
• That TAFEs link KPIs to all strategic objectives to ensure there are performance
3.1
Introduction
The Education and Training Reform Act 2006, requires technical and further education (TAFE) institutes to develop an annual statement of corporate intent. The statement must outline the TAFE's strategic objectives, directions, operational priorities, and the associated key performance indicators (KPI) and targets that will benchmark its results for a financial year. This statement is agreed with the appropriate minister prior to the start of each financial year.
For the 2014 reporting period, the former Minister for Higher Education and Skills instructed all TAFEs, through the annual reporting guidelines, to prepare a
performance statement reporting their achievement against the KPIs agreed in the statement of corporate intent. This performance statement was to be published in their annual report.
Ten TAFE's published performance reports for 31 December 2014. As Bendigo Kangan TAFE was only established on 1 July 2014, they did not prepare a performance statement as they had not agreed a statement of corporate intent with the minister, and therefore had no KPIs to report against for the 2014 calendar year.
Federation Training had not finalised their 31 December 2014 performance statement at the date of preparation of this report.
Audit of performance statements
The Audit Act 1994 empowers the Auditor-General to audit any performance indicators in the report of operations of an audited entity to determine whether they:
• are relevant to any stated objectives of the entity
• are appropriate for the assessment of the entity's actual performance
• fairly represent the entity's actual performance.
Our audits of the 10 TAFE performance statements provided opinions on whether the reported results were fairly presented. The opinions do not conclude on the relevance or appropriateness of the reported performance information.
Clear audit opinions were issued on the 10 performance reports audited for 2014.
3.2
Conclusion
TAFEs have made positive progress in performance reporting. The 2014 performance statements contained tailored KPIs, comparative information and variance
explanations for differences between target and actual outcomes.
To fully inform Parliament about the performance of TAFEs, the Department of Education & Training (DET) needs to deliver on its commitment to establish and mandate a comprehensive performance reporting framework by 2016.
3.3
Framework for reporting and progress to date
In our report Technical and Further Education Institutes: Results of the 2013 Audits
(tabled in August 2014), we noted that performance reporting in the TAFE sector was underdeveloped, inconsistent, lacked clear direction and did not enable comparisons between TAFE entities. This was largely because there was no framework for performance reporting.
Following on from these findings we made three recommendations that were accepted by DET, that:
• DET work with TAFEs to develop a performance reporting framework that
mandates a core suite of indicators for all TAFEs to report against, that are relevant and appropriate, and guides entities to establish suitable targets that effectively measure performance
• TAFEs should also develop their own KPIs to ensure that they can tailor their
performance report to demonstrate progress on their individual strategic activities
• TAFEs improve the quality of performance statements by including comparative
information and explanations for significant variations.
In responding to that report, DET made a commitment that the inclusion of
comparatives and explanations of variances would occur for the 2014 reporting period, and that the DET scrutiny would be ongoing.
The introduction of a performance reporting framework was listed for action to be completed and introduced by the first half of 2016.
DET is in the process of seeking an expert to assist in the design and implementation of a performance and accountability framework for TAFEs. The framework is to be designed by August 2015 with input from a reference group made up of four chief executive officers representing regional and rural TAFEs.
It is DET's intention that the 2016 annual report for TAFEs will include the outcome of this work and report against a balanced scorecard template to be designed as part of the framework. Within this, there will be a set of common performance indicators that will enable comparability between TAFEs, and a set of institute-designed performance indicators to report performance against individual strategic objectives.
3.4
Performance statements
Ten TAFEs produced tailored performance statements for the financial year ending 31 December 2014, based on their statements of corporate intent. The KPIs included in these statements were determined on an individual basis, but included comparatives and explanations of variances.
The reporting of KPIs drawn from the statement of corporate intent of each individual TAFE is a positive development from where the sector was in 2013. This change for
We analysed the 10 published performance statements and noted that there was wide divergence between TAFEs regarding the performance indicators used, and the targets set.
Across the TAFEs, there were 48 different indicators, with a wide variance in the number of KPIs adopted by each TAFE—one TAFE had set four KPIs to report against, and at the other end of the scale some TAFEs had 12.
While it is positive that TAFEs are now starting to report against KPIs that are tailored to the strategic direction of their institution, it is important that the KPIs selected provide users with a coherent and transparent picture of the TAFE's operations. By including only a small number of KPIs or by using indicators that only focus on one aspect—such as finances—users are not able to form a complete understanding of the TAFE's performance.
Consistency of indicators
The wide variety of KPIs reported across the TAFEs means that it is difficult to compare TAFE performance for 2014. As a result, a reader would not be able to judge from the performance statement how well a TAFE is performing against others in the sector. The development of a performance and accountability framework by DET should address this issue—with the inclusion of core KPIs to allow for comparability and the new customised KPIs for institute-specific objectives—but this will not be in place until 2016.
Across the 10 performance reports, the most common KPIs reported on by the TAFEs included measures of:
• student satisfaction
• working capital
• return on investment.
Reporting against strategic activities
While TAFEs have created tailored KPIs for their institutions, they have not ensured that there are performance measures for all areas of strategic activity detailed in their statement of corporate intent.
Most TAFEs have not made a clear link in the statement between the activity they will undertake and the KPI that will measure achievement. Our analysis shows that the absence of such links means that performance will not be measured and reported for all of a TAFE's nominated strategic activities. The performance reporting for 2014 was therefore not comprehensive.
Measuring results of KPIs
Within the statement of corporate intent, TAFEs were required to publish targets for each KPI against which they could assess their outcome at 31 December 2014. However, some TAFEs did not include targets for one or more of their KPIs.
Where targets were provided, most TAFEs only included a number or percentage for the KPI, without providing any additional information on how the target/outcome was calculated. This means that a reader of the performance report does not have any context to understand the results and therefore may not be able to form a view about how well the TAFE is performing.
Comparative information and explanation of variances
In response to our report Technical and Further Education Institutes: Results of the
2013 Audits, DET made a commitment that TAFE performance statements would include:
• an explanation for variances between actual and target results for a KPI
• useful comparative information for a KPI result such as the prior year outcome.
TAFEs generally complied with this recommendation, by including comparative information where it was available. Additionally, most TAFEs included an explanation where the outcome of a KPI varied from the target result. However, the quality of variance explanations was inconsistent, with some TAFEs stating there was a variance rather than seeking to explain the underlying cause or barrier to achievement of performance.
Recommendations
That TAFEs:
3. link key performance indicators to all strategic objectives to ensure there are performance measures and outcomes for all strategic activities
4. improve the variance explanations on performance statements to provide a better understanding of the reasons why performance targets have not been achieved 5. include details of how the actual results for their key performance indicators have
been calculated to provide a better understanding of performance for the user of the performance statement.
4
At a glance
Background
Risk management is a combination of organisational systems, processes and procedures that identify, assess, evaluate and mitigate risks to an organisation. An effective risk management framework plays a significant role in reducing an entity's exposure to potentially unfavourable events.
Conclusion
Improvements could be made across the sector to incorporate better practice risk management policies and procedures. This may assist technical and further education (TAFE) institutes to monitor and manage the financial sustainability challenges they face.
Findings
• All TAFEs had board-approved risk management policies in place, with a majority
incorporating key better practice elements.
• However, Bendigo Kangan and Goulburn Ovens TAFEs did not have a
functioning risk register during the 2014 financial year, and were not well placed to monitor and manage risks.
• The risk attestations made by Bendigo Kangan and Goulburn Ovens TAFEs in
their annual reports are implausible, do not align with our observations and are consequently misleading.
• Financial sustainability and the changing operating environment at TAFEs are not
well articulated as risks or comprehensively covered in risk registers. TAFEs can improve their risk management frameworks in this regard.
Recommendations
• That, as a matter of priority, Bendigo Kangan and Goulburn Ovens TAFEs
develop a risk register and apply it as part of a comprehensive risk management framework.