This is a repository copy of Budget support, conditionality and poverty. White Rose Research Online URL for this paper:
http://eprints.whiterose.ac.uk/9922/
Monograph:
Mosley, P. and Suleiman, A. (2005) Budget support, conditionality and poverty. Working Paper. Department of Economics, University of Sheffield ISSN 1749-8368
Sheffield Economic Research Paper Series 2005012
[email protected] https://eprints.whiterose.ac.uk/
Reuse
Unless indicated otherwise, fulltext items are protected by copyright with all rights reserved. The copyright exception in section 29 of the Copyright, Designs and Patents Act 1988 allows the making of a single copy solely for the purpose of non-commercial research or private study within the limits of fair dealing. The publisher or other rights-holder may allow further reproduction and re-use of this version - refer to the White Rose Research Online record for this item. Where records identify the publisher as the copyright holder, users can verify any specific terms of use on the publisher’s website.
Takedown
If you consider content in White Rose Research Online to be in breach of UK law, please notify us by
Sheffield Economic Research Paper Series
SERP Number: 2005012
Paul Mosley and Suleiman Abrar
Budget support, conditionality and poverty.
June 2005
Department of Economics University of Sheffield 9 Mappin Street Sheffield
S1 4DT
United Kingdom
Abstract.
This paper examines the effectiveness of budget support aid as an anti-poverty instrument. We argue that a major determinant of this effectiveness is the element of trust – or ‘social capital’, as it may be seen – which builds up between representatives of the donor and recipient. Thus we model the conditionality processes attending budget support aid, not purely in the conventional way as a non-cooperative two-person game, but rather as a non-cooperative game which may mutate into a
collaborative equilibrium if sufficient trust between the negotiating parties builds up. Whether or not this happens is, we argue, fundamental to the effectiveness of
conditionality, and of budget support aid. This then requires us to enquire into the determinants of trust, which - we empirically demonstrate - derive from the
experience of the negotiating parties with one another, from the incentives they are able to provide to trust one another and from the processes within which their negotiations are conducted. The model is tested against two samples: extensively against a broad sample of all African countries undergoing budget support operations and intensively against a narrow sample of Ethiopia, Uganda, Malawi and Zambia.
The statistical analysis suggests that trust has in practice been achieved not only through a positive ‘social history’ but by the transmission of forward-looking ‘signals’ or ‘bona fides’ concerning fundamentals: high pro-poor expenditure, low military expenditure, and low corruption show a positive relationship with growing trust (measured in terms of freedom from programme interruptions). Where these signals are present, budget support aid is in general growing, and slippage on overt
1.Intuitive foundations
The literature on budget support aid (programme aid) has, with the passage of time, become gradually more pragmatic and even pessimistic. Launched with enthusiasm in the glad confident morning of structural
adjustment in the 1980s, budget support aid has, however, widely been seen to fail to deliver on its promises – especially in Africa, the subject of this paper – and verdicts such as ‘the failure of [conditional] programme aid’ (Collier, 1997) have become common. In a context where the reduction of poverty is the key objective of aid-giving, such an admission of failure in relation to one of the key elements in the aid flow is more than unfortunate.
And yet, there are successes to report. In a number of countries – the most commonly cited in Africa have been Uganda, Ethiopia, Ghana
Mozambique, and with certain reservations Ghana, Tanzania, and Rwanda – growth with pro-poor qualities has been restored, and the role of budget
support aid in this process has clearly been substantial. The jury is still out on what differentiates these cases from the still distressingly common cases of failure, but what is becoming increasingly clear is that one distinctive
characteristic of the success cases is the formation of trust-relationships between the providers and the users of such budget support aid, often linked to an emerging consensus on poverty strategy and operating within a loose form of conditionality (which we have called ‘new conditionality’; Mosley, Hudson and Verschoor 2004) in which slippages on some performance
criteria are condoned so long as trust concerning fundamentals remains. What is at issue, and has not properly been examined by the large literature on conditionality and budget support, is how such trust (sometimes characterised as ‘social capital’) is formed and sustained in this context, and more
technically how the modelling of relationships in which trust is a key variable needs to diverge from standard models of the ‘game’ between aid donor and recipient. The key purpose of our paper is to answer this question, and to trace its implications for policy-makers.
We can begin from one of the key dilemmas of budget support aid, which is that it is often unsuccessful in achieving a sustained
improvement in economic performance, because the performance criteria attached to it are breached, even though it is agreed both by donor and recipient that observing them will be in the recipient country’s interest. The reasons why this breach occurs are various but one systematic one is the threat of disruptive and possibly violent political opposition from interests opposed to the reforms on which budget support aid is conditioned. Thus, even though the receiving government believes that it will benefit
economically, in the long run, from the implementation of a particular reform condition attached to a budget support loan1 – say an increase in income taxation – it fails to implement it, because it fears the political consequences of doing so; as a consequence the reform is not implemented, and budget support aid looks as if it were unsuccessful. (The case is an actual one, drawn from the experience of Bolivia in February 2003. In spite of the withdrawal of the politically sensitive income tax increases, further riots followed, and
1
Throughout this paper we use the word ‘loan’ to describe budget support operations, which in practice may be loans, low-interest credits (e.g. in the case of the IMF’s Poverty Reduction and Growth
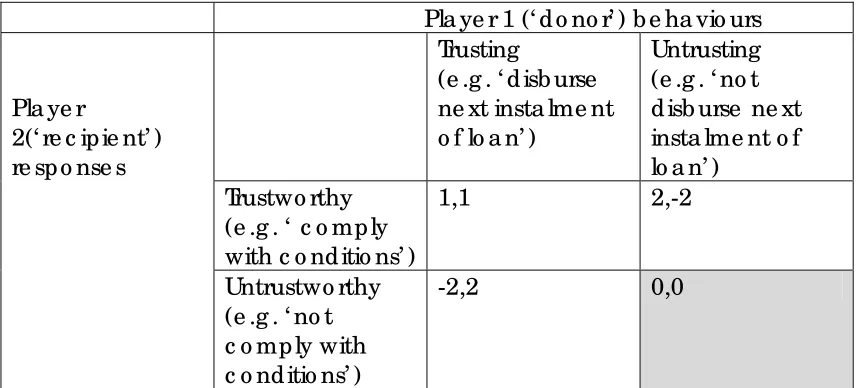
neither political nor economic stability has yet been restored.) Analytically, the problem has analogies with the basic prisoner’s dilemma (Figure 1(a)) in the sense that there are elements of both common interest and conflict between donor and recipient, and one element of conflict is that both parties derive benefit from ‘exploiting’ the other, and breaking an agreement which the other player has honoured, as is the case when a donor continues to lend but a recipient fails to comply with conditions because he fears the political
[image:5.595.84.512.417.611.2]consequences. But as is well known, with the structure of payoffs depicted in Figure 1(a), the equilibrium is in the bottom right-hand corner: in practical terms, untrusting behaviour on both sides dominates trusting behaviour, and the loan process collapses, because the donor implements his threat to not disburse the loan. Hence the illustration only describes a rather untypical case of budget support lending, in which relations between donor and recipient quickly break down and the flow of funds dries up. Although such cases do occur, they are not representative of most budget support loans, nor do they speak to the case which we wish to examine, in which lending continues but at low efficiency because the reforms in policy instruments which are essential to make the loan effective have not been implemented. For these, another approach is needed.
Figure 1. Two illustrations of ‘failed’ programme operations
(a) The conventional, symmetric prisoner’s dilemma: equilibrium at bottom right
Pla ye r 1 (‘ d o no r’ ) b e ha vio urs Trusting
(e .g . ‘ d isb urse ne xt insta lme nt o f lo a n’ )
Untrusting (e .g . ‘ no t d isb urse ne xt insta lme nt o f lo a n’ )
Trustwo rthy (e .g . ‘ c o mp ly with c o nd itio ns’ )
1,1 2,-2
Pla ye r
2(‘ re c ip ie nt’ ) re sp o nse s
Untrustwo rthy (e .g . ‘ no t c o mp ly with c o nd itio ns’ )
-2,2 0,0
Payoffs are given in the order (player 1, player 2). They are defined in terms of additional units of utility in relation to the ‘norm’ in the bottom right-hand corner.
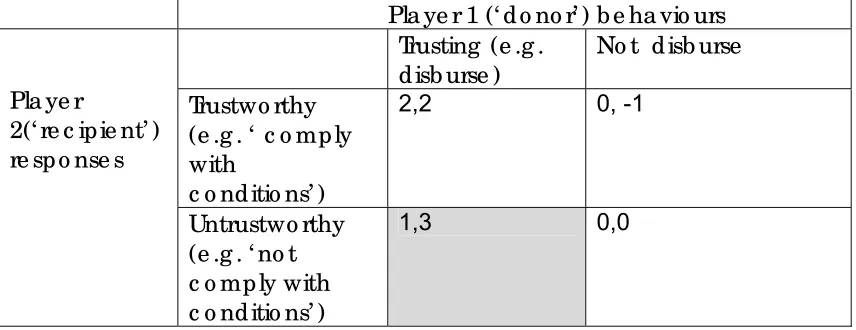
One possible ‘other approach’,which we have previously taken in Mosley, Harrigan and Toye(1995), is to model conditional programme lending as a one-sided prisoner’s dilemma (Figure 1b) in which it is acknowledged that: (i) the donor derives utility from the continuance of a lending relationship – hence the payoff to continuing to lend rather than breaking off lending in the bottom left-hand cell is one rather than minus two; (ii) the dilemma is
conditions) it is not clear what utility any donor would derive from exploiting the recipient by refusing to lend to him if he had complied with conditions. Accordingly, the top right-hand cell in Figure 1(b) has been amended so that the donor derives no utility from exploitative behaviour of this sort. With these altered parameters, the dominant strategy equilibrium of the game moves to the bottom left-hand corner, in which lending continues even though
conditions are not complied with. Empirically, this is a commonly observed outcome, both with the Bank and with the IMF; however, it is also an
inefficient outcome, in the sense that the recipient is failing to manage policy instruments in a way which at least the donor considers to be absolutely vital for the success of the loan operation, and that failure is being openly indulged, with consequent loss of donor credibility. Partly for these reasons,
conditionality has got itself a bad name, and there have been a number of calls for its abandonment, possibly in favour of ‘selectivity’, the approach in which countries whose existing management of economic policy is trusted receive aid, and others do not. This approach has been espoused particularly by the World Bank – the agency which first advocated the systematic
[image:6.595.85.513.418.583.2]extension of conditionality in the 1980s – and specifically adapted to the context of meeting the Millennium poverty reduction goals by the Bank’s former chief economist for Africa, Paul Collier (World Bank 2000, pp. 193-196; Collier and Dollar 2001, 2002).
Figure 1. Illustrations of ‘failed’ programme operations
(b) The ‘one-sided prisoner’s dilemma: equilibrium at bottom left
Pla ye r 1 (‘ d o no r’ ) b e ha vio urs Trusting (e .g .
d isb urse )
No t d isb urse
Trustwo rthy (e .g . ‘ c o mp ly with
c o nd itio ns’ )
2,2 0, -1
Pla ye r
2(‘ re c ip ie nt’ ) re sp o nse s
Untrustwo rthy (e .g . ‘ no t c o mp ly with c o nd itio ns’ )
1,3 0,0
frameworks, which the selectivity approach does not provide. Moreover, conditionality, as previously discussed, has produced some notable success cases. The question is how these success cases have materialised, and what it is that differentiates these cases from those where conditionality achieved no improvement.
On this matter, the case studies of Section 3 report three interesting findings. The first is that donors2 widely practise new conditionality, in which aid flows are sustained if the fundamentals of policy are right, disregarding slippage on non-fundamentals. The second is that ‘agreement on
fundamentals’ is surprisingly difficult to define: it is conventional to describe the fundamentals in terms of agreement on poverty reduction strategy enshrined in a Poverty Reduction Strategy Paper (PRSP) and satisfactory governance, but there are plenty of cases, Uganda being the one studied in section 4 below, where governance is far from ideal on account of substantial corruption and yet trust between donor and recipient on fundamentals
certainly exists. The third is that the existence or not of such trust between high-level negotiators in the donor and recipient institution seems, in fact, to be the main determinant of the size and the stability of aid flows.
Trust, as an indicator of social capital, has of course attracted attention as a significant determinant of growth, capable of explaining inter-country variations in growth even when conventional causal influences such as policy physical and human capital are held constant (Knack and Keefer 1997,
Whiteley 2000), and a number of enquiries into its dynamics and its correlates exist (a good summary is provided by Glaeser et al (2000))3. What is being suggested here, in fact, is simply that the social capital which exists between just two entities – negotiators for the donor and recipient authorities – is a factor of production particularly important for explaining the productivity of resources invested in conditionality negotiations. However, as a factor of production, trust has a number of peculiarities. In particular, unlike physical and human capital, it cannot be bought and sold in a market., and the
question of how it can actually be accumulated is germane. Secondly, trust is very hard to measure (Glaeser et al, 2000), and the experimental methods which are now widely used by researchers to tackle this problem cannot be deployed here. In this paper we shall finesse the second problem by treating interruptions in budget support programmes as a signal that trust-relationships between donor and recipient have broken down (and interpret the period of breakdown as a measure of the gravity of distrust). We now return to the first problem of how trust is accumulated and sustained.
At the interpersonal level, trust has been modelled, both by
economists and philosophers (Faulkner, 2004; Barr, 2003; Bacharach and Gambetta, 2001) as a game between a truster and a potential trustee, which is a good metaphor for the type of social capital we are considering, which is precisely trust between two major protagonists in a bargaining process, rather
2
This remark does not include the IMF (which for the most part lends on commercial terms but provides some concessional aid finance through the Poverty Reduction and Growth Facility, the PRGF)
3
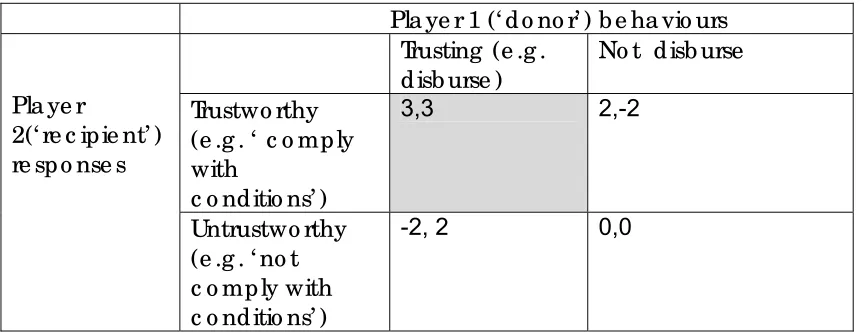
than trust within an entire community. Such trust games are a repeated process: on its first play, with no trust between the players, the game begins with a structure of raw payoffs like those in Table 1a or Table 1b, and then, if the game is repeated a finite number of times, the payoffs to ‘trusting
[image:8.595.84.515.250.416.2]behaviour’ are likely to increase as a consequence of the accumulation by each player of case-study evidence on the other, to the point where the ‘trusting’ equilibrium in the top left-hand corner eventually comes to dominate the ‘untrusting’ equilibrium in the bottom right- hand or bottom left-hand corner, as in the ‘all-in matrix’ of Figure 2 (for a formal demonstration in the prisoners’ dilemma case of table 1a see Kreps et al. (1980)) .
Table 2: The all-in matrix: trust made rational
Pla ye r 1 (‘ d o no r’ ) b e ha vio urs Trusting (e .g .
d isb urse )
No t d isb urse
Trustwo rthy (e .g . ‘ c o mp ly with
c o nd itio ns’ )
3,3 2,-2
Pla ye r
2(‘ re c ip ie nt’ ) re sp o nse s
Untrustwo rthy (e .g . ‘ no t c o mp ly with c o nd itio ns’ )
-2, 2 0,0
This process of transition from Tables 1a and 1b illustrates one of the classic processes by which trust is built up: favourable expectations of the other party’s future behaviour based on experience of past behaviour.
Willingness by the recipient to comply with the donor’s conditions, for
example, may create such expectations on the part of the donor, and stable patterns of aid may create them on the part of the recipient. We call trust built up by this means, experiential trust (it is sometimes referred to in the
philosophy literature as ‘affective trust’; Faulkner 2004). However, this is not the only means by which trust may be created; there are two other
possibilities, both of which depend on the intervention of an external agency. First, it may be possible for such an agency to protect one or both of the players in the game against the possibility of being exploited ; in other words, to act as an insurer. In this case external agency has provided an incentive for the parties to trust one other to an extent that they did not previously, and so we refer to this form of trust as incentivised trust: it is also referred to by philosophers as predictive trust. The case studies of Section 4 draw attention to various important mechanisms for signalling trustworthiness by which trust can be incentivised: these may be seen as heuristics (Kahneman 2003) which enable recipients, in a situation where donors have limited information and information-processing capacity, to determine who can be trusted and at the same time protect themselves against the consequences of their trust being abused. One such ‘signal’ or ‘bona fide’ (as the cases of Uganda and
ventriloquised by the donor. Others include high levels of transparency (low corruption), and high levels of pro-poor expenditure (Mosley, Hudson and Verschoor 2004) together with low levels of expenditures which are poverty-unproductive such as military expenditure. Secondly, personality factors may also be important in incentivising trust, as can be observed in the case of Ethiopia in the 1990s (pages xx-xx below): an inspirational negotiator may be able to make himself trusted by his protagonist even though no experiential trust has been created by prior negotiations. Procedural changes, such as more frequent contact between donor and recipient, may also be important in creating a climate in which trust can be built. However, much as we might wish or try to reduce the process of trust-building to a recipe, certain elements in that process remain elusive and indeed somewhat instinctive. As Onora O’Neill (2002) has emphasised, a proliferation of audit mechanisms has not, in industrialised countries, increased public confidence in the suppliers of public services, and Mosley and Verschoor (2005), using experimental methods in Uganda, have experienced difficulty in incentivising trust by offering insurance against trust being abused.
Once trust is built up, however, there is no doubt of the payoff, specifically within the context of budget support lending. Not only do trusted recipients receive larger aid flows, but those flows, precisely because they are not being continually being broken off and reinstated, are more stable and hence more productive. Just as an unstable external environment is bad for investment, so unstable aid is bad for not only the stability but the level of domestic development expenditures, which then have an important bearing on poverty levels (Mosley and Suleiman 2004;Bulir and Hamann 2003, 2005). By contrast, creation of trust leads to stability of flows over time, which has
benefits for the recipient economy. In the next section we seek to convert these considerations – both the determinants of trust and its consequences – into a testable model.
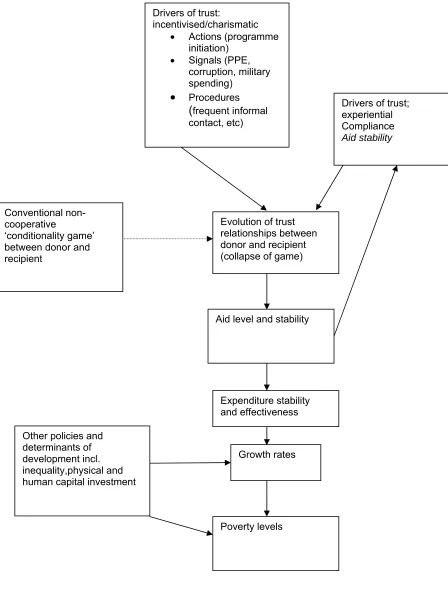
2. The model
Evolution of trust relationships between donor and recipient (collapse of game)
Drivers of trust; experiential Compliance
Aid stability
Aid level and stability Drivers of trust:
incentivised/charismatic
• Actions (programme initiation)
• Signals (PPE, corruption, military spending)
• Procedures
(frequent informal contact, etc)
Conventional non-cooperative
‘conditionality game’ between donor and recipient
Growth rates
Poverty levels Other policies and
determinants of development incl. inequality,physical and human capital investment
[image:10.595.102.550.51.642.2]Expenditure stability and effectiveness
I.The standard conditionality game, without trust
We may begin by considering the objectives of lender and recipient. The recipient government has a financial motive to maximise the inflow of finance and a political motive (as illustrated by Tables 1a and 1b) to resist at least some elements of conditionality. The recipient’s utility function is
therefore
Uj = f(t,p,X); ft<0, fp<0, fx>0 (1)
Without loss of generality we can write this as a linear function:
Uj = X – t (1a)
[image:11.595.83.514.484.726.2]where the notation is as set out in Table 3. The utility function is negative in number of conditions (t) and the proportion of them that is implemented (p) because if any policy conditions are necessary, it can be assumed that a recipient exempt from any pressure has no wish to implement any of them4. The utility function is presumed positive in X (the value of finance provided) because of an expectation that such finance will reduce the cost to him of achieving his developmental and other objectives; in the limit, if such finance cannot be secured from any other source, the country simply runs out of reserves.
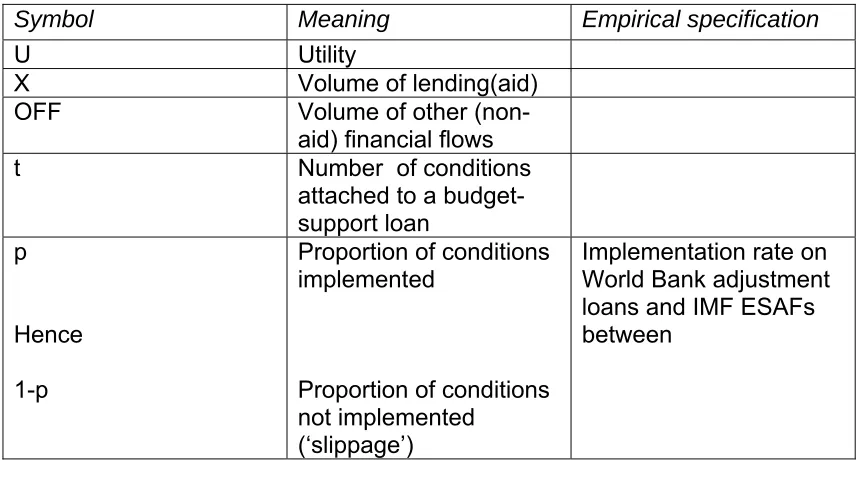
Table 3. Notation
Symbol Meaning Empirical specification
U Utility
X Volume of lending(aid)
OFF Volume of other
(non-aid) financial flows
t Number of conditions
attached to a budget-support loan
p
Hence 1-p
Proportion of conditions implemented
Proportion of conditions not implemented
(‘slippage’)
Implementation rate on World Bank adjustment loans and IMF ESAFs between
4
q Recipient’s ability to repay debt (debt-service ratio)
S Trust (social capital)
between donor and recipient
Frequency of
interruption of lending, controlling for slippage (1-p)
A Vector of factors which
determine affective (incentivised) trust:
1.‘Bona fides’: PPE
Military expenditure Corruption
2.Initiator dummy 1. Procedural
variables (frequency of contact etc.)
P Vector of factors which
determine
predictive(experiential) trust:
Compliance with conditions
Aid instability
Pov poverty indicator Headcount
Under 5 mortality
I Inequality indicator Gini coefficient
The utility of the lender is expected to vary positively with volume of lending: in particular because economic performance in the recipient country is conceived by the donor as varying positively with amount of lending
achieved, and because the reputations and control over resources of donor staff working in operational departments increase as the volume of business done by their department grows (Mosley, Harrigan and Toye 1995, Chapter 3). But a sustained growth of lending, of course, requires that clients remain able to repay loans, and this requirement acts as a constraint on the
implementation of conditionality, since the interruption of a loan because of non-implementation of conditions may prejudice the ability to repay loans to the lender and all other creditors. In consequence of this conflict between lending and leverage, which we refer to as the creditor’s dilemma, the lender’s utility function will be influenced not only by amount of landing and conditions implemented, but also by the recipient’s ability to repay debt (q)
Ui = g(tp, q, X); gt >0, gx>0, gp>0, gg>0 (2)
which by analogy with (1) can be linearised as
Ui = X + tp (2a)
Figure 1b5, and it can be readily shown (see Appendix) that in the equilibrium solution of this game, the volume of lending depends on tightness t,
implementation p (the negative of slippage), and the parameter of the recipient’s utility function . In a linearised version, the reduced form of the game’s solution may be written as:
X = constant + a1 t + a2p + a3 (3)
5
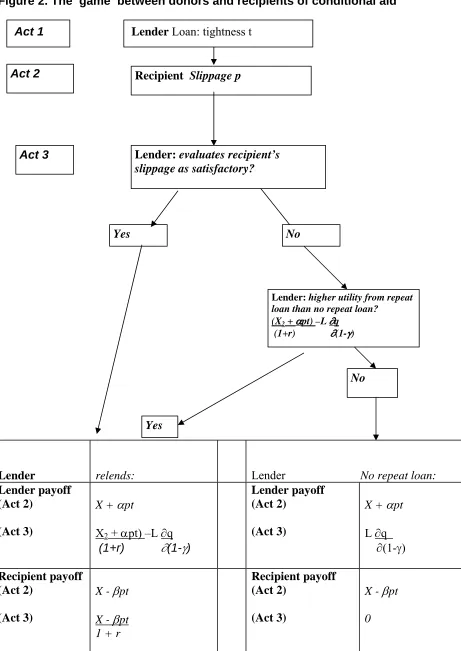
Figure 2. The ‘game’ between donors and recipients of conditional aid
Act 1 Lender Loan: tightness t
Act 2 Recipient Slippage p
Act 3 Lender: evaluates recipient’s
slippage as satisfactory?
Yes No
Lender: higher utility from repeat loan than no repeat loan?
(X2 + αpt) –L ∂q (1+r) ∂(1-γ)
Yes
No
Lender relends:
Lender No repeat loan: Lender payoff
(Act 2)
(Act 3)
X + αpt
X2 + αpt) –L ∂q
(1+r) ∂(1-γ)
Lender payoff (Act 2)
(Act 3)
X + αpt
L ∂q ∂(1-γ)
Recipient payoff (Act 2)
(Act 3)
X - βpt
X - βpt 1 + r
Recipient payoff (Act 2)
(Act 3)
X - βpt
II. The determinants of trust
The conditionality game described above is played as a
non-cooperative game, unclouded by any concerns of reciprocity, friendship or trust. However, such trust, as we have discussed, may indeed be present between the participants in conditionality negotiations, and in the transition from Figures 1a and 1b to Figure 2 above it was fundamental to causing the game to break down, and thence to the volume, the stability and thence the effectiveness of the concessional resources transferred. Analytically, what we visualise is that the parameters and (donor and recipient utility) will in practice vary not only with the factors described above, but also with the trust which each negotiating party has in the other. This immediately raises the question of how trust is measured, determined and created, all of which questions have proved contentious within the social capital literature: Glaeser (2002:437), for example, report that ‘there does not yet exist a commonly accepted theoretical framework for thinking about the determinants of
investment in social capital’. Our response is, at the level of measurement, to represent the level of trust between donor and recipient in terms of the
stability or frequency of interruption of the relationship. At the level of
prediction, as previously discussed, we partition trust (or social capital, S) into predictive and affective elements:
= f (S). S= a5 + a6P + a7 A (4)
where P and A are vectors of ‘experience’ variables which respectively explain experiential trust (explicable in terms of past experience of the other party) and predictive/incentivised trust (explicable by other factors, including interpersonal affect, and opportunities for insurance and verification)
respectively. Once we investigate by case-study methods the processes by which trust appears to be effectively built up in international negotiations (section 4) we encounter some surprises. For example, a good track-record in complying with conditions (low slippage (1-p), in the notation of equations (1) and (2)) does not necessarily build up trust, nor does a poor record of
compliance with conditions destroy trust. Uganda in the late 1980s and early 90s persisted with fixed exchange rates and with export taxes on coffee, both of which were anathema to the Bank, and Ethiopia, in addition to fixed
exchange rates, kept land and agricultural credit within the public sector against the Bank’s advice. What mattered was that the governments of those countries, at a time when the donor community was moving over towards the poverty targets of the Millennium Development Goals as primary beacons for development policy, not only adopted but initiated poverty reduction strategies of their own. This generated predictive trust: in additional cases, other factors were also crucial, including personal warmth between the negotiators for the donor and the recipient. The blending of the two types of trust – in the case of the World Bank and Ethiopia - is nicely illustrated by Joseph Stiglitz’s account of his meetings with President Meles Zenawi in the middle 1990s, which
‘A doctor by training, Meles had formally studied economics because he knew that to bring his country out of centuries of poverty would require nothing less than economic
transformation, and he demonstrated a knowledge of economics – and indeed a creativity – that would have put him at the head of any of my university classes. He showed a deeper understanding of economic principles – and certainly a greater knowledge of the
circumstances in his country – than many of the international economic bureaucrats that I had to deal with in the succeeding three years. Meles combined these attributes with personal integrity: no-one doubted his honesty and there were few accusations of corruption within his government….His political opponents raised questions about his commitment to democratic principles, but he was not an old-fashioned autocrat. Both he and the government were generally committed to a process of decentralisation, bringing government closer to the people…[and] the World Bank had direct evidence of the competence of the government and its commitment to the poor. Ethiopia had formulated a rural development strategy, focussing its attention on the poor, and especially the 85 per cent of the population living in the rural sector. It had dramatically cut back on military expenditure…because it know that funds spent on weapons were funds that could not be spent on fighting poverty. Surely, this was precisely the kind of government to which the international community should have been giving
assistance6’. (Stiglitz 2003, pp 26-28; emphasis added)
In the empirical work of Sections 3 and 4 we also discover that procedural factors (such as the frequency of meetings between donor and recipient, and whether the donor had an office in the recipient country), as well as policy and experiential factors, help to determine the build-up or otherwise of affective trust between donors and recipients of conditional programme assistance. III. Conditionality and Aid flows
We expect that where trust is low and programme aid flows are often interrupted, the effectiveness (rate of return) on those aid flows, in terms of their growth impact, will be less:
G = a8 + a9 X + a10 x(P, A) + a11S + standard new growth-theory variables
(5)
Note the role of aid instability x, driven by predictive and affective trust
between the aid donor and recipient P and A. iv. Determinants of poverty
Finally, poverty (equation (6)) is driven by growth and other factors which influence the level of the growth elasticity in particular countries. Some of the factors which influence the poverty elasticity will be policy variables –
including the ones which influence affective and predictive trust, such as pro-poor expenditure. Other proven ‘confounders’ of the growth-poverty
relationship include inequality (Hanmer and Naschold 2000), and corruption (Mosley, Hudson and Verschoor, 2004) . We have included these
confounders in the specification of equation (6).
6
Pov = a12 + a13G + a14I (6)
These six relationships (the last specified with two different definitions of poverty, the headcount and infant mortality), plus an equation to endogenise the Gini coefficient of inequality in (6) make up the model estimated in the next section.
3. Tests: econometric
As there are simultaneities in the system, portrayed in Figure 1, we estimate the model consisting of (3) (4) (5) and (6) by three-stage least
squares (table 4), with allowance made for country and time fixed effects. The estimation is made for the period 1985-2004 in relation to a group of fourteen countries in Africa which received budget support aid under the guidance of both the Bank and the IMF: the ESAF(Enhanced Structural Adjustment Facility) countries, now known as PRGF (Poverty Reduction and Growth) countries. A word must be said about two of the variables before the results are presented. Budget support aid, here, is simply concessional support provided by the IMF (through SAF/ESAF/ PRGF/HIPC) and the World Bank (through structural adjustment operations, sectoral adjustment operations, and other policy-based operations such as reconstruction loans). No programme assistance from regional development banks or bilateral donors is included, although this is generally provided in support of operations by the Washington institutions and so can be expected to correlate strongly with their
disbursements. Secondly, compliance with conditionality , measured as the proportion of conditions that is implemented, needs to be understood as an attempt to hit a moving target. Whereas the performance criteria (policy conditions) imposed by the IMF have gently evolved over the twenty years of our survey in the ‘more micro’ direction of greater usage of tax increases and public enterprise reform, those imposed by the Bank have evolved very radically from market liberalisation into the much broader territory of, in particular, governance and poverty reduction. In the process the Bank’s
yardstick for the assessment of policy has evolved into the multi-faceted CPIA (Country performance and Institutional Assessment) index, and it is this
yardstick which has been used for compliance assessments made after 20007.
7
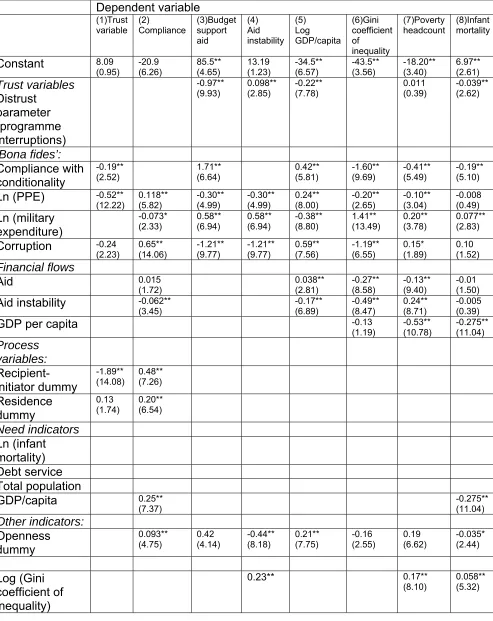
Table 4. Results of SE regression analysis: poverty, growth, and aid characteristics
Estimation method. 3SLS. Dataset consists of panel data running from 1986 to 2004.
Dependent variable
(1)Trust variable (2) Compliance (3)Budget support aid (4) Aid instability (5) Log GDP/capita (6)Gini coefficient of inequality (7)Poverty headcount (8)Infant mortality
Constant 8.09 (0.95) -20.9 (6.26) 85.5** (4.65) 13.19 (1.23) -34.5** (6.57) -43.5** (3.56) -18.20** (3.40) 6.97** (2.61) Trust variables Distrust parameter (programme interruptions) -0.97** (9.93) 0.098** (2.85) -0.22** (7.78) 0.011 (0.39) -0.039** (2.62) ‘Bona fides’: Compliance with conditionality -0.19** (2.52) 1.71** (6.64) 0.42** (5.81) -1.60** (9.69) -0.41** (5.49) -0.19** (5.10)
Ln (PPE) -0.52** (12.22) 0.118** (5.82) -0.30** (4.99) -0.30** (4.99) 0.24** (8.00) -0.20** (2.65) -0.10** (3.04) -0.008 (0.49) Ln (military expenditure) -0.073* (2.33) 0.58** (6.94) 0.58** (6.94) -0.38** (8.80) 1.41** (13.49) 0.20** (3.78) 0.077** (2.83)
Corruption -0.24 (2.23) 0.65** (14.06) -1.21** (9.77) -1.21** (9.77) 0.59** (7.56) -1.19** (6.55) 0.15* (1.89) 0.10 (1.52) Financial flows
Aid 0.015
(1.72) 0.038** (2.81) -0.27** (8.58) -0.13** (9.40) -0.01 (1.50)
Aid instability -0.062** (3.45) -0.17** (6.89) -0.49** (8.47) 0.24** (8.71) -0.005 (0.39)
GDP per capita -0.13
(1.19) -0.53** (10.78) -0.275** (11.04) Process variables: Recipient-initiator dummy -1.89** (14.08) 0.48** (7.26) Residence dummy 0.13 (1.74) 0.20** (6.54) Need indicators Ln (infant mortality) Debt service Total population
GDP/capita 0.25**
(7.37) -0.275** (11.04) Other indicators: Openness dummy 0.093** (4.75) 0.42 (4.14) -0.44** (8.18) 0.21** (7.75) -0.16 (2.55) 0.19 (6.62) -0.035* (2.44) Log (Gini coefficient of inequality)
0.23** 0.17**
(8.10)
Time fixed effects -0.0051 (1.20) 0.011** (6.90) -0.045
(4.99) -0.004 (0.87)
0.02** (7.90) 0.021** (3.47) 0.012** (4.70) -0.0003 (0.27) Country fixed effects 0.058** (6.88) 0.004 (1.40) 0.043*
(2.03) 0.054** (4.80)
-0.007 (1.43) 0.026* (2.11) 0.071** (13.26) 0.002 (0.002) No. observations
215 215 215 215 215 215 215 215
(Pseudo)R2 0.7888 0.6038 0.4923 0.6084 0.3576 0.7967 0.6989 0.7272
P 0.0000 0.0000 0.0000 0.0000 0.0000 0.0000 0.0000
Estimation method. 3SLS
Variable definitions ( source is World Bank World Development Indicators CD-ROM unless stated):
Budget support aid: gross annual disbursements, from World Bank and IMF Annual Reports
and project performance audit reports (database In Appendix)
Aid instability: coefficient of variation of disbursements, from World Bank and IMF Annual Reports and project performance audit reports (database In Appendix)
Compliance with conditionality: percentage of conditions implemented. From miscellaneous sources (see Appendix)
Residence dummy: 1 if IMF maintains a resident mission in country stated, 0 otherwise. From Mecagni(1999), table
Recipient-initiator dummy: 1 if the recipient government initiates significant components of the government’s poverty reduction strategy paper, 0 otherwise.
Openness index: the Sachs-Warner indicator.
PPE: ‘pro-poor expenditure’, consisting of the share of primary health and education, rural water and sanitation, agricultural research and extension, and social protection, less military expenditure, in total government spending. For full details of the construction of the index see Mosley, Hudson and Verschoor (2004), appendix 1.
The main inferences from Table 4 are the following.
First, trust, in the sense of the frequency of programme interruptions, is heavily influenced by recipient charisma and initiative (the initiator dummy); several ‘signals of good intent’, including pro-poor expenditure, and low levels of corruption8. Trust is more robustly associated with these ‘bona fides’ than it is with compliance with conditionality, which is only just a significant influence (at the 5% level).
Second, the results in the third and fourth equations strongly support our hypothesis that trust and not just compliance matter for the level and stability of aid disbursements. In the aid flow equation (3) the (dis)trust variable
impacts with greater significance than the compliance variable.
Third, not only the level but the stability of aid flows strongly influence welfare outcomes, and in particular growth and poverty. In these regressions, aid is a strongly negative influence on both inequality and headcount poverty,
controlling for the level of ‘bona fides’, openness and country and time fixed effects.
8
Putting these findings together, it can be said with some confidence that the achievement of higher levels of mutual trust between aid donors and
4. Evidence from country case-studies
In this section we elaborate on our econometric work by
presenting evidence of a more qualitative and anecdotal kind. In table 5, we present evidence of this type not for all of the thirty-nine countries in Section 3 but only for six – three (Ethiopia, Uganda, Ghana) whose relationships with donors became, over the period, more trusting and stable and three (Malawi, Kenya, Zambia) for whom they were less so. The discriminators presented as explanations of performance in the left-hand column are the same as those used in Table 4.Table 5. Case-study countries: experience of budget support operations, determinants of trust and aid-effectiveness
(data period: 1980-2003)
High trust, low volatility Low trust, high volatility
Uganda Ghan
a
Ethiopia Malawi Zambia Kenya
Aid indicators:
Aid/GDP% 9.2 5.6 12.1 16.6 11.6 6.5
Aid volatility parameter (sd) (c of v)
6.49 69.5 4.1 73.2 5.44 44.6 8.90 53.6 12.90 111.2 3.55 53.8 Indicators of relationship with aid donors and of performance:
CPIA(2002) Very good Good Good Moderate Modera te Poor Conditionality on adjustment lending: Agricultural policy Privatisation Governance Public expenditure prioritisation PRSP
Overall score for slippage on conditionality (1-p) ** ** ** ***
yes yes
Expenditure stability (pro-poor sectors)%
26.7 26.9 (44.3)
Outcome indicators:
Poverty reduction 1990-2000(or nearest available period)
Decline from
56%(1992) to
35%(2000) , possible increase thereafter
Minor declin e
Decline from 51 to 44%?1992 -2000
Increase from 54% (1990) to 65% (1998)
Increas e 68%(19 91) to 72% (1996)
Increase 46% (1992) to 50% (1998)
Annual average GDP growth 1990-2000 (or nearest available period)
7.2 4.3 4.8 4.0 1.0 2.2
Sources: Aid data from OECD Development Assistance Committee database.
Trust score is a measure of interruptions on IMF and World Bank budget support lending, see notes to Table 4 above.CPIA (Country Policy and Institutional Assessment) score from Collier (2001), table 3, p1796. All other data from World Bank, World Development Indicators 2003, CD-ROM.
At first sight it might seem from table 5 as though the principal
difference between the three cases of pro-poor growth on the left-hand side of the table and the three cases of lower growth, and increasing poverty, on the right-hand side of the table consisted of worse policies, reflected in lower compliance with conditionality, which then led to lower and more unstable aid flows. And indeed, there is quite a significant correlation, between low
However, this recommendation is superficial, as it conceals the
dynamics by which rapid and stable growth of aid flows has been achieved in some countries and not in others with very similar initial conditions. In Figure 4 (mislabelled as ‘Figure 8’ in original) we contrast four of these countries, whose compliance with loan conditionality in the middle 1990s was very similar, at about 50-60%, but whose economic performance, and relationships with aid donors, evolved in highly contrasted fashion. The first two appear in the ‘poverty reduction’ group in Table 5, Uganda, where compliance
increased over time but aid volatility was always moderate and Ethiopia, where compliance increased over time but aid volatility diminished
be identified which caused these trust-relationships to develop and to disintegrate:
(i) willingness(or lack of it) to target public expenditure in a pro-poor direction; (ii) levels of corruption in the public service;
(iii)willingness (or lack of it) on the part of the recipient to take initiatives in policy formulation, rather than strike a passive attitude in relation to the donor. (iv) the personal charisma of, and chemistry between, negotiators on behalf of the donor and recipient.
The operation of these four causal factors can be illustrated in relation to the developments in the four case-study countries depicted on Figure 4. All began in the early 1990s, as mentioned, with compliance rates in the 50% - 60% range. Uganda was still adhering, in defiance of the advice of the Bank and Fund, to export taxation in coffee and to elements of a fixed exchange rate, whereas Ethiopia had equally defiantly retained state control over land and rural microfinance. In the pivotal year of 1994,however, both countries took key initatives, not paralled by other recipients, in the field of public
expenditure programming. Uganda articulated public expenditure priorities in favour of sectors designated as pro-poor (primary education and health, agricultural research and extension, rural water and infrastructure) and
Ethiopia initiated a more radical reform of public spending9, more than halving the military budget in favour of education, agriculture (with an emphasis on vulnerable environments and drought mitigation) and infrastructure.These ‘signals’ of good intention (portrayed on Figure 4) won the trust of the donors even though formal compliance on the budget support programme at the time was, as we have seen, not high, and this trust was able to sustain itself in spite of (prima facie) grave breaches of performance criteria, such as the Ethiopian government’s return to war with Eritrea, and consequent military overspend, in 2000. Trust was won and sustained through two channels, firstly by identifying a coherent strategy towards pro-poor growth (with, in both cases, a strongly pro-agriculture flavour, somewhat against the prevailing current of poverty advice within international financial institutions) and secondly by doing so proactively: the factor which we have attempted to capture in the ‘initiator dummy’ of table 2.It has been reinforced by results, notably the evidence of a long-term decline in poverty in each of these countries over the course of the nineties. In the process a level of trust has been reached in some countries, certainly in Uganda, where in the case of the World Bank recipient and donor jointly determine performance criteria rather than their being imposed by the donor (Adam and Gunning, 2002); this of course gives a recipient once in a virtuous spiral still more room for
manoeuvre10. By contrast, both in Malawi and in Zambia the obligatory poverty reduction strategy was prepared as a response to a donor demand, so that the recipients lost the initiative and encouraged the donors to focus on other skeletons in the cupboard, such as corruption and other problems of governance. In the process aid flows, lost momentum and became volatile, with stoppages in the overall flow in Malawi in 1995 and in Zambia in 1998,
9
This was accompanied by a training programme in the form of an MBA in public sector management, commissioned by the Ethiopian government from the Open University between 1995-99 and
compulsorily taken by all senior managers in the government from the president downwards.
10
and with mutual trust having been eroded, even genuine pro-poor initiatives by government, such as the Malawi Government’s Starter Pack programme for small farmers in 199911, did not yield a dividend in terms of either the magnitude or the stability of aid flows, with donors being divided about the proper manner in which to respond (Harrigan, 2003) . This discord between the donors then applied a multiplier to theexisting distrust (the variable analysed in this paper) between donor and recipient.
Various lessons emerge from these case studies. One is that the social capital between donor and recipient is influenced not only by the behaviour of individual donors and recipients, but also by the coherence or otherwise between the behaviours of the donors. In all of the countries examined but especially Malawi, the discord between the donors left the recipient unable to satisfy all of them by any set of policy actions. Malawi, classically, - and to a lesser extent Zambia and Kenya also - was a country where the donors could not agree, and because they did not agree, the relationship between donor and recipient, and the stability and effectiveness of the aid flow to the recipient country, suffered badly. A second is that there is no direct mapping from any of the ‘bona fides’ which we have identified to mutual trust – perceptual factors matter, and genuine pro-poor initiatives may fail to break the cycle of low trust, aid instability and low support expenditure, as in Malawi even where genuinely pro-poor initiatives exist, if they are not given the right packaging. A third is that where aid was severely unstable – Malawi and Zambia - the place where the impact was felt was directly on the effectiveness of public expenditures and on the level of net inward investment: which is fragile everywhere in Africa but particularly in those environments
11
In many ways the Malawi government was the victim of poor presentation rather than poor policy. It had previously fought through the 1980s to retain against World Bank opposition, then in 1994 abandoned, a fertiliser subsidy and a smallholder rural credit administration which were both intended to overcome capital-market constraints in favour of low-income farmers. But it had no spokesperson to show how these initiatives could be represented as part of a poverty strategy, let alone a high-level one such as Tumusime-Mutabile in Uganda or Meles in Ethiopia; rather, the battle was fought purely on grounds of fiscal feasibility. Thus, when the even more pro-poor Starter Pack initiative was mooted in 1998, the Malawian government had no basis of pro-poor credibility with which to build in relation to most donors.
Starter Pack provided ‘enough free seed and fertiliser along with extension advice for all smallholders to cultivate 0.1ha of staple grains… and legumes’ (Harrigan, 2003: 856); but the World Bank did not support the programme, neither did any other donor subscribe to it except, briefly, DFID11, and the programme had to be drastically scaled down from the millennium onwards. From this year onwards,when a high-water mark of nearly 2 tons/hectare maize yields was reached, hybrid seed planting was abandoned, smallholder yields fell progressively and had halved by 2003. Much of the recent increase in poverty in Malawi (table 5) is to be explained in these terms.Malawian
where such a large component of public expenditure as that financed by aid cannot be depended upon.
5. Policy conclusions and recommendations
In the wake of the shift from generalised ‘adjustment lending’ to a framework of programme aid centred around long-term poverty reduction operations, critiques of conditionality have gathered impetus. Proposals for reform range from abandonment of conditionality in favour of outright selectivity (Collier 1999, Collier and Dollar 2002), to reduction of the number of conditions within a long-term framework and their unbundling into ‘policy clusters’ such as macro, budget and equity (Leandro et al. 1999) to joint determination of performance criteria on the Ugandan model (Adam and Gunning 2002).
The approach taken here rejects the first of these proposals, and argues that the second and third are already on the way to being realised through the new conditionalities that the World Bank and the bilaterals, at any rate, are currently practising. More radically, it argues that what is important for the effectiveness of budget support aid is not only aid volume and
targeting, but also stability; and that for all of these objectives and especially the last trust is the crucial variable; more crucial, on the evidence we present, than compliance with publicly stated conditions. Where trust is effectively built up, much of the conflictual basis of conventional conditionality disappears, and with it many of its efficiency costs.
This idea forces us to examine the determinants of donor-recipient trust and possible mechanisms for cultivating it, which we do within a social capital framework. We argue that trust has in practice been achieved not only
through a positive ‘social history’ but by the transmission of forward-looking ‘signals’ or ‘bona fides’ concerning fundamentals, which we infer, on the strength of our statistical analysis, to be high pro-poor expenditure, low military expenditure, and low corruption. If these are present, trust builds and budget support aid is stable, and slippage on overt conditionality is forgiven – as a rule. But there are outliers to this trend, as our case-study analysis demonstrates: some countries have sent pro-poor signals but been rebuffed by donors, resulting in stop-go. More positively, initiative-taking and charisma in defence of pro-poor options have often been effective in keeping aid stable in despite of massive non-compliance; so also have been procedural reforms such as the spread of IMF resident missions12. Where aid is stable, growth and poverty reduction performance are enhanced.
The implication is that there is still an aid multiplier to be derived from the conversion of guns into butter and other pro-poor expenditure reforms, and that contrary to Collier’s proposals (1999, 2002),conditionality has been instrumental in achieving this process, as our case studies show (see also Mosley, Hudson and Verschoor(2004)). This however has not been
12
orthodox conditionality but a kind of shadow conditionality, focussed on targets other than those formally announced as performance criteria and requiring recipients to be able to read between the lines. Those that have been able to master this art have earned impressive rewards, and a further growth and poverty dividend could be achieved by getting the true
Bibliography
Adam, Christopher, and Jan Willem Gunning (2002) ‘Redesigning the aid contract: donors’ use of performance indicators in Uganda’, World
Development, vol. 30, pp. 2045-2056.
Arrow, Kenneth, ‘Gifts and exchanges’, Philosophy and Public Affairs, vol. 1(4)pp. 343-362.
Barr, Abigail(2003) ‘Trust and expected trustworthiness: experimental evidence from Zimbabwean villages’, Economic Journal, vol. 113, 614-631. Brautigam, Deborah, and Stephen Knack(2004) ‘Foreign aid, institutions, and governance in sub-saharan Africa’, Economic Development and Cultural Change, vol. , pp. 255-285.
Bulir, A., and J. Hamann (2003) ‘Aid volatility: an empirical assessment’, IMF Staff Papers, vol 50:1,pp 64-89.
Bulir, A., and J.Hamann (2005) ‘Volatility of development aid: from the frying pan into the fire?’ Washington DC: IMF, unpublished paper. Collier, P. (1997) ‘The failure of conditionality’ in C. Gwin and J.
Nelson(eds.) Perspectives on aid and development, Washington DC: Overseas Development Council.
Collier, P. and D. Dollar(2001) ‘Can the world cut poverty in half? How
policy reform and effective aid can meet international development goals’, World Development, vol. 29, pp. 1787-1802.
Collier, P. and D. Dollar(2002) ‘Aid allocation and poverty reduction’, European Economic Review, vol. 46, pp. 1475-1500.
Faulkner, Paul(2004) A problem of trust. Unpublished paper, Department of Philosophy, University of Sheffield.
Gambetta, Diego (1988): Trust: making and breaking co-operative relations, London: Basil Blackwell.
Glaeser, Edward, David Laibson, Jose Scheinkman and Christine
Soutter(2000) ‘Measuring trust’, Quarterly Journal of Economics, vol. 115 , pp. 811-845.
Glaeser, Edward, David Laibson and Bruce Sacerdote (2002) ‘An economic approach to social capital’, Economic Journal, vol. 112, pp. 437-458.
Harrigan, Jane, 2003,’U-turns and full circles; two decades of agricultural reform in Malawi 1981-2000’, World Development, vol. 31, pp. 847-863. International Monetary Fund (1998?) External Evaluation of the ESAF [Enhanced Structural Adjustment Facility] Report by a group of independent experts (K. Botchwey, P.Collier, J. Gunning, K. Hamada) Washington DC: IMF.
Kahneman, Daniel, (2003) ‘Maps of bounded rationality: psychology for behavioural economics’, American Economic Review, vol.93 (December), 1449-1475.
Knack, Stephen, and Philip Keefer, 1997, ‘Does social capital have an economic payoff?’ A cross-country investigation’ Quarterly Journal of Economics, vol. 112, pp. 1251-1288.
Kreps, David, Paul Milgrom, John Roberts and Robert Wilson(1982) ‘Rational cooperation in the finitely repeated prisoners’ dilemma’, Journal of Economic Theory, vol. 27, pp. 245-252.
Leandro, J., H. Schafer and G. Frontini(1999) ‘Towards a more effective conditionality: an operational framework’, World Development, vol. 27, pp. 285-300.
Luthra, M.(2004), Alternative perspectives on the role of trade, investment and business solutions in poverty reduction in Africa, London: Department of Trade and Industry, UK Trade and Investment. Available at
www.uktradeinvest.gov.uk
Mecagni, Mario(1999) ‘The causes of programme interruptions’. Chapter 9 in H. Bredenkamp and S.Schadler(eds) Economic adjustment and reform in low-income countries: studies by the staff of the International Monetary Fund. Washington D.C. IMF.
Morrissey, Oliver, and Arjan Verschoor (2002), ‘Is ownership a meaningful concept in policy reform? Policy learning and the evolution of pro-poor policies in Uganda’, unpublished paper.
Mosley, Paul, Jane Harrigan and John Toye(1995) Aid and power: the World Bank and policy-based lending, London: Routledge, 2 vols.
Mosley, Paul, John Hudson and Arjan Verschoor(2004) ‘Aid, poverty reduction and the “new conditionality” ’,Economic Journal, vol. 114, pp. 217-243.
Mosley, Paul and John Hudson, (2005), Assessing the volatility of
international aid flows, unpublished report for Department of International Development.
Stewart, Frances (2003) ‘An analysis of Poverty Reduction Strategy Papers’. Paper presented to conference on the World Bank and IMF, Yale University, April. To be published by Yale University Press. Available at
www.yale.edu/ycias.
Stiglitz, Joseph, (2003) Globalisation and its discontents, London: Penguin. Vaughan, Megan(1984) The history of an African famine: Malawi 1949, Cambridge: Cambridge University Press.
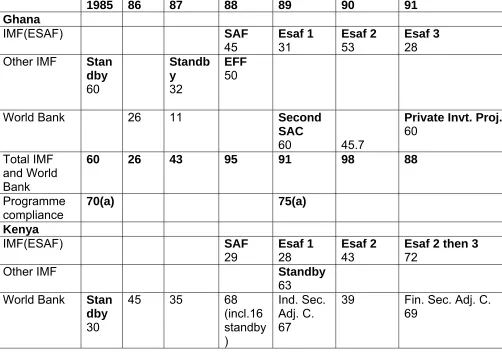
Appendix. Aid and adjustment data, 1985-2005
(1)Numbers following loan name are estimated disbursements in $ million; names of credits apply to operations which began in year stated. For IMF operations disbursement is interpreted as the year –on-year change in the ‘undrawn balance’ of the loan; for World Bank operations disbursements must in general be inferred from Project Performance Audit Reports.
(2) For the World Bank, all structural, sector adjustment and multisector loans are included. After approximately 1999 Bank terminology changes and the expression ‘adjustment lending’ disappears from Bank vocabulary and the disbursements recorded here relate to concessional credits with policy conditions attached in the fields of: (poverty reduction and) economic
management; public sector governance; and the ‘pro-poor’ sectors (primary health, primary education, agriculture and social protection)
(3) Figures relate to calendar years but are estimated from IMF and World Bank financial years ending on 30 April of year stated.
[image:34.595.87.589.392.745.2](4) Sources for programme compliance: (a)Mosley, Harrigan and Toye 1995, table 5.6 page ; (b)Mosley 1996, appendix table 1 pp. 430-440; (c)Mecagni 1999, appendix ;(c) Mecagni 1999, table 9.16; (d) World Bank CPIA index, as recorded by Collier (2000), page
(5)Programme interruptions are shaded.
1985 86 87 88 89 90 91
Ghana
IMF(ESAF) SAF
45 Esaf 1 31 Esaf 2 53 Esaf 3 28 Other IMF Stan
dby 60 Standb y 32 EFF 50
World Bank 26 11 Second
SAC
60 45.7
Private Invt. Proj. 60
Total IMF and World Bank
60 26 43 95 91 98 88
Programme compliance
70(a) 75(a)
Kenya
IMF(ESAF) SAF
29
Esaf 1 28
Esaf 2 43
Esaf 2 then 3 72
Other IMF Standby
63 World Bank Stan
dby 30
45 35 68
(incl.16 standby ) Ind. Sec. Adj. C. 67
Total IMF and World Bank
30 45 35 97 158 82 141
Programme compliance
a)60 a)22
Malawi
IMF(ESAF) Esaf 1 Esaf 1
and 2 8 Other IMF EFF
28 EFF 28 Standb y 10 Standby 10 Esaf 2 and 3 19 Esaf 3 7
World Bank 27 35 40 Industrial
and Trade Adjustme nt Credit 54
20 Agric. Sector
Adj. Programme 64
Total IMF and World Bank
28 55 35 50 74 39 71
Programme compliance
55(a) 30(a)
Mozambique
IMF(ESAF) SAF1
10 SAF1/2 20 SAF2/3 XX No drawings SAF 3 12 Other IMF
World Bank Second
Rehabil itation Credit 40 20 Industrial Sector Adjustme nt Credit 40 35 Total IMF and World Bank
10 60 20 52 35
Programme compliance
Tanzania
IMF(ESAF) SAF
21 SAF 32 SAF 21 Other IMF
World Bank 40 Multisec
tor Rehabili tation Credit 25
10 60 30 Ag. Sector
Adj.
Total IMF and World Bank
40 25 31 92 51 120
Programme compliance
85 86 87 88 89 90 91
Zimbabwe
IMF(ESAF) Other IMF World Bank Total IMF and World Bank
0 0 0 0 0 0
Programme compliance
Zambia IMF(ESAF)
Other IMF Stan
dby 35
Standby 35 World Bank
35
Industri al Sector Adjust ment Credit 35
14 17 Economic Recovery
Programme 99
Total IMF and World Bank
70 35 35 14 17 99
Programme compliance
Ethiopia
IMF(ESAF) Other IMF World Bank Total IMF and World Bank
0 0 0 0 0 0
Programme compliance
Uganda
IMF(ESAF)
Other IMF SAF
23
ESAF 10
ESAF 54
World Bank Econo mic Recove ry Progra mme
20 20 25
Economic Recovery Credit
138 Total IMF
and World Bank
0 0 0 43 33 79 175
Programme compliance
Sierra Leone
IMF(ESAF) SAF1 6
SAF1 6
X 9/87 11
4/94
Other IMF
World Bank 5
Total IMF and World Bank
0 11 11 0 0 0 0
Programme compliance
85 86 87 88 89 90 91
Lesotho
IMF(ESAF)
Other IMF SAF
3
SAF 7
World Bank 10
Total IMF and World Bank
3 7 10
Programme compliance Nigeria IMF(ESAF)
Other IMF Standby
XJan-Dec87
Standby X Jan-Dec 89
Standby XJan-Dec 91 World Bank
Total IMF and World Bank
0 0 0 0 0 0 0
Programme compliance Cote
Other IMF Standby: 53 Standby: 24 Standby: 7 Standby: 31 World Bank Total IMF and World Bank
53 24 7 0 31
Programme compliance
Senegal
IMF(ESAF) SAF1
17 SAF1/2 43 SAF2 12 ESAF1 11 ESAF2 62 ESAF3 38 Other IMF
World Bank Standby 22
Standby 44
22 Standby
13
Supplement to SAC3
SAC4
44 47
Total IMF and World Bank
22 61 65 25 11 106 85
Programme compliance
1992 93 94 95 96 97 98
Ghana
IMF(ESAF) Esaf:30 Esaf:27 Esaf:1
Other IMF
World Bank Second Fin. Sec. Adj. 110 Private Enterprise and Export Devt. 71 Ag. Sec Investment Proj. 46 Total IMF and World Bank
110 71 46 30 27 1
Programme compliance
64(b)
Kenya
IMF(ESAF) Esaf 3 75
X 3/93 to 12/93
Esaf 4 Esaf 5:
X1/96-12/96 Esaf 5: 25 Esaf5: X1/98-12/98
Other IMF SDA:20 SDA:16
World Bank Ed. Sec. Adj. P.80
26 97 Total IMF
and World Bank
115 26 97 0 0 45 16
Programme compliance
Malawi IMF(ESAF)
Other IMF Esaf 4 35
Esaf 4
25 10
Esaf 5:7 Esaf 5:13
Esaf 5:4
World Bank 35 0 0 286 18
Total IMF and World Bank
70 25 10 286 31 4
Programme compliance
56(b)
Mozambique
IMF(ESAF) Esaf2 40 Esaf3 85 X1/94 to 6/94, then Esaf 4 15 Esaf 4 Other IMF
World Bank Economic Recovery Programme
80 50 40 10
Second Economic Recovery Programme
90 50+ 60+
Total IMF and World Bank
120 135 55 10 90 50 60
Programme compliance
65(c) 75(b)
Tanzania
IMF(ESAF) Esaf 1 and 2 20 Esaf 2 85 ESAF 2 11 Esaf3: 26 Esaf3: 14
Other IMF SDA:27
World Bank Financial sector Adj. Programme 170
120 61 0
Total IMF and World Bank
190 205 72 0 53 14
Programme compliance
38(b)
92 93 94 95 96 97 98
Zimbabwe
IMF(ESAF) Esaf 1:70 Esaf1:34 Esaf2:48 X3/95 12/96
Other IMF EFF:31 GRA:
15
World Bank SAC1 40
SAC2
55 15 40
Total IMF and World Bank
110 120 63 40 15 18
Programme compliance
50% 14%
Zambia
IMF(ESAF) Esaf:280 Esaf:150 Esaf:
230
X1/98 to 12/98 Other IMF Standby
80
World Bank Privatisation and Industrial Reform Credit 210
65 95 50 338 245
Total IMF and World Bank
290 65 95 330 488 475
Programme compliance
42
Ethiopia
IMF(ESAF) SAF
14 SAF 21 ESAF 1:15 X1/98 to 12/98 Other IMF
World Bank Emergency reconstruction 95
Struct. Adjustment credit
105 100 120
105 60 65
Total IMF and World Bank
95 119 121 120 105 60 65
Programme compliance
70
Uganda
IMF(ESAF) 95 20 ESAF
1:21 ESAF 1: 43 ESAF 2:initi ated ESAF2: 40 Other IMF
World Bank Structural Adjustment Credit 100 Financial Sector adjustment 131 Second SAC 130
Total IMF and World Bank
195 151 102 70 42 140
Programme compliance
76
Sierra Leone
IMF(ESAF) X9/87 4/94,
then ESAF1 63
X3/95-12/95
ESAF2 82
Other IMF
World Bank Reconstructio n Import Credit: 43
Structura l
Adjustm ent Credit
35 30 40
Total IMF and World Bank
43 0 38 30 40
Programme compliance
16
92 93 94 95 96 97 98
Lesotho
IMF(ESAF) 5 5 8
Other IMF GRA:3 SDA:5 SDA:3
World Bank Private
sector devt. 11 Total IMF
and World Bank
5 5 19 3 0 5 3
Programme compliance
Nigeria IMF(ESAF)
Other IMF
World Bank 30 20 38 6 0 10 6
Other multilateral and
bilateral
30 20 38 6 0 10 6
Programme compliance
Cote d’Ivoire
IMF(ESAF) ESAF:60 ESAF:59 ESAF:119 ESAF:22 New
ESAF:83 Other IMF Standby:
33
World Bank Financial Sector Adjustment 65
40 62 70 24
Total World Bank and IMF
98 40 122 129 143 22 83
Programme compliance
34
Senegal
IMF(ESAF) SAF3
X6/92 6/94
20
ESAF1 30
ESAF2 21
Other IMF
World Bank 5 0 Economic Recovery Credit 40
20+
Total World Bank and IMF
5 0 60 50 21 0 0
Programme compliance
na
99 2000 01 02 03 04
Ghana IMF(ESAF/PRGF) Esaf:22 Esaf:23 PRGF 1:
70
PRGF 2:53 Other IMF
World Bank 137 66 109 165 290
Total World Bank and IMF
159 89 179 165 290 53
Programme compliance
Good(CPIA) 3.49(CPIA)
Kenya
IMF(ESAF/PRGF) PRGF1:34
X1/02-12/02
PRGF2:36
Other IMF
World Bank 85 45 50
Total World Bank and IMF
Programme compliance
Poor(CPIA) 2.71(CPIA)
Malawi
IMF(ESAF/PRGF) ESAF:7 X1/02 12/03 ESAF
:13 Other IMF HIPC:3
World Bank 83 42 83 33 23
Total World Bank and IMF
93 42 83 33 23 13
Programme compliance
Mod(CPIA) 3.29(CPIA)
Mozambique
IMF(ESAF/PRGF) Other IMF
World Bank 21 36 20 14 145
Total World Bank and IMF
Programme compliance
Mod(CPIA) 3.32(CPIA)
Tanzania
IMF(ESAF/PRGF) ESAF 4:20 PRGF1:30 PRGF1:30 PRGF1:40 PRGF 1:20
PRGF2: 6
Other IMF HIPC:13 HIPC:69
Total World Bank and IMF
40 60 51 40 20 Other multilateral
and bilateral
60 90 81 149 40 6
Programme compliance
Mod(CPIA) 2.98(CPIA)
99 2000 01 02 03 04
Zimbabwe
IMF(ESAF)
Other IMF 5
World Bank Other multilateral and bilateral
0 5 0 0 0 0
Programme compliance
Mod(CPIA) 3.67(CPIA)
Zambia
IMF(ESAF/PRGF) ESAF:10 X1/00-12/00
PRGF:45 PRGF:50
Other IMF HIPC:117 HIPC:16 HIPC:234 SDA:37
World Bank 92 201 90 76 10
Total World Bank and IMF