M
AGNETIC
R
EPORTER
G
ENES FOR
MRI-
BASED
S
TEM
C
ELL
T
RACKING
Thesis submitted in accordance with the requirements of the
University of Liverpool for the degree of Doctor in Philosophy
by
Sofia Melo Pereira
ACKNOWLEDGMENTS
This work has been supported by an EU Marie Curie Reintegration Grant contract number PERG08-GA-2010-276909, with support from the Institute of Translational Medicine, University of Liverpool.
A special thanks to my supervisors Dr Patricia Murray and Dr Arthur Taylor for creating a very interesting project and seeing the potential in me to fulfil it. All the wisdom and support given were essential to achieve this goal. Also, thank you to Prof David Edgar for all support given during lab meetings.
Thank you to Maria Christofi and Zohra Butt for helping me to put this project together. For the entire stem group, a big thank you for all the support given over the years, especially to Aleksandra Rak-Raszewska, Virginie Mournetas and Ilaria Santeramo for all their work and life related advices and for making my PhD years much lighter and enjoyable. You will always be in my heart.
I would also like to thank Dr. Stuart Marshall-Clarke and Miss Carolyn Rainer for all the help and availability using the FACSAria and Mr George Miller for his help with the ICP analysis.
ABSTRACT
Introduction: Over the past decades, several labelling techniques have been used in an attempt to track stem cells using magnetic resonance imaging (MRI). However, very few of these were able to definitely determine the precise location of stem cells within a living organism and monitor throughout a long term period, without loss or diffusion of the signal. A novel MRI cell tracking method described in 2005 proposed that reporter genes that could effectively increase the iron content of a target cell would allow a stronger contrast when imaged via MR. Being a fundamental part of the iron metabolism, transferrin receptor-1 (TfR-1) and ferritin heavy chain-1 (Fth-1) were naturally suggested to have the potential to increase the iron load of cells when overexpressed. More recently, there has been some interest in the reporter gene MagA, which is a known iron transporter found in magnetotactic bacteria.
Aim: To evaluate the suitability of using TfR-1, Fth-1 and MagA as potential magnetic reporter genes for MRI-based cell tracking.
a model organism, the chick embryo.
Results: After analysing all three potential magnetic reporters, TfR-1 was found to be the most promising, as its overexpression induced an adjustment of iron homeostasis in Chinese hamster ovary K1 cells, leading to higher intracellular iron accumulation relative to controls. The same adjustment was found in mouse mesenchymal stem cells (mMSC), but only when TfR-1 was overexpressed in conjunction with Fth-1, also leading to an increase in iron retention capacity. However, a limitation was found when overexpressing Fth-1 in mMSC, as permanent iron supplementation was needed in order to keep these cells viable. In contrast with previous studies, MagA gene integration posed some restrictions in certain cell lines studied. The results presented here show that while some cell types are able to stably maintain MagA expression over several passages, others fail to survive and die shortly after transduction, suggesting that a potential toxic effect may be originating from MagA gene integration. From the surviving cells, two were compared side by side and contradictory results were obtained, demonstrating that MagA would only be a suitable magnetic reporter for some cell types.
TABLE OF CONTENTS
Acknowledgments ... I
Abstract ... II
List of Figures ... VIII
List of Tables ... XV
List of Equations ... XVI
List of Supplementary Data ... XVII
List of Hyperlinks ... XVIII
Abbreviations ... XIX
Chapter 1Introduction ... 1
Overview ... 1
1.1 Stem cell tracking and MRI ... 2
1.1.1 Magnetic resonance imaging ... 3
1.1.2 Exogenous vs. endogenous iron oxide-based contrast agents for MRI ... 5
1.1.3 Metalloprotein-based MRI reporter genes ... 6
1.2 Iron metabolism ... 8
1.2.1 Regulation of intracellular iron – IRP/IRE regulatory system ... 10
1.3 Transferrin Receptor-1 ... 13
1.3.1 Transferrin receptor-1 molecular structure and biochemistry ... 14
1.3.2 Cellular internalization of iron though transferrin/TfR-1 complex ... 15
1.3.3 Transferrin receptor-2 ... 16
1.4 Ferritin ... 17
1.4.1 Ferritin molecular structure and biochemistry ... 18
1.4.2 Ferritin internalization of iron ... 19
1.5 Magnetotactic bacteria, magnetosomes and MagA ... 20
1.5.1 Magnetosome formation ... 22
1.5.2 MagA gene ... 23
1.6 Aims ... 25
Chapter 2Materials and Methods ... 27
Overview ... 27
2.1.1 Reporter genes cDNA ... 27
2.1.2 Extraction of total RNA ... 28
2.1.3 DNase treatment of RNA ... 29
2.1.4 Synthesis of cDNA by reverse transcriptase ... 29
2.1.5 cDNA amplification by polymerase chain reaction ... 29
2.1.6 Electrophoresis by FlashGel® System ... 31
2.1.7 Cloning transgenes cDNA into pCR®II-TOPO® ... 32
2.1.8 Transformation of chemically competent cells by heat-shock ... 32
2.1.9 Analysis of transformed colonies ... 33
2.1.10 Cloning of lentiviral constructs ... 33
2.1.11 Nucleic acid purification and precipitation ... 35
2.1.12 Electrophoresis of agarose gels ... 35
2.1.13 Ligation ... 36
2.1.14 Sequence analysis ... 38
2.2 Cell Culture ... 39
2.2.1 Cell lines ... 39
2.2.2 Routine cell culture ... 39
2.2.3 Cryopreservation and recovery of cells ... 40
2.3 Generation of reporter cell lines ... 41
2.3.1 Production optimization of lentiviral particles ... 43
2.3.2 Transfection of the producer cell line ... 45
2.3.3 Concentration of lentiviral particles ... 45
2.3.4 Determination of viral titres and efficiency of transduction ... 46
2.3.5 Transduction of stem cells ... 47
2.3.6 Fluorescence Activated Cell Sorting ... 48
2.4 Evaluation of intracellular iron ... 49
2.4.1 Cell viability when exposed to ferric citrate ... 49
2.4.2 Intracellular iron quantification ... 50
2.5 Expression of transgenes at mRNA and Protein Level ... 52
2.5.1 Reverse transcription quantitative Real-Time PCR ... 52
2.5.2 Immunofluorescence ... 56
2.6 Transmission electron microscopy (TEM) analysis ... 61
2.7 Cell viability capacity ... 62
2.8 Multilineage differentiation ... 62
2.9 Animal work ... 64
2.10 Magnetic Resonance Imaging ... 65
2.10.1 Sample preparation ... 65
2.10.2 Imaging ... 65
2.11 Error bars and statistical analysis ... 66
Chapter 3Stable Integration of Reporter Genes into Established Cell Lines ... 67
3.1 Introduction ... 67
3.1.1 Transfection methods ... 67
3.1.2 Lentiviral-mediated transduction ... 69
3.1.3 Choice of lentiviral vectors ... 71
3.2 Results ... 73
3.2.1 Generation of lentiviral constructs ... 73
3.2.2 Production of lentiviral particles ... 79
3.2.3 Determination of viral titer of lentiviral particles ... 81
3.2.4 Transduction efficiency between cell lines ... 83
3.2.5 Optimization of Intracellular Iron Loading ... 87
3.3 Discussion ... 91
Chapter 4Transferrin Receptor-1 as a Reporter Gene for MRI Tracking of Cells ... 94
4.1 Introduction ... 94
4.1.1 Studies targeting transferrin receptor-1 ... 94
4.1.2 Transferrin receptor-1 as an MRI reporter gene ... 95
4.2 Results ... 98
4.2.1 Evaluation of reporter gene integration ... 98
4.2.2 Cell viability ... 103
4.2.3 Iron homeostasis ... 104
4.2.4 Intracellular Iron Uptake in vitro ... 112
4.2.5 MRI ... 114
4.3 Discussion ... 122
Chapter 5Ferritin Heavy Chain-1 and Transferrin Receptor-1 as Reporter Genes for MRI
Tracking of Cells ... 129
5.1 Introduction ... 129
5.1.1 Studies targeting ferritin heavy chain-1 ... 129
5.1.2 Ferritin heavy chain-1 gene as an MRI reporter gene ... 130
5.2 Results ... 134
5.2.1 Reporter gene integration in normal cell culture conditions ... 134
5.2.2 Reporter gene integration with iron supplementation ... 141
5.2.3 Cell viability ... 145
5.2.4 Overexpression of reporter genes at mRNA and protein level ... 147
5.2.5 Intracellular Iron Uptake in vitro ... 154
5.2.6 MRI ... 155
5.3 Discussion ... 163
5.4 Supplementary data ... 171
Chapter 6MagA as a Reporter Gene for MRI tracking of cells ... 173
6.1 Introduction ... 173
6.1.1 MagA gene as an MRI reporter gene ... 173
6.2 Results ... 177
6.2.1 Reporter gene integration in stem cell lines ... 177
6.2.2 Reporter gene integration in CHO K1 cell line ... 181
6.2.3 Iron homeostasis ... 186
6.2.4 Reporter gene stability with iron supplementation ... 191
6.2.5 Intracellular Iron Uptake in vitro ... 193
6.2.6 MRI ... 198
6.3 Discussion ... 208
6.4 Supplementary data ... 216
Chapter 7General Discussion And Conclusion ... 217
Bibliography ... 227
Appendix IcDNA sequences ... 242
Appendix IIBuffers, solutions, media, other material ... 245
LIST OF FIGURES
Figure 1 – Illustration of IRP/IRE regulatory system acting on a post-transcriptional level of two groups of genes involved in iron metabolism, ferritin and transferrin receptor-1 genes. When iron is depleted, IRPs bind to IREs present in UTRs and repress the translation, in case of ferritins, or promote mRNA stability in case of transferrin receptor-1. On the other hand, when the IRPs recognize there is an excess of iron, they unbind from the IRE, promoting the translation of ferritins and the endonucleolytic cleavage of transferrin receptor-1 mRNAs. ... 12
Figure 2 – Transmission electron microscopy of a Magnetospirillum magneticum with a magnetosome chain (A) and of isolated magnetosomes (B) with intact membranes, indicated by the arrow. Scale bars are 100 nm. Reproduced with permission from Benoit et al. (2009) (A) and from Schüler (2004) (B). ... 21
Figure 3 – Simplified illustration showing a hypothesized mechanism for membrane invagination, iron biomineralization of magnetosomes and MagA function as an iron transporter protein. Illustration based on Komeili et al. (2006). ... 23
Figure 4 – Illustration of transfection of the producer cell line HEK 293T(N) with transfer, packaging and envelope plasmids, which comprise a 2nd generation HIV-based lentiviral system. After collecting the lentiviral particles from the media, cells of interest can be transduced in a target cell line. ... 42
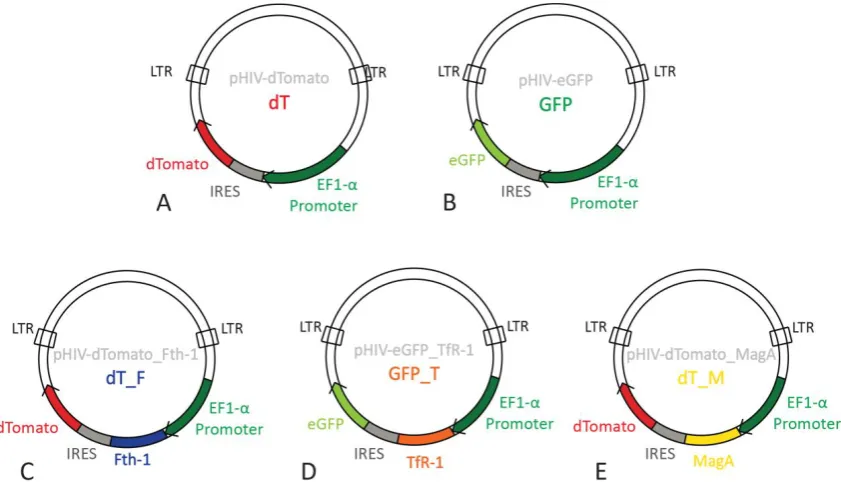
Figure 5 – Plasmid maps of parental vectors dT (A) and GFP (B) and lentiviral constructs dT_F (C), GFP_T (D) and dT_M (E). Some key features are represented, such as the fluorophore of each plasmid (dTomato or eGFP transgene) connected to the gene of interest (Fth-1/TfR-1/MagA) through an IRES to allow bicistronic expression of both genes. Also represented is the promoter elongation factor 1-alfa (EF1-α) to initiate the constitutive expression and the HIV-long terminal repeats (LTR), which flank the region to be incorporated into the host’s cell genome. ... 79
Figure 6 – Flow cytometry analysis of red (dT) and green (GFP) fluorescent populations of HEK 293T(N) cells after being transduced with the same volume of viral supernatant, produced with different plasmid ratios. Error bars represent SEM (n=3) (M&M, p.43). ... 80
Figure 7 – Flow cytometry analysis of red (dT, dT_F and dT_M) and green (GFP, GFP_T) fluorescent cells in relation to the volume of lentiviral particles used for transduction of HEK 293T(N) cells. A 40% fluorescent threshold was set and the chosen value for titration is annotated with a *. Error bars represent SEM (number of biological replicates are indicated in the legend) (M&M, p.46). ... 82
Figure 8 – Viral titer of different lentiviral preparations determined in HEK 293T(N) cells. Error bars represent SEM (number of biological replicates are indicated in the X-axis) (M&M, p.47). ... 83
Figure 10 – Viral titer of different lentiviral preparations specifically determined for each cell line (A). Error bars represent SEM where possible. Numbers of biological replicates are indicated in the table in B (M&M, p47). ... 86
Figure 11 – Cell viability evaluation of several cell lines, when exposed to increasing amounts of ferric citrate for a period of 24h (A). Absorbance is shown in relation to control cells (cultured without supplementation). The best logistic fit for each cell line is represented in the cell’s correspondent colour. The 0.2 and 2 mM marks display the chosen concentrations of ferric citrate used in further experiments, supported by the table in B. EC50 and EC80 represent the ferric citrate concentration (mM) that causes 50 and 80% cell reduction relative to control. Error bars represent SEM (n=3) (M&M, p49). ... 87
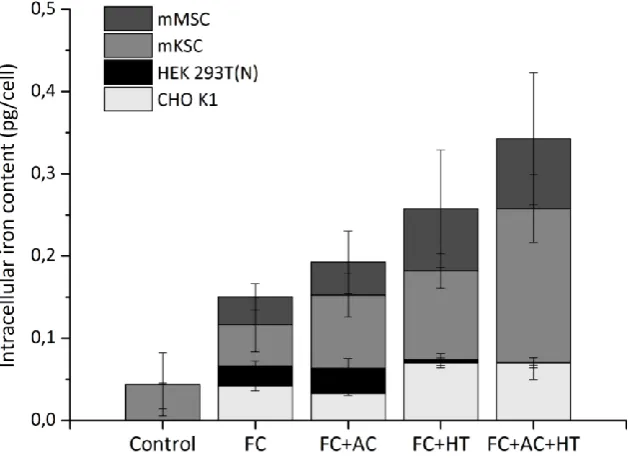
Figure 12 – Measurement of intracellular iron content of mMSC, mKSC, HEK 293T(N) and CHO K1 with different supplements: FC-0.2 mM of ferric citrate, AC-50 µM L-ascorbic acid, HL-1.28 mM human holo-transferrin. Error bars represent SEM (n=3). ... 90
Figure 13 – Control (C17s) and TFR-1/FTH-1 transfected cells (C17-12s) were supplemented with iron (1 mM of ferric citrate and 1 mg/ml holo-transferrin) for 48h before transplantation into an adult mouse brain. a – schematic representation of a coronal section of a mouse brain, indicating the injection site (is), control regions in the cortex (ctx) and striatum (str). b and c – Magnetic resonance (7 T) T2*-weighted images of ex vivo mouse brain sections, 20 days after injection. A
clear contrast is observed between injected cells and the surrounding brain tissue; analysing regions of interest within the injection site, a significant signal loss is detected for C17-12s (n=3), when compared to C17s (n=2). Reproduced with permission from Deans et al. (2006). ... 97
Figure 14 – Representative pictures of CHO K1 cells, at P3 (A) and P8 (B) post-transduction, and control cells (untransduced) at an equivalent passage. GFP corresponds to GFP transduced cells and GFP_T to TfR-1 transduced cells. All green fluorescent pictures were taken with the same exposure conditions. Scale bars correspond to 100 µm. ... 99
Figure 15 – Flow cytometry histograms of (A) CHO K1 cells, at P3 and P8 after transduction. Histograms show the number of events (cells) counted (y-axis) versus the fluorescence intensity (x-axis). Green fluorescence (GF) gate represents GFP-positive cell population plotted in B. The Xmean (C) represents the mean fluorescence obtained from the gated region (GFP cells). Error bars represent SEM (n=3); a.u. - arbitrary units; (M&M, p.48). ... 100
Figure 16 – RT-qPCR relative quantification of GFP, Viral_T and CHO_T targets in control, GFP and GFP_T transduced CHO K1 cells at P1 and P3 post-transduction. GFP and Viral_T expression values are normalised to P1 (A) and endogenous CHO_T to control cells (B). A very significant statistical decrease of endogenous TfR-1 is observed only in TfR-1 overexpressed cells (GFP_T), both at P1 and P3. Error bars represent SEM (n=3) (M&M, p.52). ... 102
Figure 17 – Viability of GFP and GFP_T transduced CHO K1 cells at P1 and P4 post-transduction. Data points are normalised to Control (untransduced) cells. Error bars represent SEM (n=3) (M&M, p.61). ... 103
Figure 18 – RT-qPCR relative quantification of transgenes GFP (A) and Viral_T (B) when GFP and GFP_T transduced cells were exposed to 0 and 0.2 mM of iron. Error bars represent SEM (n=3) (M&M, p.52). ... 105
RT-qPCR (A and C) and of total (endogenous + viral) TfR-1 (Total_T) protein levels obtained via WB (B and D), when control, GFP and GFP_T transduced cells were exposed to different iron concentrations of 0 and 0.2 mM (M&M, p.50). Graphs A and B evaluate target expression levels when each cell line is exposed to different iron concentrations and graphs C and D the difference between cell lines when exposed to the same iron concentration. Error bars represent SEM (n=3) (M&M, p.52 for RT-qPCR and p.57 for WB)... 106
Figure 20 – Representative immunofluorescence pictures of GFP_T transduced CHO K1 cells, showing nuclear staining with DAPI (A), green fluorescence (GF) obtained by GFP reporter (B) and the detection of TfR-1 proteins, visualized by red fluorescence (RF) (C). The overlay between these conditions shows that GFP reporter is mainly expressed in the nucleus (D), TfR-1 is present outside the nuclear region, more likely localized at the cellular membrane (E) and that there is a mixed population in (F), where only the high expressing GFP cells also have an overexpression of TfR-1. A higher magnification of the insets is presented on the right hand side pictures. Scale bars: 25 µm; (M&M, p.56). ... 109
Figure 21 – Relative quantification of Fth-1 (Total_F) expression obtained via RT-qPCR (A
and C) and the respective protein levels obtained via WB (B and D), when Control, GFP and GFP_T transduced cells were exposed to different iron concentrations of 0 and 0.2 mM. Graphs A and B evaluate Total_F expression levels when each cell line is exposed to different iron concentrations and graphs
C and D the difference between cell lines when exposed to the same iron concentration. Error bars represent SEM (n=3) (M&M, p.52 for RT-qPCR and p.57 for WB). ... 111
Figure 22 – Intracellular iron content of CHO K1 cells determined with the Ferrozine assay (A). Control, GFP and GFP_T transduced cells were supplemented with different iron concentrations of 0, 0.2 and 2 mM for 4 days prior to measurement (Iron supplementation, p.50). Fold-differences between GFP_T cells and Control or GFP are presented for each supplementation condition in B. Error bars represent SEM (n=3) (M&M, p.50). ... 113
Figure 23 – MR imaging of cell pellets of CHO K1 cells. A is a T2-weighted representative MR image obtained with the MRI of control with no iron supplementation (0 mM), GFP and GFP_T both supplemented with 0.2 and 2 mM of iron (Iron supplementation, p.50). Relaxation times T1 and T2 were quantified on a specific region of the cell pellet and are represented in B and C, respectively. Error bars represent SEM (n=3) (M&M, p.65). ... 115
indicated in the table above (M&M, p.65). ... 120
Figure 25 – Representative pictures of mMSC at P1 post-transduction. Control cells (untransduced) are displayed at an equivalent passage. dT corresponds to dTomato transduced cells; dT_F to Fth-1 transduced cells; GFP to GFP transduced cells; GFP_T to TfR-1 transduced cells and dT_Fth-1+GFP_T to cells transduced in conjunction with Fth-1 and TfR-1. All sets of pictures were taken with the same exposure conditions. A higher magnification of the insets is presented on the right hand side panel. RF - Red fluorescence; GF - Green fluorescence; RF/GF - Merge. Scale bars correspond to 100 µm. ... 136
Figure 26 – Viability assay on transduced mMSC at P1 post-transduction with normal cell culture conditions. Data points and statistics are presented in relation to Control (untransduced) cells. Error bars represent SEM (n=3) (M&M, p.61). ... 138
Figure 27 – RT-qPCR relative quantification of dTomato, Viral_F, GFP and Viral_T targets in transduced mMSC at P1 and P3 post-transduction (without FACS sorting). Expression values of target genes are plotted against P1 without (A) and with (B) iron supplements from 24h post-transduction. Error bars represent SEM (n=3) (M&M, p.52). ... 140
Figure 28 – Representative pictures of mMSC at P7 post-transduction and FACS sorted, as well as control cells (untransduced) at an equivalent passage. All sets of pictures were taken with the same exposure conditions. RF-Red fluorescence; GF-Green fluorescence; RF/GF - Merge. Scale bars correspond to 100 µm. ... 143
Figure 29 – Flow cytometry histograms (A and D) of mMSC cells, at P8 post-transduction and after FACS sorting. Histograms show the number of events (cells) counted (y-axis) versus the fluorescence intensity (x-axis). Red/ green fluorescence (RF/GF) gate represents dTomato/GFP-positive cell population plotted in B and
E. The Xmean (C and F) represents the mean fluorescence obtained from the gated region (dTomato/ GFP cells). Error bars represent SEM (n=3). a.u-arbitrary units; M&M, p.48. ... 144
Figure 30 – Viability of transduced mMSC at P1 and P8 post-transduction when supplemented with iron. Cells at P8 were already FACS sorted. Data points and statistics are presented in relation to Control (untransduced) cells, cultured in the same conditions. Error bars represent SEM (n=3) (M&M, p.61). ... 146
Figure 31 – RT-qPCR relative quantification of endogenous and viral TfR-1 transcripts (Total_T, A and B) and of endogenous and viral Fth-1 transcripts (Total_F, C and
D) in Control and transduced mMSC at P1 and P3 post-transduction. Expression values of target genes are normalized in relation to P1 (A and C) and to Control cells (B and D). Error bars represent SEM (n=3) (M&M, p.52). ... 149
Figure 32 – WB relative quantification of Total_T (A) and Total_F (B) targets in Control and transduced mMSC at P8 post-transduction and after FACS sorting. Error bars represent SEM (n=3) (M&M, p. 57). ... 151
were taken with the same exposure conditions. Negative controls targeting only the secondary Abs used are included to prove specificity to the primary Ab. Scale bars: 25 µm; M&M, p.56. ... 152
Figure 34 – Intracellular iron content of mMSC cells determined with the Ferrozine assay. Control and transduced cells were supplemented with different iron concentrations of 0.2 mM from 24 post-transduction or 2 mM for 4 days prior to measurement (Iron supplementation, p.50). A non-supplemented (0 mM) Control was also included. Error bars represent SEM (n=3) (M&M, p.50). ... 154
Figure 35 – MR imaging of cell pellets of mMSC cells. A is a T2-weighted representative MR image obtained with the MRI of Control with no iron supplementation (0 mM); Control and dT_F+GFP_T, dT and dT_F, GFP and GFP_T both supplemented with 0.2 mM from 24h post-transduction or with 2 mM of iron for 4 days (Iron supplementation, p.50). Relaxation times T1 and T2 were quantified on a specific region of the cell pellet and are represented in B and C, respectively. Error bars represent SEM (n=3) (M&M, p. 65). ... 156
Figure 36 – Fluorescence and MR imaging of dT and dT_F (A and B), GFP and GFP_T (C and D) and dT_F+GFP_T and dT (0 mM) (E and F) transduced mMSC cells, 2 days after injection in the midbrain of a chick embryo (E5). Cells received 2 mM of iron supplementation for 3 days prior to injection, with the exception of dT (0 mM) (F), which did not receive any supplementation (Iron supplementation, p.50). In the fluorescence imaging panel, bright field (BF) and red/green fluorescence (RF/GF) are projection images from the whole embryo; overlays are presented for both left and right views and were used as a reference guidance for MR imaging; scale bars correspond to 1 mm. In the MRI panel, anatomical images are displayed as transverse sections along the rostrocaudal axis of the embryo (left to right); 10 sections are displayed for each embryo. All images are representative from the results obtained and were equally processed with ImageJ software. Arrows indicate T2 shortening effect; b – bubble of air; * – blood. Position of the embryo: F – front; B – back; R – right; L – left; number of biological and technical replicates is indicated in the table above (M&M, p.65). ... 161
Figure 37 – Transmission electron microscopy (TEM) of HEK 293FT cells overexpressing MagA, where electron dense spots are visible (and highlighted in the inset) and have been suggested to correspond to iron oxide nanoparticles. Reproduced with permission from Zurkiya et al. (2008). ... 174
Figure 38 – RT-qPCR relative quantification of dTomato (A) and MagA (B) transgenes, evaluated in four dT_M transduced cell lines (MOI=1), including HEK 293T(N) as a reference, over a period of 40 days. Error bars represent SEM (n=3) (M&M, p.52). ... 178
Figure 39 – Cell proliferation of HEK 293T(N), mESC, mMSC and mKSC during a period of 8 days after being transduced with dT (A) or dT_M (B) lentiviral constructs. Data points are plotted in relation to control cells. The threshold line represents 50% of cell counts. Error bars represent SEM (n=3) (M&M, p.61). ... 180
Figure 40 - Representative pictures of CHO K1 (A) and HEK 293T(N) (B) cells at P7 post-transduction, and Control cells (untransduced) at an equivalent passage. dT corresponds to dTomato transduced cells and dT_M to MagA transduced cells. All red fluorescent pictures were taken with the same exposure conditions. Scale bars correspond to 100 µm... 182
transduction. Histograms show the number of events (cells) counted (y-axis) versus the fluorescence intensity (x-axis). Red fluorescence (RF) gate represents the dTomato-positive cell population plotted in (B).The Xmean (C) represents the mean fluorescence obtained from the gates region (RF cells). Error bars represent SEM (n=3). a.u.–arbitrary units; M&M, p.48. ... 183
Figure 42 – RT-qPCR relative quantification of dTomato and MagA transgene expression at P1 and P3 in dT_M transduced CHO K1 cells or HEK 293T(N). For the evaluation of transgene expression over two passages, HEK 293T(N) cells were not FACS sorted. Expression values are plotted against P1. Error bars represent SEM (n=3) (M&M, p.52). ... 185
Figure 43 – Proliferation assay on dT and dT_M transduced CHO K1 cells at P1 and P4. Data points are plotted in relation to Control (untransduced) cells. Error bars represent SEM (n=3). A statistical difference is found in dT_M (P1) cells when compared to Control and dT cells of the same passage (M&M, p.61). ... 186
Figure 44 – Relative quantification of transferrin receptor-1 (Total_T) expression obtained via RT-qPCR (A and C) and the respective protein levels as obtained via WB (B
and D), when Control, dTomato (dT) and MagA (dT_M) transduced cells were exposed to different iron concentrations of 0, 0.2 and 2 mM (Iron supplementation, p.50). Graphs A and B evaluate Total_T expression levels when each cell line is exposed to different iron concentrations and graphs C and
D the difference between cell lines when exposed to the same iron concentration. Error bars represent SEM (n=3) (M&M, p.52 for RT-qPCR and p.57 for WB). ... 188
Figure 45 – Relative quantification of ferritin heavy chain1 (Total_F) expression obtained via RT-qPCR (A and C) and the respective protein levels as obtained via WB (B and
D), when Control, dTomato (dT) and MagA (dT_M) transduced cells were exposed to different iron concentrations of 0, 0.2 and 2 mM ((Iron supplementation, p.50)). Graphs A and B evaluate Total_F expression levels when each cell line is exposed to different iron concentrations and graphs C and
D the difference between cell lines when exposed to the same iron concentration. Error bars represent SEM (n=3); (M&M, p.52 for RT-qPCR and p.57 for WB). ... 189
Figure 46 – RT-qPCR relative quantification of transgenes dTomato (A) and MagA (B) when dTomato (dT) and MagA (dT_M) transduced cells were exposed to 0, 0.2 or 2 mM of iron. Error bars represent SEM (n=3) (M&M, p.52). ... 192
Figure 47 – Intracellular iron content of CHO K1 (A) and HEK 293T(N) (B) cells determined with the Ferrozine assay. Control, dTomato (dT) and MagA (dT_M) transduced cells were supplemented with different iron concentrations of 0, 0.2 and 2 mM for 4 days prior to measurement (Iron supplementation, p.50). Error bars represent SEM (n=3) (M&M, p.50). ... 194
Figure 48 – Prussian blue and DAB staining of HEK 293T(N) Control, dTomato (dT) and MagA (dT_M) cells exposed to different iron concentrations of 0, 0.2 and 2 mM (Iron supplementation, p.50), M&M, p.51. ... 196
Figure 49 – Electron microscopy images of HEK 293T(N) cells. (A) Control cells exposed to no iron supplementation and (B) dTomato (dT) and (C) MagA (dT_M) transduced cells supplemented with 0.2 mM of iron. Electron dense spots in A inside mitochondria and B and C are found in the cytoplasm. Scale bars: 200 nm; M&M, p.60. ... 197
cells. A and B are T2-weighted representative MR images obtained with MRI of Control with no iron supplementation (0 mM), dTomato (dT) and MagA (dT_M) both supplemented with 0.2 and 2 mM of iron (Iron supplementation, p.50). Relaxation times T1 and T2 were quantified on a specific region of the cell pellet and represented in C-D and E-F, respectively. Error bars represent SEM (n=3) (M&M, p.65). ... 199
LIST OF TABLES
Table 1 – Conditions of PCR reaction and cycling for cDNA fragment amplification. ... 30
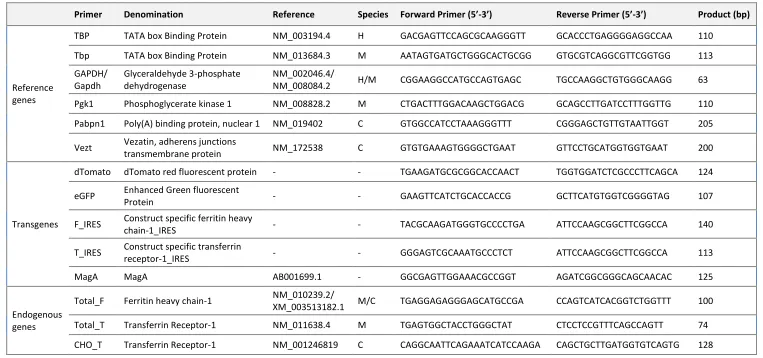
Table 2 – Description of primers used to amplify cDNA fragments by PCR, with the respective annealing temperatures and resulting product size. Note that in the primer sequences, the red nucleotides represent either the start codon (ATG) or the stop codon (TTA, TCA). The green sequence is a Kozac sequence that was purposely introduced before the start site of TfR-1 and MagA cDNA to help initiate the translation process. This was not performed for Fth-1 cDNA because a native Kozac sequence is already present. Novel restriction enzymes are highlighted in bold. ... 31
Table 3 – Conditions used for ligation reactions. ... 37
Table 4 – Primers used for sequence analysis of the constructs generated. F – Forward orientation; R – Reverse orientation. ... 38
Table 5 – Relative amounts of each individual plasmid and mass ratios tested for transfection optimization. Note that in the negative control (1:0:0) the packaging and envelope plasmids are not included for the transfection of HEK 293T(N) cells. ... 43
Table 6 – Sequence of primers used for amplification of cDNA by Real-Time PCR and resultant amplification product. H-Homo sapiens, M-Mus musculus, C-Cricetulus griseus; GAPDH primers were designed to amplify a cDNA region common to both mouse and human variants; Pabpn1 and Vezt were taken from Bahr et al. (2009). ... 54
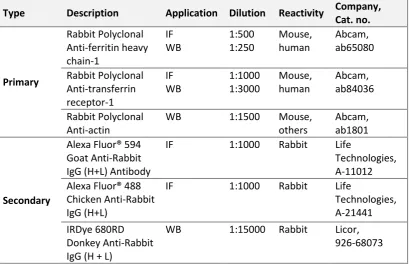
Table 7 – Description of primary and secondary Abs used in immunofluorescence (IF) and western blot (WB). ... 57
LIST OF EQUATIONS
Equation 1 – Fenton reaction (Fenton, 1894). ... 9
LIST OF SUPPLEMENTARY DATA
Supplementary figure 1 – Representative western blots and correspondent total protein gels from control, GFP and transferrin receptor-1 (GFP_T) transduced CHO K1 cells, supplemented for 4 days with 0 or 0.2 mM of iron. Orange rectangle highlights total TfR-1 (endogenous + viral, here described as Total_T) protein expression, with a predicted molecular weight (MW) of 100 kDa; white rectangle corresponds to actin expression with 42 kDa and blue rectangle to Fth-1 (or Total_F) with 21 kDa. Protein quantification was normalized using total protein gels and confirmed using actin as a reference protein (M&M, p.57). ... 127
Supplementary figure 2 – Representative immunofluorescence pictures of Control, GFP and GFP_T transduced CHO K1 cells, showing nuclear staining with DAPI, green fluorescence (GF) originating from the GFP reporter and the detection of TfR-1 proteins, visualized with a red fluorescent antibody (RF). A clear protein overexpression of TfR-1 is found in GFP_T. All pictures sets were taken with the same exposure conditions. RF pictures with a longer exposure time are shown in the insets. A negative control targeting only the secondary Ab is included to confirm the specificity to the primary Ab. Scale bars: 25 µm; (M&M, p.56). .... 128
Supplementary figure 3 – Representative differentiation pictures of Control, dT, GFP, dT_F, GFP_T and dT_F+GFP_T incubated with 0.2 mM of iron 24h post-transduction, along with a non-supplemented Control. Differentiation potential of these cells was directed towards the formation of osteocytes, adipocytes or chondrocytes (M&M, p.62). ... 171
Supplementary figure 4 – Representative western blot and correspondent total protein gels from Control, dT, GFP, ferritin heavy chain-1 (dT_F), transferrin receptor-1 (GFP_T) and dT_F+GFP_T transduced mMSC cells, iron supplemented since 24h after transduction. Orange rectangle highlights total TfR-1 (endogenous + viral, described as Total_T) protein expression, with a predicted molecular weight (MW) of 100 kDa; white rectangle corresponds to actin expression with 42 kDa and blue rectangle to Fth-1 (endogenous + viral, Total_F) with 21 kDa. Sometimes another band is detected when targeting Fth-1, which may correspond to a post-translational modification of this protein. Protein quantification was normalized using total protein gels and confirmed using actin as a reference protein (M&M, p. 57). ... 172
LIST OF HYPERLINKS
NCBI - http://www.ncbi.nlm.nih.gov/
UniProt KB P02794 - http://www.uniprot.org/uniprot/P02794
Permission from Benoit et al. (2009) - https://s100.copyright.com/CustomerAdmin/ PLF.jsp?ref=209848d3-dd50-4059-9e73-3b8fe1cd7970
Permission from Schüler (2004) - https://s100.copyright.com/CustomerAdmin/ PLF.jsp?ref=effb77f4-3a42-4485-a7a5-55d75dd01c73
pCR2.1MS-magA plasmid, Addgene, 21751 – http://www.addgene.org/21751/
pHIV-dTomato plasmid, Addgene, 213734 – https://www.addgene.org/21374/ pHIV-eGFP plasmid, Addgene, 21373 – https://www.addgene.org/21373/
Packaging plasmid psPAX2, Addgene, 12260 – https://www.addgene.org/12260/
Envelope plasmid pMD2.G, Addgene, 12259 – https://www.addgene.org/12259/
Gene therapy clinical trials worldwide – http://www.wiley.com/legacy/wileychi/ genmed/clinical/
Permission from Deans et al. (2006) https://s100.copyright.com/CustomerAdmin/ PLF.jsp?ref=b8af3bd3-a2d9-4259-9bc8-c1db1a198906
Permission from Zurkiya et al. (2008) – http://s100.copyright.com/Customer Admin/PLF.jsp?ref=73a790f3-5535-4f62-970c-299461cf71e4
M. magnetotacticum MS-1 bacterial strain (GenBank AB001699.1) –
http://www.ncbi.nlm.nih.gov/nuccore/AB001699.1
M. magneticum AMB-1 bacterial strain (GenBank D32253.1) –
http://www.ncbi.nlm.nih.gov/nuccore/D32253
Mus musculus Ferritin heavy chain 1 mRNA (NM_010239.2) – http://www.ncbi. nlm.nih.gov/nuccore/NM_010239.2
Mus musculus Transferrin Receptor-1 mRNA (NM_011638.4) –
ABBREVIATIONS
a.u. – Arbitrary units.
AAVs – Adeno-associated viral vectors
Ab – Antibody
Blast – Basic local alignment search tool
CHO K1 - Chinese Hamster Ovary cell line K1
CIP - Calf Intestinal Alkaline Phosphatase
D – Dapi
DAB – 3,3′-Diaminobenzidine
DMEM – Dulbecco’s Modified Eagle’s Medium
DMT1 – Divalent metal transporter 1
DMT-1 – Divalent Metal Transporter-1
DOX – Doxycycline
E – Embryonic day
EC10 – Effective concentration at 10% inhibition
EF1-α – Elongation factor 1-α promoter
eGFP – Enhanced green fluorescent protein
ETR – Engineered transferrin receptor-1
FCS – Foetal calf serum
FTH-1 – Human ferritin heavy chain-1
Fth-1 – Mouse ferritin heavy chain-1
FTL-1 – Human ferritin light chain-1
Ftl-1 – Mouse ferritin light chain-1
GAPDH – Glyceraldehyde-3-phophate dehydrogenase
GF – Green fluorescence
GO – Gene Ontology
HEK 293T(N) – Human embryonic kidney cells 293-T(N)
HEPES – 4-(2-hydroxyethyl)—1-piperazineethanesulfonic acid
hESC – Human embryonic stem cells
HIV – Human immunodeficiency virus
hMSC – Human mesenchymal stem cells
ICP – Inductively coupled plasma
IF – Immunofluorescence
IM – Insertional mutagenesis
IRE – Iron responsive element
IRES – Internal ribosome entry site
IRP – Iron regulatory protein
LIF – Leukaemia Inhibitor factor
LIP - Labile iron pool
LTR – Long terminal repeats
LV – Lentivirus-based vectors
MCS – Multiple cloning site
MEM – Minimum Essential Medium Eagle
MEMRI – Manganese-Enhanced MRI
mESC – Mouse embryonic stem cells
mKSC – Mouse kidney-derived stem cells
mMSC – Mouse mesenchymal stem cells
MOI – Multiplicity of infection
MRI – Magnetic resonance imaging
MtF – Mitochondrial ferritin
n – Number
NCBI – National centre for biotechnology information
NTC – Non-template controls
p –p-value
PBS - Dulbecco’s Phosphate Buffered Saline
PET - Positron emission tomography
pg - Picogram
RF – Red fluorescence
RFP - Red fluorescent protein
RT – Room temperature
RT-qPCR – Reverse transcription quantitative Real-Time PCR
RVs – Retroviral vectors
SD – Standard deviation
SEM – Standard error (SE) of mean (M)
SIN – self-inactivating
SPECT - Single-proton emission computed tomography
SPIONs - Superparamagnetic iron oxide nanoparticles
T – Tesla
TBP/Tbp - TATA box protein (human/ mouse) TE – Echo times
TEM – Transmission electron microscopy
TET – Tetracycline
TFR-1 – Human transferrin receptor-1
TfR-1 – Mouse transferrin receptor-1
TR – Repetition times
TU - Transducing units
UTR - Untranslated region
UV – Ultraviolet
VSV-G – vesicular stomatitis virus G
WB – Western Blot
WPRE – Woodshuck post-transcriptional regulatory element
WST-8 – [2-(2-methoxy-4-nitrophenyl)-3-(4-nitrophenyl)- 5-(2,4-disulfophenyl)-2H-tetrazolium
C
HAPTER1
I
NTRODUCTIONO
VERVIEW1.1
S
TEM CELL TRACKING ANDMRI
The most routinely used technology for the study of stem cells is fluorescence optical imaging and there are a number of reporter genes readily available, such as red or green fluorescent proteins (RFP/GFP) (Gould and Subramani, 1988). Another optical imaging system uses luminescence derived from specific organisms and is therefore designated as bioluminescence imaging, a technology that captures visible light emission from cells or tissues. This is only possible due to presence of specific reporters as, for example, firefly luciferase, originally derived from the North American firefly (de Wet et al., 1985), that and upon activation via D-luciferase substrate emits a 560 nm emission peak (Sadikot and Blackwell, 2004). However, a pitfall commonly associated with these optical reporters is the low depth penetration capacity, which is essential for regenerative studies focused on injured deep internal organs.
a contrast agent to visualize cells of interest. New techniques have been emerging in an attempt to provide optimum iron load into the cells either by labelling with exogenous contrast agents or by modifying the cells through genetic engineering. On one hand, the exogenous materials introduced into the cells are very often composed of iron oxide covered with a biocompatible synthetic shell, like, for example, superparamagnetic iron oxide nanoparticles (SPIONs) (Peacock et al., 2012; Renshaw et al., 1986). On the other hand, genetic engineering of the cell focuses mainly on introducing or overexpressing one or more components of the iron metabolic pathway (Deans et al., 2006; Genove et al., 2005) or other synthetic or foreign genes (Iordanova et al., 2010; Zurkiya et al., 2008) in order to augment intracellular iron load, using iron present within a cell or in its surroundings.
1.1.1 Magnetic resonance imaging
populations (Harney and Meade, 2010). This could be simply overcome by using scanners with high-field strengths such as 4.7, 9.4, 11.7 or 14T (Louie et al., 2000).
The mechanism behind conventional MR imaging is the detection of signals from relaxation mechanisms, produced by the magnetization of hydrogen nuclei (1H), present in mobile water protons, either in the form of spin-lattice relaxation time (T1), spin-spin relaxation time (T2 or T2*). Once the sample is positioned in a static magnetic field, the magnetic moment characteristic of 1H tends to align with the direction of the magnetic field. The signal detection is directly proportional to the concentration of nucleus imaged in a certain region and decreases exponentially with the time constant T2 or T2* (Haacke et al., 1999).
A few compounds may enhance MRI contrast, by affecting the relaxation properties of the nuclei present in their surroundings. On one hand, the use of gadolinium containing agents may result in positive contrast, primarily affecting T1 time constant and promoting signal intensity. On the other hand, a negative contrast can be achieved with the use of compounds made of superparamagnetic iron oxides, mainly affecting T2 (or T2*) time constant, resulting in signal loss. This signal loss is due to the strong magnetic moment associated with iron oxide particles and its interaction with the surrounding water protons (Ahrens and Bulte, 2013; Jung and Jacobs, 1995).
1.1.2 Exogenous vs. endogenous iron oxide-based contrast agents for MRI
The most commonly used method to generate contrast for MRI is to label cells in vitro with exogenous iron oxide-based contrast agents, like SPIONs (Patel et al., 2010). This method of labelling has proven to be effective and robust for stem cell tracking of small populations and not only is a good choice for short-term studies up to 6 weeks, it also has been shown not to interfere with cell viability or proliferation capacity (Bulte et al., 2001; Taylor et al., 2012). Nevertheless, if long-term regenerative studies are an essential requirement for stem cell-based treatments, exogenously incorporating iron inside a cell does pose some limitations. After an initial cell labelling with SPIONs, cell proliferation causes the label to be diluted by 50% following each cell division (Taylor et al., 2014). Also, even though exogenous labelling materials are biocompatible to some extent, they are still foreign objects to the cell and might be easily rejected, via exocytosis, or degradation. Exocytosis of the label could lead to it being incorporated by neighbouring host cells, giving rise to false positives (Bulte and Kraitchman, 2004). Another potential cause of false positive signal could arise from phagocytosis of dead stem cells by neighbouring host cells or macrophages, leading to the transfer of the magnetic label. At last, even though SPIONs have been proven not to interfere with cell viability or proliferation, it has been reported that in some cell types it can inhibit cell differentiation (Chen et al., 2010; Kostura et al., 2004).
certain advantages over other labelling methods. For instance, stem cells expressing metalloprotein-based reporter genes can also be monitored non-invasively, in theory through long periods of time. If these genes are integrated into the cell’s genome, it is much less likely to undergo a loss of signal during cell proliferation or even to be rejected by the cell. In the case of cell death, reporter gene expression will immediately arrest and its products will probably be more easily dissolved by the normal metabolism, avoiding the risk of false positive signal (Rodriguez-Porcel et al., 2009). Also, other genes of interest can be associated with the magnetic reporter gene, creating suitable vectors for gene therapy (Liu et al., 2009). In the case of basic research, the gene of interest can be a fluorescent protein and in this case MRI contrast can be confirmed with optical imaging. An obvious limitation to this contrast method is the low sensitivity of detection, when compared to materials like SPIONs (Gilad et al., 2007b). If iron availability is not present in surrounding areas to the cell in sufficient amounts, magnetic reporter gene overexpression may not incorporate sufficient iron volumes to generate MRI contrast. Nonetheless, metalloprotein-based reporter genes have been suggested to be sufficient to provide a good MRI contrast for stem cell tracking (Deans et al., 2006; Genove et al., 2005).
1.1.3 Metalloprotein-based MRI reporter genes
The next generation of MRI-based approaches for cell tracking rely on new
technologies for cellular imaging. As previously described, metalloprotein-based
reporter genes can involve several components of the iron metabolism pathway or
of those components targeted so far are proteins such as: the transferrin receptor-1
(Moore et al., 1998); the tyrosinase enzyme (Alfke et al., 2003); a synthetic
lysine-rich protein (Gilad et al., 2007a); both subunits of the ferritin complex used
either together or separately (Cohen et al., 2005; Genove et al., 2005) and even
synthetically modified ferritin (Iordanova et al., 2013); and, lastly, foreign genes
such as the bacterial iron transporter protein, MagA (Goldhawk et al., 2009; Zurkiya
1.2
I
RON METABOLISMIron is a vital and indispensable element to life, as it is necessary to produce heme and non-heme iron proteins involved in several cellular processes. The most important example is iron present in haemoglobins of erythrocytes, which comprise about 60-70% of total body iron and are essential for oxygen transport. Iron is also present in cytochromes, which take part in the electron transport during aerobic cellular respiration, and is a key constituent in enzyme production and DNA synthesis, amongst other functions (Ponka and Lok, 1999). When iron is depleted within a cell it may lead to cell arrest and death (Muckenthaler et al., 2008). Nevertheless, however important this nutrient is, when present in excess, it becomes toxic, leading to the formation of highly reactive oxygen radical species, damaging cell membranes, proteins and ultimately affecting the integrity of nucleic acids (Hentze and Kuhnt, 1996).
Iron is often found in two interconvertible oxidation states: ferrous iron (Fe2+) and ferric iron (Fe3+). At normal physiological conditions, ferrous iron readily converts into ferric iron. This process is known as the Fenton reaction (Equation 1) and the resultant oxidation leads to the formation of hydroxyl radicals (HO.) and hydroxide ions (OH-). When ferric iron is reduced back into ferrous iron, it forms a hydroperoxyl radical (HO2) and another oxygen-radical species (H+) in the process
Fe
2++ H
2O
2→
Fe
3++ HO. + OH
-Fe
3++ H
2O
2→
Fe
2++ HOO. + H
+Equation 1 – Fenton reaction (Fenton, 1894).
1.2.1 Regulation of intracellular iron – IRP/IRE regulatory system
Inside the cell there is transient free iron, known as the labile iron pool (LIP). The magnitude of LIP is tightly controlled by the cell and this transient iron is bound to low molecular weight molecules, ready to be used in a variety of cellular processes (Thomson et al., 1999). The depletion or excess of iron within the LIP is easily detected in the cytoplasm by iron regulatory proteins, IRP1 and IRP2. The importance of IRPs in development is demonstrated by the occurrence of embryonic lethality when IRP1 and IRP2 genes are knocked-out in mice (Smith et al., 2006). The IRPs bind to iron responsive elements (IRE), which are hairpin structures present in untranslated regions (UTR) of mRNAs from genes involved in iron metabolism (Wilkinson and Pantopoulos, 2014). Many genes are involved in the uptake, utilization, storage and export of iron at the cellular level (Muckenthaler et al., 2008). Two of the most important genes are responsible for iron uptake (transferrin receptor genes) and storage (ferritin genes) and therefore both contain iron responsive elements in their mRNA UTR. Transferrin receptors act at the cellular membrane interacting with mono or diferric transferrin from the bloodstream. Both ferritin and transferrin receptors can serve either as iron donors or acceptors; however, ferritin has the capacity not only to receive and accept large quantities of iron, but also to act as an intracellular storage molecule (Aisen et al., 2001).
1.3
T
RANSFERRINR
ECEPTOR-1
As previously stated, iron is transported by transferrin to virtually all tissues within an organism. However, intracellular iron incorporation is proportional to the number of receptors available at the cellular membrane; therefore, cells expressing more transferrin receptor-1 (TfR-1) usually have higher iron acquisition capacities than cells expressing low levels of TfR-1. Examples of cells with high numbers of TfR-1 include immature erythroid cells, which contain the highest mass of total TfR-1 in an organism, as well as non-proliferating cells, such as hepatocytes and endothelial cells of the blood-brain barrier (Gatter et al., 1983; Ponka and Lok, 1999). Also, rapidly proliferating cells, both normal and malignant, have been shown to have a higher number of transferrin receptor-1 (Inoue et al., 1993), which may be due to a greater need of iron for synthesis of DNA (Jordan and Reichard, 1998). Because TfR-1 is known to be expressed in high levels in cancer cells, several studies analyse this receptor for targeted drug delivery therapies (Moore et al., 2001; Qian et al., 2002; Wang et al., 2010).
1.3.1 Transferrin receptor-1 molecular structure and biochemistry
The transferrin receptor-1 gene is 33 kb and is located on chromosome 3 in humans, and chromosome 16 in mice, and is transcribed into a ~5 kb mRNA. In mice, only one variant of this gene exists, while in humans two variants can be found, encoding for the same protein, only differing in the 5’UTR (data available from National centre for biotechnology information - NCBI). The 3’UTR is one of the most important regions in TfR-1 mRNA and it was first discovered by Owen and Kühn (1987). This region is remarkably large, composed of about 2500 bp in total, and five conserved fragments, corresponding to the IREs involved in post-transcriptional control of the receptor (Appendix I, mouse TfR-1 mRNA sequence, p.242).
is lost (Rutledge et al., 1994). Complete knock-out of TfR-1 leads to death during embryonic development, as this gene is essential for normal development of erythrocytes as well as the nervous system (Levy et al., 1999).
1.3.2 Cellular internalization of iron though transferrin/TfR-1 complex
1.3.3 Transferrin receptor-2
1.4
F
ERRITIN1.4.1 Ferritin molecular structure and biochemistry
Ferritins are protein complexes formed of two different subunits: H or heavy subunit and L or light subunit. At the gene level, H and L subunits derive from two different genes, ferritin heavy chain-1 (Fth-1) and ferritin light chain-1 (Ftl-1), and are located in different chromosomes: Fth-1 gene is found on chromosome 11 and 19 and Ftl-1 gene is found on chromosome 19 and 7, in humans and mice, respectively (data available from NCBI). The complete knock-out of Fth-1 in mouse was proven to be embryonically lethal, but if one of the alleles is present the mice were healthy and fertile (Ferreira et al., 2000). Both genes have homologous coding sequences but greatly differ in their UTRs. The 5’UTR of Fth-1 has been vastly studied over the years and several regulatory regions have been described. Amongst four described so far, the most important one is the IRE, which is a highly conserved 28 base-pair sequence (Appendix I, mouse Fth-1 mRNA sequence, p.242). This cis-acting element forms a stem-loop structure which interacts with trans-acting IRPs according to iron availability, as previously described (Torti and Torti, 2002; Worwood, 1990). Ferritin expression is not only controlled post-transcriptionally via IRP/IRE regulatory system, but it is also subject to a strict genetic control, depending on the particular tissue and conditions associated with oxidative stress (Arosio and Levi, 2002; Boyd et al., 1985).
mammals, ferritins consisting of just one subunit can be assembled, although homopolymers are rarely formed (Santambrogio et al., 1993). Multiple copies of ferritins are usually present within a cell and 24 subunits are needed to form an empty ferritin shell whose outer and inner diameter are about 12 and 8 nm, respectively. Ferritin is known as apo-ferritin when iron is not present inside its core. Each apo-ferritin molecule can store up to 4500 Fe3+ atoms (Harrison and Arosio, 1996).
1.4.2 Ferritin internalization of iron
1.5
M
AGNETOTACTIC BACTERIA,
MAGNETOSOMES ANDM
AGA
More commonly known as magnetotactic bacteria, Magnetospirillum sp. is a gram-negative bacterium. The two most studied species are M. magneticum and M. gryphiswaldense. They are found in freshwater, have motility, mostly due to flagella, and in their pure form are known to perform aerobic respiration (Bazylinski and Frankel, 2004). This type of bacteria is also thought to migrate and self-orientate according to the earth’s magnetic field (Blakemore, 1975). This is only possible due to a specialized organelle, known as the magnetosome (Stolz et al., 1986), also routinely described as a bacterial magnetic particle or intracellular superparamagnetic nanocrystal. The organelle derives from invaginations of the prokaryotic inner plasma membrane and is able to accumulate biomineralized iron, if an iron-rich environment is present (Komeili et al., 2006). During the mineralization process, iron incorporation can occur either by the formation of crystals of magnetite (Fe3O4), giving rise to iron oxide magnetosomes (Frankel et al.,
Figure 2 – Transmission electron microscopy of a Magnetospirillum magneticum with a magnetosome chain (A) and of isolated magnetosomes (B) with intact membranes, indicated by the arrow. Scale bars are 100 nm. Reproduced with permission from Benoit et al. (2009) (A) and from Schüler (2004) (B).
[image:42.595.168.469.82.439.2]magnetotactic bacteria or harvested and purified magnetosomes (Lang and Schüler, 2006) have been used as biogenic magnetic nanoparticles for several applications in biotechnology (Yoshino et al., 2010), cancer therapeutics (Mannucci et al., 2014) and even robotics research (Martel et al., 2009).
1.5.1 Magnetosome formation
Figure 3 – Simplified illustration showing a hypothesized mechanism for membrane invagination, iron biomineralization of magnetosomes and MagA function as an iron transporter protein. Illustration based on Komeili et al. (2006).
1.5.2 MagA gene
[image:44.595.112.517.89.386.2]1.6
A
IMSThe field of cell tracking using MRI as the base technology is of great interest and has been explored over the past decades. However, a labelling or tracking method that proves to be both efficient and stable in a long term-basis and that can also be used to detect cells in deep-set organs in vivo is yet to be further explored.
The main focus of this work was to compare three magnetic reporter genes, transferrin receptor-1, ferritin heavy chain-1 and MagA genes, previously reported to provide an efficient iron load when overexpressed in target cells, thus giving rise to a stronger MRI contrast. In order to do this:
1. Magnetic reporter genes were stably introduced into established cell/ stem cell lines, using a HIV-lentiviral approach, alongside fluorescent reporter genes, allowing for bicistronic expression of both genes.
2. Several iron concentrations and derived supplements were evaluated to adjust optimum supplementation conditions to transduced cells in order to maximize the cell iron load capacity and, thus, MRI contrast capability.
4. Ferritin heavy chain-1 and transferrin receptor-1 were assessed as magnetic reporters both individually and together in mouse mesenchymal stem cells (mMSC).
5. MagA was individually evaluated as a potential magnetic reporter both in stem cell lines such as, mouse embryonic stem cells (mESC), mMSC and mouse kidney stem cells (mKSC), and in established cell lines like CHO K1 and human embryonic kidney (HEK) 293T(N) cells. 6. Once the different magnetic reporters (or respective controls) were
C
HAPTER2
M
ATERIALS ANDM
ETHODSO
VERVIEWThis chapter describes molecular biology techniques and cell culture procedures that were used to generate and evaluate the reporter cell lines. The production and integration of self-inactivating (SIN) replication-defective VSV-G pseudotyped HIV-based lentiviral particles, as well as the protocols for the assessment of the transgenes at the mRNA and protein expression levels are described. Also, the potential of these transgenes to serve as magnetic reporters in stem cells was evaluated by determining the iron content and MRI contrast of cells. Finally, the viability, proliferation and differentiation capacity of these cells was explored. Buffers, solutions, media, restriction enzymes, equipments and other underlined material are detailed in Appendix II (p.245). Manufacturer’s protocols are only described in case modifications were made.
2.1
M
OLECULAR CLONING2.1.1 Reporter genes cDNA
cDNAs were synthesized from an RNA sample of the D1 mesenchymal stem cell line (see section 2.2.1 Cell lines, p.39). Iron responsive elements, present in both cDNAs, were identified using the online software SIREs Web Server 2.0 (Campillos et al., 2010) and excluded from amplification. Magnetotactic bacteria MagA cDNA was extracted from a commercial pCR2.1MS-magA plasmid (Addgene, 21751). Sequences of cDNAs can be found in Appendix I (p.242).
2.1.2 Extraction of total RNA
2.1.3 DNase treatment of RNA
A DNase treatment was performed to remove any traces of DNA contamination: 8 µl of total RNA were mixed with 1x RQ1 DNase 10x Reaction Buffer and 1 U of RQ1 RNase-Free DNase per µg of RNA and incubated for 30 min at 37oC. Afterwards, 1 µl of RQ1 DNase Stop Solution was added to the mix and incubated at 65oC for 15 min, in order to completely stop the reaction. From this point, samples were either handled on ice or stored at -80oC until further use.
2.1.4 Synthesis of cDNA by reverse transcriptase
The synthesis of the first-strand cDNA from total RNA was performed with SuperScript™III Reverse Transcriptase. Briefly, a maximum of 5 µg of total RNA were added to a solution containing 200 ng of random hexamers, 10 mM deoxyribonucleotide (dNTP) mix and molecular biology water up to 13 µl, denatured at 65oC for 5 min, followed by a quick chill on ice. A mix of 5x First Strand Buffer, 0.1 M dithiothreitol (DTT) and 200 U of SuperScript™III-RT were then added. The resulting solution was mixed gently and incubated for 5 min at room temperature, followed by incubation at 50oC for 60 min. Afterwards, the reaction was inactivated by heating up to 70oC for 15 min. The solution was stored at -20oC until further use.
2.1.5 cDNA amplification by polymerase chain reaction
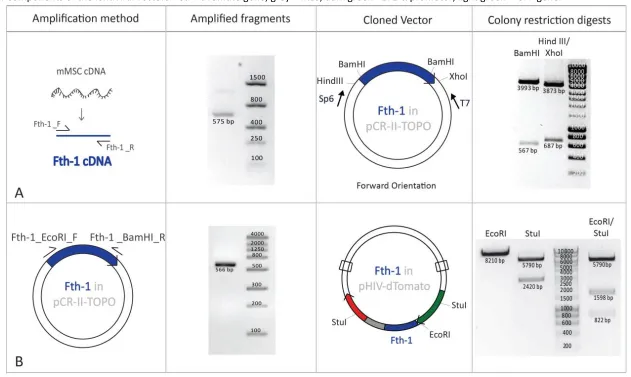
Fth-1_F/Fth-1_R for Fth-1, TfR-1_Kozak_F/TfR-1_R for TfR-1 and MagA_Kozac_F/MagA_R for MagA cDNA amplification, as well as a proof-reading polymerase, to unsure there were no amplification errors (Table 1). The primers and the annealing temperatures (Ta) used here and in section 2.1.10 Cloning of lentiviral constructs (p.33) are detailed in Table 2. Ta was determined by subtracting 5oC from the melting temperature (Tm) of each set of primers. The gene-specific primers were designed with restriction enzyme BamHI or EcoRI at the 5’ end.
Table 1 – Conditions of PCR reaction and cycling for cDNA fragment amplification. PCR Set up 1x Reaction Mix Cycling
conditions
cDNA / plasmid DNA 2 µl / 10 ng/µl
Forward primer (10 µM) 1 µl 95oC, 1 min – 1x
Reverse primer (10 µM) 1 µl 95oC, 45 s
30x
dNTPs (10 mM) 1 µl Ta, 45 s
AccuBuffer (10x) + MgSO4 (1.5 mM) 5 µl 72oC, 2 min
Accuzyme™ DNA polymerase (2.5 U/µl) 1 µl 72oC, 5 min -1x
Table 2 – Description of primers used to amplify cDNA fragments by PCR, with the respective annealing temperatures and resulting product size. Note that in the primer sequences, the red nucleotides represent either the start codon (ATG) or the stop codon (TTA, TCA). The green sequence is a Kozac sequence that was purposely introduced before the start site of TfR-1 and MagA cDNA to help initiate the translation process. This was not performed for Fth-1 cDNA because a native Kozac sequence is already present. Novel restriction enzymes are highlighted in bold.
* - A BamHI restriction site was introduced to the primer. ** - An EcoRI restriction site was introduced to the primer. 2.1.6 Electrophoresis by FlashGel® System
The resulting PCR products were confirmed by running a mix of 1 µl of PCR product, 1 µl of FlashGel® Loading Dye and 3 µl of water in a 1.2% FlashGel® Cassette using the FlashGel® System. In order to estimate the cDNA fragment sizes, either FlashGel® DNA Marker 100 bp-4 kb or FlashGel® QuantiLadder were used. Each single band was recovered according to the manufacturer’s instructions with the use of FlashGel® Recovery Kit.
cDNA Primer Sequence
(5’-3’)
Ta (oC)
Product (bp) Am p lifi ca ti o n fr o m p la smi d o r cDN A Fth-1
Fth-1_F* GGGATCCCCGCCGCCACCATGAC
59 575 Fth-1_R* GGATCCCTTAGCTCTCATCACCGT
TfR-1 TfR-1_Kozak_F GGAGCCACCATGATGGATCAAGCCAG 55 2319
TfR-1_R GCATGTTACATTTAAAACTCATTGTC
MagA MagA_Kozac_F* GGGATCCGCCACCATGGACCTGCATCATC 57 1314 MagA_R* CGGGATCCTCAGATTCCAGT
Am p lifi ca ti o n fr o m p CR®I I-TO PO ®
Fth-1 Fth-1_EcoRI_F** GGATTAGGAATTCCCGCCG 57 586 Fth-1_BamHI_R* GCAACTGGGATCCCTTAGCTC
TfR-1 TfR-1_Kozak_BamHI_F* GACGGATCCAGCCACCATGATGGAT 60 2322 TfR-1_BamHI_R* GCAATCGGGATCCTTTAAAACTC
[image:52.595.83.555.197.518.2]2.1.7 Cloning transgenes cDNA into pCR®II-TOPO®
cDNA fragments of each transgene were cloned into pCR®II-TOPO®. As suggested in the TOPO TA Cloning Kit, an A-tail was added to the purified PCR fragments by the addition of 1x BIOTAQ Buffer, 0.5 µl of dNTPs (10 mM) and 2.5 U of BIOTAQ™ DNA Polymerase up to a reaction volume of 10 µl and incubating for 10 to 15 min at 72oC. Afterwards, ligation reactions were prepared by adding 4 µl of PCR fragments, with 1 µl of salt solution and 1 µl of TOPO vector. This solution was mixed gently and incubated at room temperature for 5 min.
2.1.8 Transformation of chemically competent cells by heat-shock
2.1.9 Analysis of transformed colonies
Several white colonies were individually picked and grown in the presence of the appropriate antibiotic. Each colony was diluted in 3 ml of LB medium with 100 µl/ml of ampicillin and incubated at 37oC overnight, with shaking (200 rpm). High quality plasmid DNA mini-preparations were then made using QIAprep® spin miniprep kit, following the protocol provided by the manufacturer. The plasmid DNA preparations were measured for DNA concentration with a NanoDrop™ 1000 spectrophotometer, and were then used for colony restriction analysis, sequencing of positive clones and cloning into lentiviral vectors.
For colony restriction analysis, 250 ng of plasmid DNA were digested with 5 U of the appropriate restriction enzyme(s) in 1x of the corresponding buffer, up to a final reaction volume of 20 µl. The digests were left for at least 2h with the incubation temperature respecting the manufacturer’s instructions for each enzyme. Afterwards, one or two clones containing plasmids with the expected sizes evaluated by gel electrophoresis of the digestion products were selected for confirmation by sequencing. All sequencing analysis was performed by DNA Sequencing and Services (University of Dundee) and the primers used for sequencing are detailed in Table 4 (section 2.1.13 Ligation, p.36).
2.1.10 Cloning of lentiviral constructs