White Rose Research Online URL for this paper:
http://eprints.whiterose.ac.uk/5428/
Article:
Ruddle, R.A., Payne, S.J. and Jones, D.M. (1999) Navigating large-scale virtual
environments: what differences occur between helmet-mounted and desk-top displays?
Presence : Teleoperators and Virtual Environments, 8 (2). pp. 157-168. ISSN 1054-7460
https://doi.org/10.1162/105474699566143
[email protected] https://eprints.whiterose.ac.uk/ Reuse
Unless indicated otherwise, fulltext items are protected by copyright with all rights reserved. The copyright exception in section 29 of the Copyright, Designs and Patents Act 1988 allows the making of a single copy solely for the purpose of non-commercial research or private study within the limits of fair dealing. The publisher or other rights-holder may allow further reproduction and re-use of this version - refer to the White Rose Research Online record for this item. Where records identify the publisher as the copyright holder, users can verify any specific terms of use on the publisher’s website.
Takedown
If you consider content in White Rose Research Online to be in breach of UK law, please notify us by
D ylan M . Jones School of Psychology Cardiff University PO Box 901 Cardiff CF1 3YG UK
What D iffer ences Occur Bet w een
H elm et - M ount ed and D esk - T op D isplays?
A b st r act
Participantsused a helmet-mounted display (HMD) and a desk-top (monitor) display to learn the layoutsof two large-scale virtual environments(VEs) through repeated, direct navigational experience. Both VEswere ‘‘virtual buildings’’ containingmore than seventy rooms. Participantsusingthe HMD navigated the buildingssignificantly more quickly and developed a significantly more accurate sense of relative straight-line dis-tance. There wasno significant difference between the two typesof display in terms of the distance that participantstraveled or the mean accuracy of their direction esti-mates. Behavioral analysesshowed that participantstook advantage of the natural, head-tracked interface provided by the HMD in waysthat included ‘‘lookingaround’’ more often while travelingthrough the VEs, and spendinglesstime stationary in the VEswhile choosinga direction in which to travel.
1 I nt r oduct ion
Experimental studies have shown that people can ultimately develop accu-rate route- and survey-type (map perspective) spatial knowledge when they navigate large-scale virtual environments (VEs) (Ruddle, Payne, & Jones, 1997). H owever, this process typically takes a considerable amount of time.
Anecdotal and experimental evidence suggests that immersive displays such as helmet-mounted displays (H MD s) and BO O Ms are more effective than desk-top displays when VEs or teleoperation systems are used to perform some close-range tasks, such as protein molecule modeling, target detection, and tar-get tracking (H artshorn & H ubbard, 1993; Pausch, Shackelford, & Proffitt, 1993; Tachi & Yasuda, 1994). H owever, other studies found no significant differences between the two types of display when they were used to target ra-diotherapy beams (Chung, 1992), or to view a three-dimensional sculpture that was subsequently reconstructed in the real world (Mizell, Jones, Jackson, & Pickett, in press).
The physical movements that people make when they use immersive displays provide kinesthetic and vestibular feedback to changes in their orientation that is not present when people use desk-top displays, and this additional feedback may help people to develop spatial knowledge. This article presents the results of an experiment that investigated the differences that occurred when partici-pants used one type of immersive display (an H MD ) and a desk-top display to
Presence, Vol. 8, No. 2, April 1999, 157–168
r1999 bythe MassachusettsInstitute of Technology
repeatedly navigate large-scale, virtual buildings. H ow-ever, we first summarize the key differences between a range of types of VE display, making reference to studies that have investigated aspects of these differences in both virtual and real-world environments.
2 D iffer ences Bet w een V E D isplays
VEs may be viewed using devices that include desk-top displays, H MD s, BO O Ms, and spatially immer-sive displays (e.g., CAVEs and screen-projected the-aters). These devices are typically used with user inter-faces that have different characteristics, support different fields of view (FO Vs), and may lead people to perceive VEs in different ways. All of the displays support a vari-ety of resolutions (a factor that is principally affected by cost) and may be viewed in either a nonstereo or a stereo mode.
2 .1 U ser I nt er face
People typically use abstract interfaces (e.g., mouse, keyboard, joystick, or a Spaceball) to control their translationary movements and changes of direction with desk-top displays. With immersive displays, people typically use abstract interfaces to perform translationary movements, but physically turn around to change direc-tion.
When using desk-top displays, people receive feedback on their movements from visual changes in the displayed scene and the motor actions of their fingers on the inter-face devices. Visual continuity during changes of view direction is achieved by constraining the rate at which the view direction is allowed to change; even with a graphics supercomputer, the equivalent of a glance over the shoulder takes one to two seconds. The process of glancing becomes more like an implicit instruction to ‘‘rotate until you are facing the intended direction and then rotate back.’’ This changes the work required to integrate the information that is gained during the rota-tion with the user’s existing spatial knowledge.
By contrast, the visual feedback that people receive when using immersive displays is supplemented by
ves-tibular and kinesthetic feedback from their changes of direction. The effect of this additional feedback on the user’s ability to navigate is not known, but data from some real-world studies suggest that vestibular and kin-esthetic feedback help users to develop spatial knowl-edge, and that physical changes of direction are more important than physical translationary movements for the development of that knowledge (Presson & Mon-tello, 1994; Rieser, 1989; Rieser, Lockman, & Pick, 1980).
In the study by Reiser et al. (1980), participants who were congenitally blind (and therefore received no visual feedback), were shown to have developed reasonably accurate route- and survey-type knowledge of a building with which they were familiar, although their knowledge was significantly less accurate than that of normally sighted participants. H owever, the importance of ves-tibular and kinesthetic feedback to the congenitally blind participants, when compared with other methods of learning spatial knowledge such as counting steps or es-timating travel time, is not known. In the other two studies (Presson & Montello, 1994; Rieser, 1989), par-ticipants estimated directions significantly more accu-rately when they made physical changes of direction than when they imagined they had changed direction, but no significant differences occurred when participants made physical and imagined translationary movements.
investigate the transfer of spatial knowledge learned in immersive and desk-top VEs to the real world. In a two-part procedure that was repeated six times, two-participants navigated a virtual maze and then navigated a real-world version of the maze while blindfolded. N o significant differences were found between the immersive and desk-top VEs, but perhaps different effects would have been found if participants had spent more time learning the virtual maze before being first exposed to the real maze, or if the experimental assessment had taken place in the virtual maze.
Interfaces that allow people to make physical transla-tionary movements when they travel through VEs are difficult to construct, but one, the omni-directional treadmill, that is currently under development is de-signed to allow people to run or walk in any direction across a 2-D surface (D arken, Cockayne, & Carmein, 1997). An alternative to a treadmill is an interface that allows people to walk on the spot (walk in place) while traveling through VEs. In one study that investigated this type of interface, participants’ sense of presence was greater when they walked on the spot (i.e., made steps without forward motion) than when they did not, but there was insufficient evidence to suggest that the walk-ing interface also helped participants to navigate more efficiently (Slater, U soh, & Steed, 1995). Although people are likely to become tired if they travel large dis-tances using walking interfaces, this expenditure of physical effort is a desirable feature in some military training applications (D arken et al., 1997).
2 .2 FOV
N avigating VEs with a restricted FO V increases the angle to which (and the number of times) users must rotate their head in order to notice what they are walk-ing past. The geometric field of view (GFO V) of VEs may be made greater (or smaller) than the physical field of view (PFO V) by altering the viewing parameters of the VE, but this produces a distortion. For example, set-ting the GFO V to be greater than the PFO V produces the effect of looking through a wide-angle camera lens, and makes objects seem farther away and smaller than they actually are. A small GFO V (e.g., ten degrees)
ad-versely affects the user’s sense of presence in VEs when compared with larger GFO Vs (e.g., fifty or ninety de-grees) (H endrix & Barfield, 1996).
When users navigate VEs with displays that do not provide peripheral vision, they sometimes accidentally travel past their targets (Ruddle, Payne, & Jones, 1998). This situation is less likely to occur when people use dis-plays such as CAVEs, because these disdis-plays allow people to use their normal (real-world) FO V. Peripheral vision may be simulated with immersive or desk-top displays by providing peripheral viewports at the sides of the dis-plays. (See Slater & U soh, 1993.)
2 .3 Per cept ual D iffer ences
O ther, more general, perceptual differences seem to occur between different types of display. In one case, design engineers reported having a more correct under-standing of the actual size of a CAD model when they used a BO O M than when they used a desk-top display (Mizell et al., in press). A user’s sense of presence may also vary between ‘‘being inside’’ immersive VEs and ‘‘looking into’’ desk-top VEs, but the effect of presence on the user’s ability to navigate in VEs remains to be investigated.
3 Ex per im ent
3 .1 M et hod
3.1.1 Participants. A total of twelve participants (ten men and two women) took part in the experiment. They were all psychology undergraduates who volun-teered for the experiment and received course credit for their participation. They were randomly assigned to one of four groups, and these were used to counterbalance the order in which the displays were used (half of the participants used the desk-top display first and the other half used the H MD first), the order in which the build-ings were navigated, and the different building/ display combinations.
3.1.2 VE. The experiment was performed on a Silicon Graphics Crimson RealityEngine, running a C11Performer application that we designed and pro-grammed. The desk-top VE was displayed using a 21-inch (53 cm) monitor (128031024 resolution). It was positioned on a desk in front of a participant and viewed from a ‘‘normal’’ distance (approximately 60 cm). Par-ticipants were not restrained in any way. The H MD was a Virtual Research VR4 (2473230 resolution), and head-tracking was performed using a Polhemus FAS-TRAK sensor and the MR Toolkit (Green, 1995). Both types of VE used the same application update rate (20 H z) and a nonstereo graphics input.
The two virtual buildings were designed so that they each had a similar number of rooms, and the same num-ber and complexity of navigation decision points (corri-dor intersections. (See Figure 1.) Each building con-tained a lobby, and five named rooms (e.g., the seminar room) that were filled with 3-D models of characteristic furniture to enable their easy identification. The remain-der of each building was split into 75 (Building 1) or 71 (Building 2) empty rooms of roughly equal size. Each VE was texture-mapped. (A typical interior view is shown in Figure 2.) Apart from features caused by the building’s shape and the furniture in the named rooms, there were no landmarks (e.g., plants and pictures).
The user interface was similar for both displays and was mastered without difficulty by all the participants. A mouse and keyboard was used with the desk-top display, and a handheld button box, together with physical head
and body movements, was used with the H MD . The controls that are described in the following sections refer to the desk-top display. In general, the H MD controls substituted buttons for keys on the keyboard.
[image:5.612.321.539.95.542.2]Participants’ viewing and movement directions were decoupled, and this allowed them to look around easily while traveling in a straight line down corridors in the
Figure 1. The layout of Building1 (above) and Building2
VEs. When using the desk-top display, participants con-trolled their view direction in a combination of two ways: (1) by moving the mouse from side to side, the view direction could be changed by645 degrees, and (2) by holding down the left or right mouse button, a full 360-degree rotation could be performed. When us-ing the H MD , the participants’ view direction was deter-mined by their physical head and body movements and was recorded by the Polhemus sensor. The sensor was used to provide two rotational degrees of freedom (D O Fs) (heading and pitch), but only one rotational D O F (heading) was used with the desk-top display. This simplified the rotational movements made when using the desk-top display, and we do not believe the differ-ence between each display’s number of rotational D O Fs caused any of the differences recorded in the experimen-tal data.
Participants controlled their speed and altered their direction of movement by using five keys on the key-board. Four of the keys allowed participants to slow down, stop, speed up, and move at the maximum al-lowed speed (4.8 km/ h). The fifth key changed the par-ticipants’ direction of movement to the current view direction. At all times, a green triangle was projected at foot level to indicate the participants’ current direction of movement. Participants were prevented from walking
through walls by a collision-detection algorithm, and doors opened automatically when approached.
Both displays used the same geometric, horizontal FO V (ninety degrees), which was chosen so that partici-pants could ‘‘stand’’ at a corridor junction and simulta-neously see down both corridors. The physical, horizon-tal FO Vs were approximately fourty degrees (desk-top; the angle subtended by a 21-in. monitor when seen from a normal viewing distance) and fifty degrees (H MD ). It should be noted that, when using the H MD , this gave rise to a conflict between the apparent direc-tion of objects in the VE and the amount a participant needed to physically turn their head/ body in order to face the object (consider an object displayed at the right-hand edge of the H MD ; it would appear to be 25 de-grees to the right, but to face it a participant would have to turn 45 degrees to the right). H owever, none of the participants commented about this conflict. The height above the building ‘‘floor’’ at which viewing took place (effectively a participant’s virtual ‘‘eye’’ height) was set to be the same as each participant’s actual eye height. When using the H MD , participants stood inside a circu-lar barrier (900 mm high and 1 m in diameter) that was similar to the barriers found in some immersive VE games arcades and exhibition stands. It prevented par-ticipants from moving outside the working range of the Polhemus sensor and helped to keep the H MD cable away from participants’ feet.
3.1.3 Procedures. The familiarization and test procedures were the same for each participant. First, a participant was familiarized with the desk-top VE trols using a simple, practice, virtual building that con-tained a figure-eight arrangement of corridors and two rooms. Then, they were familiarized with the immersive VE controls using the same practice building. Partici-pants were allowed an unlimited amount of time for the familiarization process, and it was usually completed in 45 to 60 minutes.
[image:6.612.55.291.93.285.2]Each participant underwent two tests (one in each virtual building and one using each display) that each had the same four stages. The order in which partici-pants used the two displays and the allocation of the dis-plays to the buildings was counterbalanced. Each test
Figure 2. Aviewinside Building1. The viewisfrom beside the video
was completed during a single day. In each stage, a par-ticipant started in the lobby, visited the five named rooms in a specific order, and then returned to the lobby. In each particular building test stage, all the par-ticipants visited the rooms in the same order, but the order was varied across stages. The minimum possible dis-tance traveled in each test stage was approximately 280 m. D uring Stage 1, the experimenter read out directions describing the shortest route from the participant’s cur-rent location to the next target location (i.e., one of the named rooms or the lobby). An example route descrip-tion was ‘‘turn right out of the door, second left, and go through the door at the end.’’ The participant traveled to the location and, if they made an error, they were cor-rected immediately. When they reached the location, they pressed the ‘‘y’’ key. This triggered the display of a message on the screen, specifying the name of the next location to be visited. The message was removed after a few seconds, but could be redisplayed at any time if the participant pressed the ‘‘h’’ key. Then, the experimenter read out the description of the shortest route to the next location. This sequence of events continued until the participant had successfully visited each of the five target rooms and returned to the lobby.
In Stage 2, the participant followed verbal descrip-tions of the shortest route to the five named rooms, but was told to find their own way back to the lobby, for which the following ‘‘2.5-minute rule’’ applied. If, after 2.5 minutes, the participant had not reached the lobby, the experimenter gave verbal instructions describing the shortest route to the lobby, which the participant then followed. H owever, if, after 2.5 minutes, the participant was traveling directly towards the lobby but had not yet arrived, they were allowed to continue unaided but were immediately given verbal instructions if they deviated from the shortest route.
D uring Stage 3, the participant had to find their own way to the five rooms and the lobby, but the 2.5-minute rule was applied for each of these locations to place a limit on the amount of time participants spent inside the VE. Stage 4 was identical to Stage 3, except that, when the participant pressed the ‘‘y’’ key to indicate their ar-rival in each of the five rooms, the VE software moved them to the center of the room, and then the participant
made estimates of direction and of straight-line distance (respectively, the VE-orientation and VE-straight data) to the other four rooms. To make the direction esti-mates, participants rotated their direction of view until they thought they were facing directly toward the appro-priate room and indicated this by pressing the ‘‘y’’ key, which caused the view direction to be recorded. For each distance estimate, a Motif window was displayed into which either the participant typed their estimate (desk-top) or the experimenter typed the participant’s spoken estimate (H MD ). The Motif window was visible in the H MD .
A five-minute break was taken between each test stage. To help alleviate eyestrain during the H MD tests, participants also took a five-minute break approximately every fifteen minutes (if the stage lasted longer than fif-teen minutes, which Stage 4 always did). After complet-ing the H MD test, participants completed a short ques-tionnaire (see Annex 1) that was based on the
questionnaire used in the N ASA H ubble Space Tele-scope study (Loftin & Kenney, 1994) and which was primarily designed to investigate any side-effects felt by the participants. Three participants withdrew while us-ing the H MD , citus-ing nausea, and were replaced.
3 .2 Result s
3.2.1 N avigation and Spatial Knowledge. Each participant’s route-finding ability was measured both in terms of the distance that they traveled between the lo-cations and the time that they took. The distance-trav-eled metric was calculated by computing the distance a participant traveled in each test stage as a percentage in excess of the minimum possible distance (PE-distance). The time-taken metric (PE-time) used a similar calcula-tion, with the minimum possible time calculated by di-viding the minimum possible distance by the maximum speed of movement (4.8 km/ h). Participants’ apprecia-tion of relative distance in the buildings was calculated by correlating their VE-straight distance estimates with the corresponding actual distances. The distribution of this correlation was then normalized using Fisher’s
r-to-z transformation. The accuracy of participants’
mean angular error of their VE-orientation estimates. The order in which participants used the two types of display was treated as a between-groups variable, but this was not significant for any of the analyses.
Participants’ PE-time data for the unguided stages (Stages 3 and 4) were analyzed using a repeated-mea-sures analysis of variance (AN O VA). Figure 3 shows that, as expected, participants navigated significantly more quickly in Stage 4 than in Stage 3 (F(1,
10)58.07, p,0.05). There was no main effect of dis-play type (F(1, 10)52.43, p.0.05), but planned con-trasts showed that participants navigated significantly more quickly with the H MD than with the desk-top dis-play in Stage 3 (F(1, 10) 510.01, p,0.05). The dif-ference for Stage 4 was not significant, and there were no significant interactions.
Participants’ PE-distance data for the unguided stages were also analyzed using a repeated-measures AN O VA. Figure 4 shows that, contrary to expectations, there were no main effects for stage number (F(1, 10)52.70,
p.0.05), or for the display type (F(1, 10)50.12,
p.0.05), and there were no significant interactions. Planned contrasts showed that there were no significant differences between the two types of display for Stage 3 or Stage 4.
The accuracy of participants’ survey knowledge was assessed using their VE-straight and VE-orientation esti-mate data. A repeated-measures AN O VA of the data, illustrated in Figure 5, showed that participants made
significantly more accurate estimates of relative straight-line distance when they used the H MD than when they used the desk-top display (F(1, 10) 55.77, p,0.05). There was no significant difference in the absolute per-centage error of participants’ straight-line distance esti-mates (H MD , M 554%; desk-top, M577%), and par-ticipants showed no consistent tendency to under- or overestimate the distances with either type of display.
[image:8.612.54.310.94.236.2]The trend found in the data for the PE-time and rela-tive straight-line distance estimates (which suggests that participants learned some components of spatial knowl-edge more quickly with the H MD ) was also found in the
Figure 3. Mean percentage extra time (PE-time) taken by
participantswhen usingthe HMD and the desk-top display. Error Bars indicate MSE.
Figure 4. Mean percentage extra distance (PE-distance) traveled by
[image:8.612.294.544.96.241.2]participantswhen usingthe HMD and the desk-top display. Error bars indicate MSE.
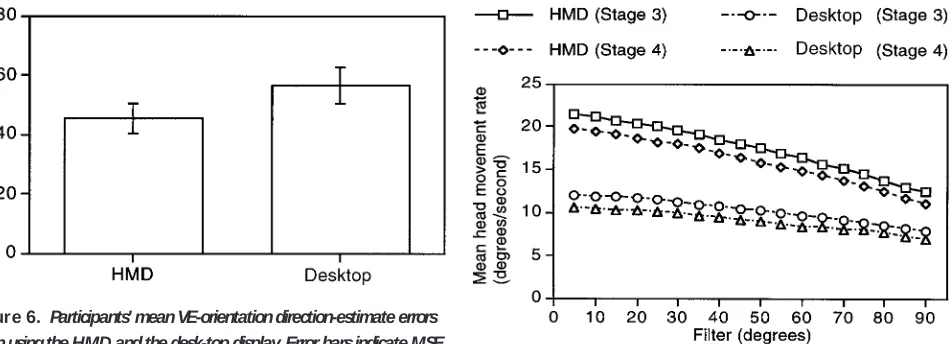
Figure 5. Participants’ mean straight-line distance (VE-straight)
[image:8.612.308.547.324.462.2]direction estimate data. (See Figure 6). H owever, a re-peated-measures AN O VA showed that the difference between the two types of display was not significant (F(1, 10)54.43, p.0.05).
3.2.2 Behavioral Differences. Participants aided their navigation by looking around at decision points and glancing into rooms as they passed. As has already been noted, one of the primary differences between H MD s and desk-top displays lies in the mechanism that users use to control their direction of view (head and body movements when using an H MD but, typically, a mouse when using a desk-top display). Participants’ mean head movement rates (the rates at which partici-pants looked around while navigating the VEs) were measured by calculating the total movement of their head during each test stage (in degrees) and dividing by the length of time they took to complete the stage (ex-cluding the time taken to perform the distance and di-rection estimates and any rests taken to relieve eye-strain). These data were then filtered to remove head movements smaller than the filter amount (e.g., thirty degrees) from the calculation. Figure 7 shows that par-ticipants looked around more when using the H MD than when using the desk-top display. To see into a room as they approached, participants had to look ap-proximately thirty degrees to one side. A repeated-mea-sures AN O VA, computed using a thirty-degree filter, showed that participants looked around significantly more when they used the H MD than when they used
the desk-top display (F(1, 11)561.49, p,0.0001). When using the desk-top display, participants often stopped before looking to each side, either to look into a room or to look down a corridor. Another repeated-measures AN O VA, illustrated in Figure 8, showed that participants spent less time stationary when using the H MD than when using the desk-top display (F(1, 11)514.44, p,0.005), and planned contrasts showed that this difference was significant for both Stage 3 (F(1, 11)526.99, p,0.0005), and Stage 4 (F(1,
11)518.67, p,0.005).
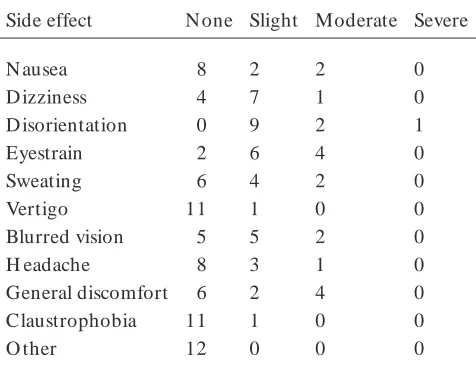
3.2.3 Q uestionnaire. D ata from the question-naire are summarized in Table 1. All twelve of the par-ticipants who completed the study reported at least two ‘‘slight’’ side effects (Annex 1, Q uestion 2). Three par-ticipants withdrew from the study while using the H MD . O ne of these participants withdrew during the H MD practice and reported ‘‘moderate’’ nausea and dizziness. The other two participants withdrew during the first (guided) H MD test stage and reported ‘‘severe’’ nausea and either ‘‘moderate’’ or ‘‘severe’’ dizziness. (See Table 2.) N one of the participants who either com-pleted the study or withdrew reported experiencing doublevision. The evaluative questions (question 4 through question 9) indicated that all participants who completed the study enjoyed taking part. H owever,
partici-Figure 6. Participants’ mean VE-orientation direction-estimate errors
when usingthe HMD and the desk-top display. Error barsindicate MSE.
Figure 7. Participants’ mean head movement rateswhen usingthe
[image:9.612.82.558.93.265.2]pants were not asked to complete the questionnaire after using the desk-top display and, therefore, it was not possible to compare these data between the two display types.
3 .3 D iscussion
The overall goal of the study was to perform a baseline investigation that compared navigation and spa-tial knowledge acquisition in large-scale virtual buildings using an H MD and a desk-top display. Each participant spent an average of thirty minutes traveling approxi-mately 1.5 km during the unguided stages of each test.
O n average, participants navigated the virtual buildings twelve percent quicker when using the H MD . H owever, participants did not travel a correspondingly shorter dis-tance when using the H MD . (In fact, they traveled an average of three percent farther, but the difference was not statistically significant.) Instead, the majority of par-ticipants’ increased speed was derived from changes in behavior between the two display types. When using the desk-top display, participants often stopped before alter-ing their direction of view to look into rooms to see if they contained any furniture or to look down corridors at junctions. By contrast, participants spent approximately eight percent less time stationary when using the H MD and ‘‘looked around’’ more while they were moving.
[image:10.612.53.296.90.237.2]O ne explanation for this behavioral difference may be that the H MD provided an interface in which changes in view direction were natural (i.e., head and body move-ments) and required less effort (e.g., quick glances, rather than holding down a mouse button). This expla-nation is supported by data that showed that the rate at which participants looked around was significantly greater when they used the H MD than when they used the desk-top display. (See Figure 7.) The pattern of par-ticipants’ head movements also differed slightly, with 66%of participants’ view direction changes being greater than ninety degrees when using the desk-top display, but a more gradual range of movements being used with the
Figure 8. Mean amount of time that participantsspent stationary
when usingthe HMD and the desk-top display. Error barsindicate MSE.
T able I. Physical, HMD Side Effectsof the Twelve Participants WhoCompleted Study
Side effect N one Slight Moderate Severe
N ausea 8 2 2 0
D izziness 4 7 1 0
D isorientation 0 9 2 1
Eyestrain 2 6 4 0
Sweating 6 4 2 0
Vertigo 11 1 0 0
Blurred vision 5 5 2 0
H eadache 8 3 1 0
General discomfort 6 2 4 0
Claustrophobia 11 1 0 0
O ther 12 0 0 0
T able II. Physical, HMD Side Effectsof the Three Participants WhoWithdrewFrom the Study
Side effect N one Slight Moderate Severe
N ausea 0 0 1 2
D izziness 0 0 2 1
D isorientation 0 2 1 0
Eyestrain 0 3 0 0
Sweating 1 2 0 0
Vertigo 0 3 0 0
Blurred vision 3 0 0 0
H eadache 0 1 2 0
General discomfort 1 2 0 0
Claustrophobia 2 1 0 0
[image:10.612.307.545.124.309.2] [image:10.612.56.294.333.516.2]H MD (57%greater than ninety degrees). This suggests that people who use H MD s in VEs are less likely to travel past something (for example, an object which is set to one side) without noticing it. By contrast, infor-mal observation suggests that participants sometimes developed ‘‘tunnel vision’’ when they used the desk-top display, traveling past their desired location without modifying their view direction to see it.
Participants developed a significantly more accurate sense of relative straight-line distance when they used the H MD than when they used the desk-top display. Knowledge of the relative distances between locations is an important component of spatial knowledge, but the reason for the difference is unclear. H owever, it may be related to general perceptual differences that are caused by being ‘‘inside’’ immersive VEs and the more realistic percep-tion of size that was found by Mizell et al. (in press).
Witmer and Kline (1998) found that people tend to underestimate distances in VEs. In the present study, participants showed no consistent tendency to either under- or overestimate distances with either type of dis-play, but factors that are likely to have affected these data are the discrepancy between the GFO V of the VEs and PFO Vs of the displays, and the ability of individual par-ticipants to estimate distances in the real world. Con-trary to expectations, the accuracy of participants’ direc-tion estimates was not significantly enhanced by the kinesthetic feedback that was provided when the H MD was used.
The present study is only one step toward our overall goal of understanding the effects of using immersive displays to navigate VEs. Further studies are planned in which participants will navigate VEs for longer periods of time. This will allow us to investigate whether or not the time advantage of using an H MD is present only when people initially navigate a VE, as suggested by the PE-time data. (There was a significant difference be-tween the displays for Stage 3 but not for Stage 4.) O ther planned changes from the method used for the present study include using more-complex virtual build-ings, with an increased time penalty for poor naviga-tional learning, the use of a between-participants design to overcome the learning effect that was probably pre-sent when participants navigated the second building
(see Ruddle et al., 1998), and the use of virtual build-ings that have corridors that are curved or intersect at angles other than ninety degrees. O ther studies are re-quired to investigate the effects of simulated-walking interfaces, treadmills, and roving interfaces (i.e., those that use extended-range sensors to allow people to walk around inside VEs).
Finally, landmarks have been shown to aid navigation in VEs (D arken & Sibert, 1996; Ruddle et al., 1997). Participants in the present study looked around more when they used the H MD . Therefore, it is possible that landmarks will be noticed more when an H MD is used and, as a result, will provide a greater aid to navigation.
Refer ences
Chung, J. C. (1992). A comparison of head-tracked and non-head-tracked steering modes in the targeting of radiotherapy treatment beams. Proceedings of the 1992 A CM Sym posium
on Interactive 3D Graphics. 193–196.
Darken, R. P., Cockayne, W. R., & Carmein, D. (1997). The omni-directional treadmill: A locomotion device for virtual worlds. Proceedingsof A CM User Interface Software &
Technol-ogy Conference (UIST ’97) (pp. 213–221). New York: ACM.
D arken, R. P., & Sibert, J. L. (1996). N avigating large virtual spaces. International Journal of H um an-Com puter
Interac-tion, 8, 49–71.
Green, M. (1995). The MR Toolkit Version 1.4 [Computer pro-gram]. D epartment of Computing Science, U niversity of Alberta, Canada.
H artshorn, M., & H ubbard, E. (1993). Interactive protein modelling. In K. Warwick, J. Gray, & D . Roberts. (Eds.),
Virtual reality in engineering (pp. 25–32). London: IEE.
H endrix, C., & Barfield, W. (1996). Presence within virtual environments as a function of visual display parameters.
Pres-ence: Teleoperators and Virtual Environm ents, 5, 274–289.
Loftin, R. B., & Kenney, P. J. (1994). Virtual environments in training: N ASA’s H ubble space telescope mission.
Proceed-ings of 16th Interservice/ Industry Training, System s & Edu-cation Conference (IITSEC ’94). http:/ / www.vetl.uh.edu/
H ubble/ hubble.html.
Mizell, D ., Jones, S., Jackson, P., & Pickett, D . (in press). Is VR better than a workstation? A report on human perfor-mance experiments in progress. In M. Go¨bel (Ed.), Virtual
Pausch, R., Shackelford, M. A., & Proffitt, D . (1993). A user study comparing head-mounted and stationary displays.
Pro-ceedings of IEEE Sym posium on R esearch Frontiers in Virtual R eality, 41–45.
Presson, C. C., & Montello, D . R. (1994). U pdating after ro-tational and translational body movements: Coordinate structure of perspective space. Perception, 23, 1447–1455. Rieser, J. J. (1989). Access to knowledge of spatial structure at
novel points of observation. Journal of Experim ental
Psychol-ogy: Learning, Mem ory and Cognition, 15, 1157–1165.
Rieser, J. J., Lockman, J. L., & Pick, Jr., H . L. (1980). The role of visual experience in knowledge of spatial layout.
Per-ception & Psychophysics, 28, 185–190.
Ruddle, R. A., Payne, S. J., & Jones, D . M. (1997). N avigating buildings in ‘‘desk-top’’ virtual environments: Experimental investigations using extended navigational experience.
Jour-nal of Experim ental Psychology: A pplied, 3, 143–159.
Ruddle, R. A., Payne, S. J., & Jones, D . M. (1998). N avigating large-scale ‘‘desk-top’’ virtual buildings: Effects of orienta-tion aids and familiarity. Presence: Teleoperators and Virtual
Environm ents, 7, 179–192.
Slater, M., Alberto, C., & U soh, M. (1994). In the building or through the window? An experimental comparison of im-mersive and non-imim-mersive walkthoughs. Proceedings of
Vir-tual R eality Environm ents in A rchitecture and Design.
Slater, M., & U soh, M. (1993). Simulating peripheral vision in immersive virtual environments. Com puters & Graphics, 17, 643–653.
Slater, M., U soh, M., & Steed, A. (1995). Taking steps: The influence of a walking technique on presence in virtual real-ity. A CM Transactions on Com puter-H um an Interaction, 2, 201–219.
Tachi, S., & Yasuda, K. (1994). Evaluation experiments of a teleexistence manipulation system. Presence: Teleoperators
and Virtual Environm ents, 3, 35–44.
Waller, D ., H unt, E., & Knapp, D . (1998). The transfer of spa-tial knowledge in virtual environment training. Presence:
Teleoperators and Virtual Environm ents, 7, 129–143.
Witmer, B. G., & Kline, P. B. (1998). Judging perceived and traversed distance in virtual environments. Presence:
Teleop-erators and Virtual Environm ents, 7, 144–167.
Annex 1: Questionnaire
Congratulations! You have survived the immersive/ helmet phase of this experiment. Thank you very much for your time and effort. The following questions refer specifically to your experience of virtual reality using the helmet and handheld control box. Please answer each question and, if you wish to add any comments, please feel free to do so.
1. H ave you ever used a virtual reality system of any type before participating in this experim ent?
yes ( ) no ( )
2. If you experienced any of the following side effects while inside the virtual environm ent, please indicate the level of
discom fort (m ark as m any as apply).
SID E EFFECT N O N E SLIGH T MO D ERATE SEVERE
A. nausea ( ) ( ) ( ) ( )
B. dizziness ( ) ( ) ( ) ( )
C. disorientation ( ) ( ) ( ) ( )
D . eyestrain ( ) ( ) ( ) ( )
E. sweating ( ) ( ) ( ) ( )
F. vertigo ( ) ( ) ( ) ( )
G. blurred vision ( ) ( ) ( ) ( )
H . headache ( ) ( ) ( ) ( )
I. general discomfort ( ) ( ) ( ) ( )
G. claustrophobia ( ) ( ) ( ) ( )
Annex 1: Questionnaire (Continued)
3. Did you experience double-vision? yes ( ) no ( )
4. H ow enjoyable/ interesting was your interaction with the virtual environm ent? (Please indicate by circling the corresponding number rating).
1 2 3 4 5
Boring Captivating
Why/ Comments?
5. Was it easy for you to becom e ‘‘absorbed’’ in the virtual environm ent?
1 2 3 4 5
D ifficult Very easy
Why/ Comments?
6. H ow difficult was it for you to m aneuver through the environm ent with the handheld controls?
1 2 3 4 5
Very difficult Very easy
Why/ Comments?
7. H ow often did you have to spend tim e thinking about the hand controls with respect to the actual task?
1 2 3 4 5
N ever Very frequently
Why/ Comments?
8. H ow m uch did using the hand controls distract you from concentrating on the virtual environm ent task?
1 2 3 4 5
N ot at all Extremely
distracting distracting
Why/ Comments?
9. H ow distracting was it for you that there was another person in the room whilst you were im m ersed in the virtual
environm ent?
1 2 3 4 5
N ot at all Extremely
distracting distracting