This is a repository copy of A framework for utility data integration in the UK. White Rose Research Online URL for this paper:
http://eprints.whiterose.ac.uk/4876/
Proceedings Paper:
Beck, A.R., Fu, G., Cohn, AG et al. (2 more authors) (2007) A framework for utility data integration in the UK. In: Rumor, M., Coors, V. and Fendel, E.M., (eds.) Urban and Regional Data Management: UDMS 2007. 26th Urban Data Management Symposium, October 10-12, 2007, Stuttgart, Germany. Taylor and Francis , pp. 261-276. ISBN 9780415440592
[email protected] https://eprints.whiterose.ac.uk/
Reuse
See Attached
Takedown
If you consider content in White Rose Research Online to be in breach of UK law, please notify us by
promoting access to White Rose research papers
White Rose Research Online
Universities of Leeds, Sheffield and York
http://eprints.whiterose.ac.uk/
White Rose Research Online URL for this paper: http://eprints.whiterose.ac.uk/4876/
Published paper
Beck, A.R., Fu, G., Cohn, A.G., Bennett, B. and Stell, J.G. (2007) A framework
for utility data integration in the UK. In: Rumor, M., Coors, V. and Fendel, E.M.,
(eds.) Urban and Regional Data Management: UDMS 2007. 26th Urban Data Management Symposium, October 10-12, 2007, Stuttgart, Germany. Taylor and Francis, pp. 261-276. ISBN 9780415440592
1 INTRODUCTION
Information exchange and re-use is crucial to many organisations throughout the world. However, some business domains involve different organisations that, although nomi-nally in competition, must share information. Privatised utility companies in the UK are one such example.
Every year, in excess of four million holes are dug in UK roads to repair assets, provide connecting services to new premises and to lay new cables and pipes. Although recently installed assets may have been well mapped, location and attribute data on older ser-vices can be very poor, in some cases even non existent (except perhaps knowing the location of the terminating points). This poor data quality can lead to unnecessary holes dug in the wrong place and third party damage to other underground services. Equally important, there are also considerable indirect costs owing to disruption on the roads caused by works, waste and pollution. The core of the problem is that there is at present insufficient and inadequate knowledge about what is where. What information there is, is not always used to its maximum benefit.
It is postulated that improving mechanisms of integrating and sharing knowledge on utility assets and the location of street works will lead to a reduction in the amount of street works in the UK by improving both the co-ordination of works and the quality of
A framework for utility data integration in the UK
A. R. Beck, G. Fu, A. G. Cohn, B. Bennett & J. G. Stell
School of Computing, University of Leeds, UK
information which is shared. This paper describes the progress made by the School of Computing at the University of Leeds on these issues in both the Mapping The Under-world (MTU: www.mappingtheunderworld.ac.uk) and Visualizing integrated informa-tion on buried assets to reduce streetworks (VISTA: www.vistadtiproject.org) projects. We start with an overview of the problem and current industrial practices, then present a conceptual framework that is designed to support utility knowledge and data integration, and report on the progress made on utility data acquisition. This is followed by a discus-sion on our initial experimental results on schema integration.
2 BACKGROUND
The development of buried utility infrastructure goes hand in hand with urbanism. Pota-ble water and waste disposal systems have been part of the urban fabric for millennia. In the UK, most modern utility systems have their developments in the 19th century and coalesced into the five main utility services: electricity, gas, sewer, telecommunications and water.
As these networks developed, new infrastructure was required. Much of this was laid in the street. Initially new services were laid alongside those that were already there with the result that the underground space became congested relatively quickly. This infra-structure can now be found hiding beneath our feet in the unseen maze of pipes and ca-bles, some of which have never been accurately mapped or recorded - making them dif-ficult to find when repairs are necessary.
Since the mid 19th century, asset records have been transferred between different or-ganisations as the structure of the industries changed. For the majority of the 20th cen-tury these records were generated and maintained by teams of cartographers. The re-cords were drawn on a variety of different media chosen for their integrity (ease of storage, degradation over time, durability, warping etc.) which included paper, tracing cloth and drafting film. Ordnance Survey mapping was generally used as a reference source with some companies annotating their records directly onto map sheets1. Over time, methods of communicating asset information, such as symbology and company standards, were informally developed for each of the utility domains. Although both the Highways Authorities and Utilities Committee (HAUC) and the National Joint Utilities Group (NJUG) have developed codes of practice to help in identifying and recording assets (for example HAUC (2002) and NJUG (2003)), no standards are available for how this information should be visualized.
Since the mid 1980s, most utility companies have made significant progress towards digitisation of their utility records (Arnott & Keddie (1992), Halfawy et al (2005)). Al-though digital records can be utilised within GIS asset management systems to accrue a number of benefits (notably improved analysis, representation and reporting and argua-bly a reduction in cost), the process of digitisation has the potential to dilute record quality in a number of ways. Information loss can occur through such issues as organ-isational decisions (a decision is taken not to digitise some components of the record, for example service connections), poor digitising methods, missing or out of date re-cords, incomplete rere-cords, human error and inappropriate quality control. These conver-sion issues compound errors inherent in the source material.
1
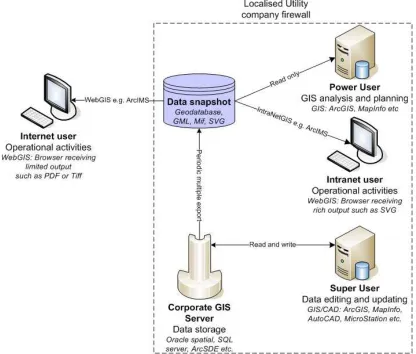
Once created, the digital records have continued to develop and are embedded within many organisational functions. The data models have become enriched, resulting in data that can be used in a range of modelling and business scenarios (e.g. topological net-work analysis, 3d gravity flow applications, fault reporting and billing systems). As a result, a number of different computerized systems have developed: it is not uncommon for companies to employ several different software packages and file formats for stor-ing, editstor-ing, analysing and viewing asset data (see Figure 1). Different users of these systems can have access to the asset data directly, over the corporate intranet and over the internet.
Figure 1 Conceptualised utility GIS framework
10% of unrecorded assets exist in its network. Marvin and Slater (1997) estimate that the location of only 50% of buried infrastructure is accurately known. The mechanisms of provision (most end-users receive a paper map at a fixed scale) and the reduction in information content can lead to unnecessary street works as the planners and excavators are working with incomplete knowledge. This is exacerbated as each utility company employs their own methods for data recording and presentation and there is significant variability within each sector. Both MTU and VISTA have components that examine innovative ways of integrating utility data that provide a more effective means of repre-senting this knowledge.
Figure 2 VISTA Partner Utility Service Areas (excluding telecoms)
2.1 VISTA and MTU
The School of Computing within Leeds University is a member of the VISTA project.
Engi-neering and Physical Sciences Research Council funded project, Mapping the Under-world (MTU).
The VISTA project is limited to utility assets in the United Kingdom. However, as de-scribed in Figure 2 the current utility partners have service areas that are predominantly based in England.
The Leeds components of the MTU and VISTA projects are, amongst other things, re-searching techniques to enhance and integrate existing legacy asset information and de-velop novel techniques to display the resulting knowledge to field teams and network planners. VISTA will provide the type of information outlined in section 6.3.1 of AM-TEC (2004).
3 RELATED RESEARCH
For utility assets held in a digital format, the differences in data systems, structures and formats limits the ability to integrate data from different utilities effectively. This has the potential to hinder its usefulness in street works and has been recognised by the Na-tional Underground Assets Group (NUAG (2006)). The heterogeneities are caused by many factors but the main reason is that utility knowledge and data is typically autono-mous, i.e. created and maintained independently by individual utility companies. Fur-thermore, the data is encoded in an uncoordinated way, i.e. without consideration of compatibility and interoperability2 with other utility systems. This practice is under-standable as the principal remit for digitising assets is to improve operational systems for the company and not to improve data sharing. This means that different companies have different abstracted views of reality and consequently record different asset data. Overcoming these heterogeneities is an essential first step to achieve utility integration and move towards interoperability.
3.1 Heterogeneities in the Utility Domain
According to our investigations and reports from UK utility companies, this group of heterogeneities covers a wide range of issues, from the underlying data models, to the very kind of data and information that are being stored. For the purpose of discussion, we classify heterogeneities associated with utility records into the three categories dis-cussed by Bishr (1998): syntactic heterogeneity, schematic heterogeneity and semantic heterogeneity.
3.1.1 Syntactic Heterogeneity
Syntactic heterogeneity refers to the difference in data format. The same logical model can be represented in a range of different physical models (for example ESRI shape file or GML). The treatment of spatial data varies greatly, from compressed binary data (such as a scan), to data models specifically designed for spatial data (Rigaux et al
(2001)). This mismatch between underlying data models implies that the same informa-tion could be represented differently in different utility systems. The most profound dif-ference is in the storage paradigm: relational or object orientated.
However, as described in Figure 1, users in a corporate framework may not be aware of how the underlying data is actually stored: they are only aware of the ‘view’ of the data
2
to which they have access. Hence, organisations can have an extremely rich data model and can limit how much of this model different users can view.
Partner utility companies rely on a range of different GIS including GE Smallworld, ESRI ArcMAP, AutoDesk MAP and MapINFO, employing a range of storage solutions including Oracle, SQL server and ArcSDE.
3.1.2 Schematic Heterogeneity
The database schema is designed at the conceptual modelling stage and reflects each company’s abstracted view of reality. Hence, different hierarchical and classification concepts are adopted by each company to refer to identical or similar real world objects. Heterogeneities can arise at this level in many forms due to the different domain percep-tions and interests of different user groups. For example, the type of information re-corded, the ways that this information is represented, the ways that different types of in-formation relate to each other, and various semantics attached to utility records, as detailed below:
• structures: different utility databases have different record structures. • semantics: elements encoded at the schema level are usually attached with
some data semantics. The following are some typical semantic heterogeneities existing among utility records:
o type mismatch occurs when same class of data are assigned with
dif-ferent data types, e.g. one utility system may use a text field to record material type whilst another uses a numeric field.
o range mismatch arises when different utility systems allow their data
items to have different value ranges.
• granularity: different systems encoding data at different levels of detail, e.g.
one utility system encodes mains pipes whilst another also encodes service pipes.
3.1.3 Semantic Heterogeneity
Semantic heterogeneity can be subdivided into naming and cognitive heterogeneities. Naming mismatch arises when semantically identical data items are named differently or semantically different data items are named identically in different utility systems. Naming heterogeneities can be relatively easily reconciled with a thesaurus although schematic granularity can be a problem. Different companies, or utility domains, have subtly different cognitive views of the world which means that they describe similar real word objects from different perspectives. Reconciling these cognitive heterogeneities is more difficult but is achievable through ontology mapping.
The following are typical examples of heterogeneities arising at the data level:
• unit mismatch arises when the same objects are represented using different
units, e.g. mile in one system but metre in another system.
• spatial reference mismatch occurs when different spatial reference systems are
used to specify the data.
• scale mismatch occurs when utilities encode their data at different levels of
accuracy. For example, one system records and maintains its data with an ac-curacy at centimetre scale while another can only guarantee acac-curacy at metre scale.
• other data level heterogeneities exist. For example, one system encodes utility
3.2 Previous research on Knowledge and Data Integration
Several research communities (including databases, artificial intelligence and informa-tion integrainforma-tion) have studied different integrainforma-tion techniques to resolve informainforma-tion heterogeneities. A principal objective of integration research is to study how heteroge-neous information can be reconciled in such a way that a homogeheteroge-neous and unified rep-resentation of this information can be constructed. Several research topics are relevant to this application.
Integration architectures Two representative integration architectures are global
schema based and peer to peer architectures. Systems with a global schema based archi-tecture are characterized by a global schema which represents a reconciled view of the underlying sources (Motro (1987), Motro et al (2004)). A peer to peer integration sys-tem allows peers (i.e., participating data sources) to query and retrieve data directly from each other (Halevy et al (2003)). Integration systems also differ from each other in having an architecture that supports either virtual or materialized integration. The for-mer approach supports integration in a virtual fashion – all data sources remain at the local level, and queries to these data sources are expressed against a virtual, integrated view. In the materialised integration approach, data sources are merged into a single da-tabase, which is maintained centrally. Queries are expressed against the integrated schema, but without accessing the local databases directly.
Similarity Measure A fundamental operation for integration is the similarity measure,
which takes two or more schemas/databases as input and produces a mapping between elements that correspond semantically to each other. Similarity measures are typically performed based on clues such as element names, types, data values, structures, and in-tegrity constraints. In addition to attribute properties, some techniques explore how spa-tial properties can be employed to measure whether two elements match each other or not (Samal et al (2004)). The spatial properties used include, the position of objects, ob-ject geometry and various spatial relations between them.
Matching Discovery Methods Many matching solutions employ hand-crafted rules to
match schemas/databases (Madhavan et al (2001)). A broad variety of rules have been considered. A common example is that two elements match if they have the same name and the same structure. Systems compute the similarity of matching elements as a weighted sum of the similarities of various features considered, e.g. name, data type, and inheritance relationship etc.
An alternative technique is to use learning based methods to discover matching pairs (Doan et al (2001)). For example, the SeMint system (Li & Clifton (2000)) uses a neu-ral network learning approach. It matches schema elements based on attribute specifica-tions (e.g. data types, scale, constraints etc.) and statistics of data content (e.g. maxi-mum, minimaxi-mum, average, and variance). The main benefit of learning-based approaches is that they maximally support automated integration, though human efforts are required to obtain training data.
Mapping Representation This research studies how to specify the correspondence
Schema Merging For a global schema based architecture, the global schema itself is based on the inter-schema relationships (i.e. the mappings between the global and local schemas) produced during the similarity measure (Devogele et al (1999), Lawrence & Barker (2001)). In schema merging, each mapping element is analysed to determine if and how it will be included in the global schema. The concern here is to resolve various conflicts that may exist, e.g. naming conflicts and structural conflicts, as a result of a different choice of modelling constructs or semantic constraints.
3.3 Discussion of Data and Knowledge Integration in VISTA and MTU
Although the existing research provides a framework, many utility specific heterogenei-ties remain to be resolved. For example, different units and reference systems are rea-sonably constrained as all companies use the Ordnance Survey National Grid projection. However, the Positional Accuracy Improvement (PAI - Ordnance Survey (2007)) pro-gramme, used to address accuracy issues in Ordnance Survey data that became apparent after the introduction of absolute positioning technologies (such as GPS), provides an 95% accuracy estimate of 1m in urban environments. The differences in precision and accuracy of relative and absolute positioning devices may increase data uncertainty. Furthermore, 3-dimensional representations of utility asset may be problematic. If the 3rd dimension is recorded, it is normally as a depth (a relative measure) or an Ordnance Survey height (an absolute measure). However, these fields are variably populated in every asset dataset. The challenge here is to identify the appropriate measurements and apply them to the 2-d polylines to create topologically correct 3-d polyline networks. Finally, though the literature is rich on techniques for resolving various heterogeneities, the assumption is that various meta-data and documentation is available to assist inte-gration work. Without good quality metadata some problems may be intractable.
4 A FRAMEWORK FOR UTILITY KNOWLEDGE AND DATA INTEGRATION
The previous sections have introduced the nature of utility asset data in the UK and the range of heterogeneities that exist within the utility domain. In response to this, we have designed a conceptual framework which supports utility knowledge and data integra-tion. The assistance of partner utility organisations has been essential in the design of this framework. They have provided us with a range of information including data and metadata pertaining to their individual physical and logical data models.
The framework is characterised by a number of features:
• The framework supports utility integration at two levels: the schema level and
the data level. The schema level integration ensures that a single, unified inter-face is provided to access utility data in a consistent way, and to enable un-derground asset data from multiple utilities to be represented in a common format. The data level integration improves utility data quality by reducing in-consistency, duplication and conflicts.
• A virtual approach for integration is employed. This is justified by the fact
that utility data is usually autonomous and it changes frequently due to the ongoing need for installing, repairing or replacing utility assets. A virtual ap-proach preserves the autonomy and distribution of data3 and at the same time ensures that up to date utility data are available.
3
• A global schema (common data model) based architecture is adopted. • A bottom up approach is employed to construct the global schema/model of
utility data. This contrasts with many other domains, where shared, standard models/ontologies usually exist, and such models are often adopted as the common data model to support integration.
The framework incorporates the following assumptions:
• Data will only flow from utility companies to consumers. The current
frame-work will not allow users to update records in utility data stores.
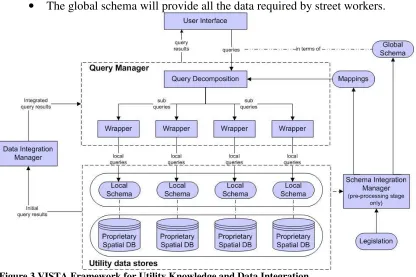
[image:11.595.86.502.186.463.2]• The global schema will provide all the data required by street workers.
Figure 3 VISTA Framework for Utility Knowledge and Data Integration
As shown in Figure 3, the main components of the framework are the Schema Integra-tion Manager, Data IntegraIntegra-tion Manager and Query Manager. The Schema Integration Manager is designed to support schema level integration, which is mostly performed at the pre-processing stage of the utility integration. It takes schema level knowledge, gov-ernment legislation, codes of practice and users’ knowledge as inputs, and produces mappings between global and local schemas as well as the global schema.
4.1 Schema Integration Manager
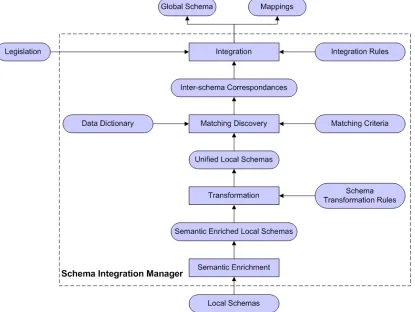
[image:12.595.89.504.176.488.2]The range of strategies for holding buried asset data means that a Schema Integration Manager is required to reconcile heterogeneities. The Schema Integration Manager is responsible for reconciling schema level heterogeneities of utility records. It takes utility schemas as the input and produces a global schema and mappings between elements of the global schema and local ones that correspond semantically to each other. Figure 4 shows the constituent components of the Schema Integration Manager.
Figure 4 Schema Integration Manager
The Semantic Enrichment component complements existing local schemas with addi-tional data semantics which are either missing or can not be expressed in the specified local data models. This information is provided by domain experts or utility data admin-istrators. The Transformation component takes semantically enriched local schemas and translates them into a common data model (or formalism) according to a set of trans-formation rules. Since utility data are spatial, this may include turning raster data into vector data, or vice-versa.
global and local schemas4. National legislation is taken into account at this stage to en-sure that the global schema constructed conforms to government, and other agreed, standards. Domain experts are required to verify whether the defined mapping is correct and unambiguous based on their knowledge of the semantics of the data.
4.2 Query Manager
[image:13.595.87.499.261.477.2]Requests for data arrive in the form of queries expressed in terms of the global schema. The Query Manager rewrites them into queries that can be understood by local utility DBMSs. The rewritten queries are then processed by the local utility database and the corresponding results retrieved. Since data retrieved from various local databases may contain duplications or conflicts, data level integration must be performed (see below) before the retrieved results can be sent back to the query manager. Figure 5 shows the constituent components of the Query Manager.
Figure 5 Query Manager
To cope with platform heterogeneities of utility DBMSs, a query is usually expressed in a standard query language, e.g. SQL. When such a query is accepted by the Query Man-ager, it is firstly sent to the Query Decomposition component which unwraps the query using the definition specified in the mappings generated by the Schema Integration Manager, and translates it into several sub-queries expressed in terms of local schemas. Each sub-query is then forwarded to a wrapper, which is a component which communi-cates with a specific utility database. A wrapper translates a sub-query expressed in a standard query language into the one in the local query language, and retrieves data from an underlying utility data store. Once initial query results are obtained from local DBMSs, they are sent to the Data Integration Manager to resolve duplication or con-flicts.
4
4.3 Data Integration Manager
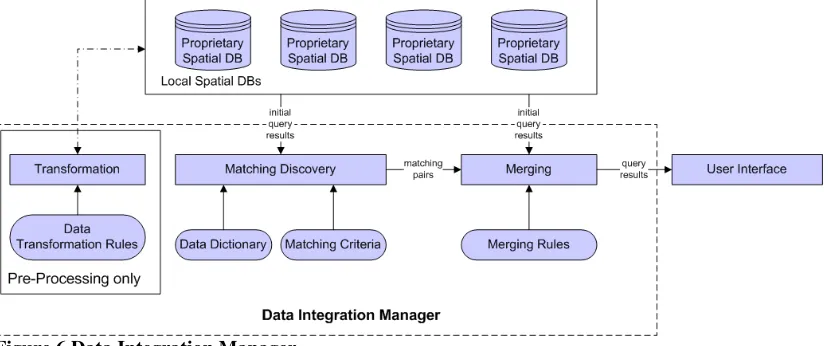
The Data Integration Manager is responsible for reconciling data level heterogeneities of utility records. It takes all the query results (often with duplication and conflicts) re-trieved from local utility DBMSs as input and generates a merged query result. Accurate data is retained, redundancies are eliminated, and data conflicts are reconciled. The final query result is sent to the Query Manager. Figure 6 shows the constituent components of the Data Integration Manager.
[image:14.595.88.502.271.444.2]The main components of Data Integration Manager are the Transformation, Matching Discovery and Merging components. The Data Integration Manager resolves inconsis-tencies arising at the data level, for example transforming all geometric data into a sin-gle, agreed spatial reference system, and converting data into a common unit: for exam-ple all length data into metres and all diameter measurements into millimetres. This process is performed at the pre-processing stage according to pre-defined transformation rules.
Figure 6 Data Integration Manager
The Matching Discovery component identifies potentially identical data instances com-ing from different utility data stores, accordcom-ing to matchcom-ing criteria. Both the spatial and a-spatial properties of utility records take part in the matching process as well as in de-signing matching criteria. As with the Data Integration Manager, a data dictionary or a light-weight ontology may be employed to resolve the semantic heterogeneities at this level.
The Merging component takes a set of candidate matching pairs produced in the match-ing component, and a pair is merged into a smatch-ingle instance if it satisfies the mergmatch-ing rules. Again, domain experts may verify that the merging process produces correct and unambiguous results.
4.4 Potential implementation issues
operational data and security. Although this does not affect the proof of concept goal for this project it will ultimately impact on any future implementation phases. Therefore, we have considered mechanisms of bypassing direct access to any primary data stores. One solution is to access data snapshots held in an interoperable file format (such as Geography Markup Language (GML) or as a Web Feature Service (WFS)). This has a number of benefits:
• The utility company retains full autonomy of its primary data store.
• Only the attributes required by MTU/VISTA will be exported, ensuring the
security of non-essential, but potentially sensitive, data.
• The underlying data store can be changed with only minimal impact on the
framework.
• The interoperable file can be held on a separate utility server with specific
[image:15.595.85.502.255.490.2]se-curity settings.
Figure 7 GML based virtual schema
Figure 7 describes a GML based virtual schema based on this virtual integration model. If such a system is desirable and the security implications can be resolved then it may be possible to store the data snapshots on a secure server outside the utility company’s firewall. This would allow the data sets to be integrated incrementally (every time a snapshot is updated) reducing the need, and processing overhead, of dynamically inte-grating the data with every query request. Response time would be improved and the data could be used in a number of other scenarios (for example, as an emergency re-sponse resource). This would result in a materialized rather than a virtual view the data would still be up-to-date, although at a lower level of temporal granularity.
5 SCHEMA INTEGRATION
auto-mated and semi-autoauto-mated techniques were employed to determine schema mappings. Unfortunately the heterogeneities in the supplied data models meant that this approach was unsuccessful. Hence, the global schema was defined manually.
5.1 Manual schema integration
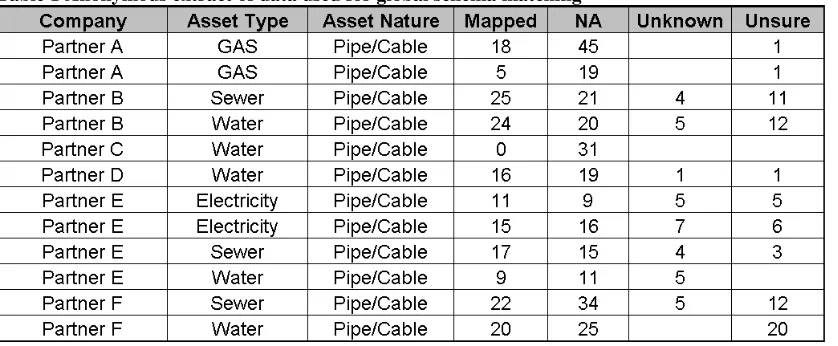
[image:16.595.87.506.297.470.2]Each of the original databases had a range of different asset records for each domain. Although each of these record types was nominally structured by their geometry (mainly polyline for pipes, points for network furniture), the differences in representa-tion between the utility companies was significant. Some companies held a single point, polyline and polygon spatial database and relied on the attributes to distinguish between the different asset types. Other companies provided multiple spatial databases corre-sponding to the different asset types in their network (each with their own set of attrib-ute information). For practical reasons the domain of the problem was reduced by focus-ing only on principal pipe/cable datasets from each of the utility companies (see Table 1).
Table 1 Anonymous extract of data used for global schema matching
A database was created that summarised the nature of each asset type and recorded the field names, data types and value examples for each field in the supplied physical model of the spatial databases. Using the supplied metadata (logical model and other support-ing documentation) logical mappsupport-ings and explicit definitions were added to these re-cords wherever possible. A key issue in resolving semantic heterogeneity is the acquisi-tion of appropriate metadata and discerning the semantic relaacquisi-tionships between
constructs of the different database schemas. Variable levels of metadata were provided by the utility companies which made this matching process difficult.
in the Global Schema). Data from Partner C data has not yet been mapped owing to dif-ficulties in interpreting the fields in the physical model.
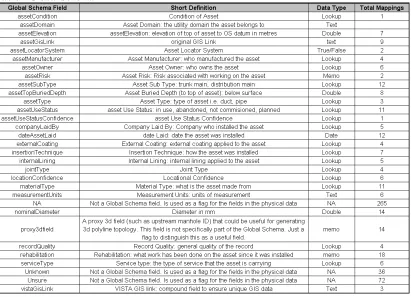
Transformation issues were recorded for each field. Two principal types of transforma-tion issue were encountered:
• Consistency reconciliation: how units or measurements require transforming
for a consistent representation. For example, all depths/height should be to the top of the asset.
• Data Dictionary (lookup table) reconciliation: how different data dictionaries
[image:17.595.90.501.206.503.2]can be merged to generate a global utility domain data dictionary.
Table 2 Global Schema
5.2 Global Schema validation
At the beginning of 2007 a second call for data was issued to each of the project utility partners. The data from this call is being used, amongst other things, to validate the global schema described above. This validation occurs by mapping utility data directly onto the global schema under the supervision of a domain expert from each company. The software package RadiusStudio from 1Spatial (www.1spatial.com) is used to man-age these mappings between the utility schema and the global schema. RadiusStudio maintains mappings and transforms as metadata which can be accessed via a web server. This means that any changes to the mappings can be easily reviewed and vali-dated by domain experts.
Although this work is still on-going, the initial findings are that the global schema is ro-bust. The majority of field declarations are appropriate. Some fields, such as jointType
6 FURTHER WORK
Once the global schema mapping has been completed against all utility partners a sec-ond, and hopefully final, version of the global schema will be produced. The final schema will place attributes into two categories: core attributes and extended attributes. Core attributes are essential elements of the schema that are required by end users. Ex-tended attributes enrich the data model but are not essential for its successful implemen-tation. After the mapping and transforms have been determined for each utility partner then the software architecture and delivery systems will be generated.
To represent data in the integrated utility data store, VISTA is developing a visualiza-tion service which will deliver maps on the fly that are tailored for specific user needs (e.g. utility providers, utility contractors, highway agencies and local authorities). Each user group has different requirements for the display of raw data and the various uncer-tainties associated with this data. The visualization service responds to user requests by retrieving data from the data store, enriching the retrieved information and then visual-izing the output. Our initial work (Boukhelifa & Duke (in press)) addresses the visuali-zation needs of users who would like maps of utility data to be delivered via a web in-terface. Thus, we are working on a visualization web service that generates data
requests (via a web interface allowing the user to, for example, specify the geographical extents of the area of interest and types of assets to be visualized). The retrieved data is then enriched with a set of asset rules that govern how to display the raw asset data and a set of uncertainty rules that augment the display based on available information on certainty (such as information on the provenance of data and locational and attribute un-certainty). The output is rendered and displayed using a web browser as a 2D map. Our future work will explore 3D visualizations and various techniques for uncertainty visu-alization.
Finally, the University of Leeds is working on mechanisms to integrating non-vector holdings into each data store. This, predominantly, raster data is not amenable to direct integration in the manner detailed in this document without further work to convert the scans to vector format. The approach of utility companies to raster to vector conversion (RVC) has been almost exclusively manual or semi-automated. We are not currently aware of any utility companies in the UK that have used an automated RVC system to import non-digital data into a GIS. We are developing algorithms that encode and im-pose semantic features on the raw raster data automatically (Hickinbotham & Cohn (in press)).
7 ACKNOWLEDGEMENTS
We gratefully acknowledge the financial support of EPSRC under grant EP/C014707/1, the UK Department of Trade and Industry and the in kind contributions from VISTA partners (VISTA is a consortium consisting of over 20 partners (listed at
www.vistadtiproject.org)).
8 REFERENCES
AMTEC Consulting Group. 2004. Street and highway works research study. Depart-ment for Transport report SW/REP/002-R09
Arnott, D. & Keddie, A. 1992. Data Capture – The standards and procedures utilised within Northumbrian Water Group. In Proceedings of the Association for Geographic Information conference, pages 2.12.1 – 2.12.6
Boukhelifa, N. & Duke, D. J. in press. The Uncertain Reality of Underground Assets. Joint Workshop "Visualization and Exploration of Geospatial Data", ISPRS, ICA, DGFK. June 27-29, 2007. Sttutgart.
Bishr, Y. 1998. Overcoming the Semantic and Other Barriers to GIS Interoperability.
International Journal of Geographical information Science, 12(4): 299-314
Doan, A., Domingos, P. & Halevy, A. Y. 2001. Reconciling Schemas of Disparate Data Sources: A Machine-Learning Approach. SIGMOD record, 30(2): 509-520
Devogele, T., Parent, C. & Spaccapietra, S. 1999 On Spatial Database Integration. In-ternational Journal of Geographical Information Science, 12(4):335–352
Friedman, M., Levy, A. Y. & Millstein, T. D. 1999. Navigational Plans For Data Inte-gration. In Proceedings of 16th National Conference on Artificial Intelligence, pages 67–73
Highway Authorities and Utilities Committee. 2002. Code of practice for the recording of underground apparatus in streets. London: HMSO
Halevy, A. Y. 2001, Answering Queries Using Views: A Survey. The VLDB Journal, 10(4):270–294
Halevy, A., Ives, Z., Suciu, D. & Tatarinov, I. 2003. Schema Mediation in Peer Data Management Systems. In Proceedings of the 19th International Conference on Data Engineering, Bangalore
Halfawy, M. R., Newton, L. A. & Vanier, D. J. 2005. Municipal Infrastructure Asset Management Systems: State-of-the-Art Review. In CIB W78 Conference on Information Technology in Construction, pages 1–8.
Hickinbotham, S. J. & Cohn, A. G. in press. Knowledge-based recognition of utility map sub-diagrams, ICDAR 2007
Lawrence, R. & Barker, K. 2001. Integrating Relational Database Schemas Using A Standardized Dictionary. In Proceedings of the 2001 ACM symposium on Applied com-puting, pages 225–230, 2001.
Li, W. S. & Clifton, C. 2000. SEMINT: a Tool For Identifying Attribute Correspon-dences in Heterogeneous Databases Using Neural Networks. In Data and Knowledge Engineering, 33(1):49–84
Motro, A., Berlin, J. & Anokhin, P. 2004. Multiplex, Fusionplex, and Autoplex - Three Generations of Information Integration. In SIGMOD Record, 33(4):51–57
Madhavan, J., Bernstein, P. A. & Rahm, E. 2001, Generic schema matching with cupid. In The VLDB Journal, pages 49–58
Motro, A. 1987. Superviews: Virtual Integration Of Multiple Databases. In IEEE Transaction on Software Engineering, 13(7):785–798
McBrien, P. & Poulovassilis, A. 2003. Data integration by bi-directional schema trans-formation rules. In Proceedings of the 19th International Conference on Data Engineer-ing, pages 227–238
Marvin, S. & Slater, S. 1997. Urban infrastructure: the contemporary conflict between roads and utilities. In Progress in Planning, 48 (4): 247-318
NJUG. 2003. Guidelines on the Positioning and Colour Coding Utilities’ Apparatus. Technical report, National Joint Utilities Group, UK
NUAG. 2006. Capturing, recording, storing and sharing underground asset informa-tion – A review of current practices and future requirements. UKWIR Report
Ordnance Survey, 2007, http://www.ordnancesurvey.co.uk/oswebsite/pai/, accessed 30th May 2007
Parker, J. 2006. Minimising Street Works Disruption: Buried Asset Data Collection and Exchange Field Trials. UKWIR Report 06/WM/12/9
Rigaux, P., Scholl, M. & Voisard, A. 2001. Spatial Databases: With Application to GIS. Morgan Kaufmann


![Full text and summary of a speech [on international trade in textiles] by the Rt. Hon. Sir Christopher Soames, Vice-President of the Commission of the European Communities in charge of external trade relations, to the International Federation of Cotton an](data:image/gif;base64,R0lGODlhAQABAIAAAP///wAAACH5BAEAAAAALAAAAAABAAEAAAICRAEAOw==)