Dr. Amalesh Samanta Associate Professor
Dept. of Pharmaceutical Technology, Jadavpur University,Kolkata [W.B.] India E-mail: [email protected] Address for correspondence
Access this article online www.japer.in
Study of resistance in bacterial environment and comparing drug
sensitivity by plasmid curing technique isolating herbal
compound
INTRODUCTION
Coccinia grandis (L.) Voigt. (Family: Cucurbitaceae) is a climber or trailer type plant generally distributed throughout the tropical countries of Asia and Africa. [1] Since long before the leaves are consumed to control hyperglycemia as indigenous system of medicine.[2-4] Unani system of medicine also reports that various preparation of the plant parts were used for ulcer. [5] Another species, Coccinia indica also possess analgesic and hepatoprotective property. [6] Plant isoprenoids effect growth (e.g., the hormone gibberellic acid) and contribute to carotenoid formation. In animals, isoprenoids comprise various oily or waxy substances such as fish liver oils, wool wax, the yellow pigments in egg yolk, butterfat, feathers and fish scales. [7, 8] Isoprenoids are not uniformly distributed among plants or animals, but certain classes of these
compounds are typical of broad groups of tissues. Few species of plants contain the polyterpene hydrocarbon rubber. The resin acids of pine trees and the rubber found in the latices of various plants may serve as wound-healing agents. Tetraterpene carotenoid pigments are the source of vitamin-A, essential for vision and is involved in growth, reproductive function and neural development in animals. [9] Other vitamins that are entirely or partly isoprenoid include vitamin-E, important in reproduction. Vitamin-K is necessary for the blood-clotting process. [10] Ubiquinones (coenzyme Q) which are involved in the derivation of energy by the oxidation of food are also formed from isoprenoids. [7, 11, 12] Products derived from turpentine include ingredients for perfumes, vitamin-A, lubricant additives, insecticides, resins, industrial chemicals etc. [13] Resin usually modified by chemical treatment is widely used to make inexpensive soaps and coating materials. [14]
MATERIALS AND METHODS
All reagents and chemicals used here are of the highest purity, commercially available (Merck, Mumbai, India).
At present resistance in bacterial environment has become a threatening global problem to us. We removed plasmid DNA for comparing drug sensitivity between plasmid containing and plasmid cured bacterial strains by isolated compound. Petroleum ether extract of the leaves of Coccinia grandis (L.) Voigt. (Family: Cucurbitaceae) was used to isolate one isoprenoid compound (Polyprenol C-60). Plasmid containing two bacterial strains of
Escherichia coli (ATCC 25938) and Bacillus cereus (IMAUB1022) were cultured in nutrient broth media & drug resistance was studied using Chloramphenicol (reference drug) 1 µg/ml for Bacillus cereus (IMAUB1022) & 5µg/ml for Escherichia coli (ATCC 25938). Polyprenol C-60 was used in concentration 5 µg/ml for both Bacillus cereus (IMAUB1022) &
Escherichia coli (ATCC 25938). The genes responsible for resistance to Chloramphenicol and Polyprenol C-60 are present on plasmid DNA of both Bacillus cereus (IMAUB1022) and Escherichia coli (ATCC 25938). The presence of resistance gene in mega plasmid was concluded by the result of plasmid curing. Both Polyprenol (C-60) and Chloramphenicol exhibited resistance to Bacillus cereus (IMAUB1022)and Escherichia coli (ATCC 25938) before plasmid curing & exhibited sensitivity to both after plasmid curing confirmed that the resistance is plasmid mediated.
Keywords: Bacterial environment, Plasmid, Resistance, Bacillus cereus (IMAUB1022),
Escherichia coli (ATCC 25938). ABSTRACT
ABSTRACT ABSTRACT ABSTRACT Bolay Bhattacharya, Debmalya
Mitra, Arnab De, Partha Sarathi Roy, Amalesh Samanta*
Division of Microbiology, Department of Pharmaceutical Technology, Jadavpur University, Kolkata-700032, India.
Isolation of pure compound
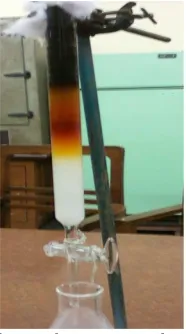
Petroleum ether extract (12.55 g) of the leaves of the plantwas dissolved in chloroform. Silica gel (60-120 mesh for column chromatography) was added to it and stirred well to make slurry. Now the column was filled with petroleum spirit and checked for any leakage. [15] Now Silica Gel (60-120 mesh for column chromatography) is suspended in petroleum spirit and continuously added from the top of the column with occasional stirring and subsequent removal of solvent from the bottom of the column. [16] As petroleum spirit extract was selected, less polar constituents should be there. [17] Fig. 1. represents column chromatography of petroleum spirit extract producing bands. Fractionation was started with petroleum spirit alone first. Now the fractions are dried and TLC is performed using benzene, chloroform and ethyl acetate (6:3:1). Gradually solvent polarity is increased by incorporating chloroform into petroleum spirit. Fraction which produced maximum quantity of constituents after drying is subjected to repeated column chromatography in similar way by gradual increase of solvent polarity until the desired compound is separated as single TLC spot. [15] Now the compound is recrystallized. Mass spectra, 13 C NMR and 1 H NMR are performed to elucidate the structure of the compound. After interpretation of above data one isoprenoid compound was established. [18-20]
Figure-1: Column Chromatography of Petroleum spirit extract producing bands.
Gel Electrophoresis
Each bacterial strain of Escherichia coli (ATCC 25938) and Bacillus cereus (IMAUB1022) were
collected from single colony and inoculated into 20 ml Luria Bertani (LB) media separately. The strains were incubated overnight at 37ºC under microaerophillic
conditions. Then the inoculums were centrifuged at 10,000 rpm for 10 minutes at 4ºC. Thereafter the cell
pellets were collected and suspended in 100 μl of Solution Iand vortexed. Now 200 μl of Solution II was added. The suspension is then shaken gently and incubated in ice for 10 minutes. After that 150 μl of Solution III was addedto the mixture and incubated again for 10 minutes. Now the mixture was centrifuged again at 10,000 rpm for 15 minutes at 4ºC. Thereafter the supernatant from each tube was collected and kept into separate Eppendorf tubes. Now 500 μl of phenol and chloroform mixture (1:1) was added into each Eppendorf tubes. The tubes were then shaken well. In each tube two phases were separated by centrifugation at 10,000 rpm for 15 minutes at 4ºC. From each tube aqueous layers were separated and transferred to fresh Eppendorf tubes. Thereafter 1000 μl of 70% Ethanol was added into each tube and incubated for 10 minutes at room temperature. The suspensions in each Eppendorf tubes were centrifuged 10,000 rpm for 15 minutes at 4ºC and supernatants from each tube were discarded. Now precipitated plasmid DNA was dried at room temperature for 30 minutes and dissolved into 50 μl of TE Buffer. [21, 22] Details of media and reagent solutions are mentioned in Table 1 and Table 2.
Table 1: Details of Luria Bertani broth, Solution I and Solution II
Luria Bertani (LB)
broth (g /100ml) Solution I Solution II
Yeast extract : 0.5 Glucose : 0.45g NaOH : 1(N) 2ml
NaCl : 0.5 Tris-HCL : 1(M) 1.25ml , pH-8.0
SDS : 10% 1ml
Tryptophan : 1.0 EDTA : 0.5(M) 1ml, pH-6.0
Distilled water : 7.0ml
Table 2: Details of Solution III, TAE Buffer and TE Buffer
Solution III TAE Buffer TE Buffer
Potassium acetate : 2.944g Tris-Base : 4.84g 1 (M) Tris-HCl (pH-8.0): 500 μl
Distilled water : 5.0 ml Glacial acetic acid : 1.15ml 0.5 (M) EDTA (pH-6.0) : 50 μl
pH : 4.8(Adjust with glacial acetic acid) 0.5 (M) EDTA : 2ml Distilled water : 49.45 ml
Volume made upto 10ml with distilled water pH : 8
Volume made upto 1Lit. with distilled water
Gel Electrophoresis of Plasmid DNA was conducted utilizing horizontal Gel Electrophoresis. Ethidium bromide is added to the molten agarose to make a final concentration 0.5 μg/ml (from a stock of 10 mg/ml) and mixed gently. Here TAE buffer was poured into the gel tank till the buffer level stands at 0.5 to 0.8 cm above the gel surface. After that the power cord was connected to the power supply and electrophoresis is conducted according to the convention i.e. red: anode, black: cathode. Three different DNA samples were loaded in the wells in the desired order. Now the voltage was set to 50 volt and the power supply is switched on. The power was switched off when the tracking dye (bromophenol blue) reached three-fourth of the gel length from the well. After the electrophoresis is over, DNA samples can be visualized under UV transilluminator appearing as fluorescence. No destaining is required here. [23] DNA is negatively charged at neutral pH and when electric field is applied across the gel, DNA migrates towards the anode. Migration of DNA through the gel is dependent upon molecular size of DNA, agarose concentration, conformation of DNA and applied current. Two commonly used dyes are xylene cyanol and bromophenol blue that migrate at the same speed as double stranded DNA of size 5000 bp and 300 bp respectively. These tracking dyes are negatively charged, low molecular weight components that are loaded along with each sample at the start of run, when the tracking dye reaches towards the anode, run is terminated. [24] Best resolution of fragments is attained by applying not more than 5 volts per cm to the gel. Different buffers have been recommended for electrophoresis of DNA. The most
commonly used are TAE (tris-acetate-EDTA) and TBE (tris-borate-EDTA). Buffers not only establish a pH but provide ions to support conductivity also. [25]
Plasmid Curing
Ethidium bromide (EtBr) was utilized to eliminate plasmids from above two bacterial strains to ensure whether the resistance gene is encoded by a plasmid or not. [21] Above two bacterial strains were targeted for plasmid curing by using ethidium bromide. At first stock solution (100μg/ml) of curing agent (EtBr) was prepared in distilled water. Now 100 μl of inoculum of each bacterial strain was added to LB media containing 100 μg/ml of EtBr and incubated at 37ºC for 24 hours. Overnight growth was allowed. Thereafter 100 μl of resistant cultures of both bacterial strains were spread on four nutrient agar media plates separately, two containing isolated drug molecule and Chloramphenicol (reference drug) for
Bacillus cereus (IMAUB1022) and remaining two for
Escherichia coli (ATCC 25938). From literature it was found that the MIC of Chloramphenicol for Bacillus cereus (IMAUB1022)was 1-4 mg/L i.e. 1-4 µg/ml. [26] The MIC for Escherichia coli (ATCC 25938) strains are more than or equals to 32 µg/ml. [27] We used the reference drug Chloramphenicol (1 µg/ml for Bacillus cereus & 5 µg/ml for Escherichia coli) and isolated drug molecule Polyprenol C-60 (5 µg/ml for both
RESULTS AND DISCUSSION
Data interpretation from Mass spectra, 13 C NMR
and 1 H NMR
Here Petroleum spirit extract was utilized for repeated silica gel column chromatography. Petroleum spirit-Chloroform (80:20) soluble fraction was collected. One pale yellow compound is separated from this fraction. From ES-MS of the compound a peak is produced at m/z 852.9 corresponding to [M [NH.sub.4]] [.sup.] ion. [29]
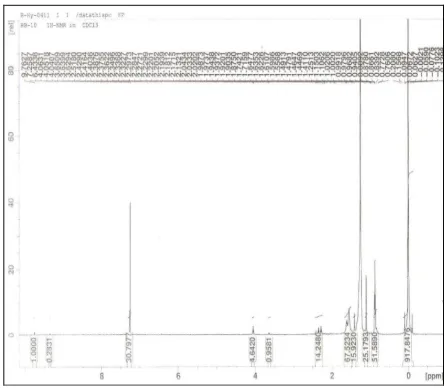
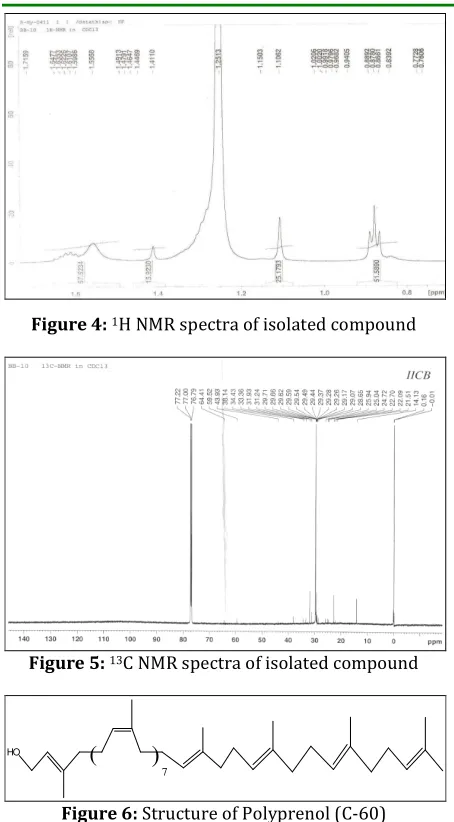
The NMR spectrum is producing such a splitting pattern which suggests that the compound is one open chain terpene derivative containing many isoprene units. It indicates that the compound is a Polyprenol. The 1H-NMR spectrum produced in solvent [C.sub.6] [D.sub.6]-[d.sub.6] produced a triplet (J = 6.88 Hz) at [delta] 5.39 for the aliphatic methine at position C-2. Here is another similar type triplet at [delta] 5.17 (J = 6.88 Hz) was suggested as the methine (at C-46) alpha to the quaternary carbon C-47 containing the extreme methyl group. At [delta] 5.29 the multiple equivalents to 10 protons were obtained on account of the remaining methines. Due to resonating signals present in between [delta] 2.19 and 2.03, 22 methylene groups were recognized. Total number of methyl groups recognized is 13. Among them the peaks at [delta] 1.75 and 1.72 were for seven methyl groups from cis-units and those at [delta] 1.64 equivalents to 12 protons were for four methyl protons from trans-units. At [delta] 1.56 the peak was due to the methyl protons of the extreme dimethyl allyl group. Thus, various [delta] values of methyl groups produced the difference in methyl groups from various units. In such a way the cis and trans-methyl groups were recognized as because signals for methyl protons of cis-unit occur at lower magnetic field than those for trans-unit. In this way the terpene was recognized belonging to the family of 'three trans and poly cis' type. [30] Moreover the 13C NMR hereby expressed related signals of methyl carbons attached to trans and cis isoprene units. The terminal methyl group is expressed by the downfield methyl signal at [delta]
26.3. At [delta] 23.9, 23.8 and 23.7, other signals expressed the other methyl carbons of the cis isoprene unit of the chain. At [delta] 18.2 and 16.4, the higher field methyl signals were due to the two intervening methyl carbons and one terminal methyl carbon of the trans isoprene unit, respectively. [18] The methylene bearing the hydroxyl group produced the peak at [delta] 59.2. At [delta] 138.9, the most downfield peak of one carbon was produced due to the carbon alpha to - [CH.sub.2] OH group (C-3). At [delta] 131.4, the most high-field quaternary signal was produced for the C-47 carbon atom of ES-MS and two terminal methyl groups. These spectral data interpretation from Mass spectra (Fig. 2.), 1 H NMR (Fig. 3, Fig. 4.) and 13 C NMR (Fig. 5.) is utilized to elucidate the structure of the isolated compound to be a Polyprenol (C-60) (Fig. 6.).
Figure 2: FAB-MASS spectra of isolated compound
Figure 4:1H NMR spectra of isolated compound
Figure 5:13C NMR spectra of isolated compound
HO
(
)
7
Figure 6: Structure of Polyprenol (C-60)
Visualization of DNA fragments
Since DNA is not naturally colored, it will not be visible on the gel. Hence the gel, after electrophoresis, is stained with a dye specific to the DNA. Discrete bands are observed when there is enough DNA material present to bind the dye to make it visible, otherwise the band is not detected. The gel is observed against a light background wherein DNA appears as dark colored bands. Plasmid DNAs were isolated from both Bacillus cereus (IMAUB1022)and
Escherichia coli (ATCC 25938). Both the two bacterial strains produced a plasmid profile of single band with base pairs of around 45 Kb suggesting that both the bacterial strains contain mega plasmids.
Bacterial resistance & sensitivity
If the resistance genes are encoded by genomic DNA or Plasmid DNA, can be ascertained by curing
technique. Here reference drug Chloramphenicol and isolated drug Polyprenol C-60 were subjected to study bacterial resistance using curing agent, EtBr. When Plasmid curing is over, it was noticed that both
Bacillus cereus (IMAUB1022) and Escherichia coli
(ATCC 25938)become sensitive to Chloramphenicol and Polyprenol C-60 but before plasmid curing they exhibited resistance in those bacterial environment. This finding suggests that the genes for Chloramphenicol and Polyprenol C-60 resistance of both Bacillus cereus (IMAUB1022)and Escherichia coli
(ATCC 25938) are present on plasmid DNA on them. [31] Results of comparative study of drug resistance in bacterial environment has been shown in Fig. 7. and Fig. 8.
(a) (b)
Figure 7: Decrease of Chloramphenicol resistance of (a)Bacillus cereus (IMAUB1022) and(b)Escherichia
coli (ATCC 25938) after treating with Ethidium bromide.
(a) (b)
Figure 8: Decrease of Polyprenol (C-60) resistance of (a)Bacillus cereus (IMAUB1022) and(b)Escherichia
coli (ATCC 25938) after treating with Ethidium bromide.
Interpretation
From the Fig. 9., we can observe that λ-genomic DNA being high molecular weight runs least distance from the wells than other two plasmid DNAs of
Bacillus cereus (IMAUB1022) and Escherichia coli
faster than the nicked form due to its compact structure. Plasmid DNA of Bacillus cereus
(IMAUB1022) produces more than one band due to similar types of nicked and supercoiled forms of DNAs. λ-genomic DNA (48Kb) marker shows one band on the gel at 48 Kbp. Here the Marker is the digested form of λ-genomic DNA (48Kb) with restriction enzyme. DNA fragments/bands are separated from each other based on individual molecular weight and charge distribution. DNAs being negatively charged move towards the positive electrode (Anode). Some bacterial flora are available in adverse environmental situation may contain plasmids in various frequency and size. [32] Some Bacillus species possess large plasmids supporting the presence of such plasmids in above Bacillus strain. [22] Similarly some Escherichia
coli (ATCC 25938) strains possess large plasmids supporting the presence of such plasmids in above
Escherichia coli (ATCC 25938) strain. The primary purification of a 6.1 kilo base pair (kbp) plasmid from a desalted alkaline lysate has been accomplished by a thermoseparating aqueous two-phase system [(50% ethylene oxide–50% propylene oxide)–Dextran T 500]. The partitioning of the different nucleic acids (plasmid DNA, RNA, genomic DNA) in the thermo separating aqueous two-phase system was followed both qualitatively by agarose gel electrophoresis and quantitatively by analytical chromatography (size exclusion- and anion-exchange mode) and Pico Green fluorescence analysis. [33] Here plasmid curing was conducted to study whether the Polyprenol (C-60) and Chloramphenicol resistance were plasmid mediated or not. After plasmid curing both Polyprenol (C-60) and Chloramphenicol exhibited sensitivity to
Bacillus cereus (IMAUB1022) and Escherichia coli
(ATCC 25938) confirmed that the resistance is plasmid mediated. [34-36] Other study shows that the presence of resistance gene in mega plasmid was confirmed by the result of plasmid curing. [37] Supportive findings were reported by many investigators. [38, 39]
CONCLUSIONS
Recently resistance in bacterial environment is an alarming universal problem. Here, after plasmid curing both Polyprenol (C-60) and Chloramphenicol exhibited sensitivity to Bacillus cereus (IMAUB1022) and Escherichia coli (ATCC 25938) confirmed that the resistance is plasmid mediated. Some drugs may be isolated from natural source that can function bypassing plasmid mediated bacterial resistance, making the drug sensitive to plasmid containing strains also. Naturally bacterial resistance can be controlled in a rational way.
ACKNOWLEDGEMENTS
We express thankful appreciation to “Botanical Survey of India, Shibpur, West Bengal, India” for botanical identification and authentication of the plant [Sample no. BBJU-78. Ref. no.CNH/I-I/ (282)/2008/Tech. II/324 dated 16th Dec. 2008]. We also convey our gratitude to I.I.C.B., Kolkata, India for valuable advice during isolation & analysis of herbal extract and to the division of Analytical Chemistry, Jadavpur University, Kolkata, India for precious guideline regarding gel electrophoresis.
REFERENCES
1. Cooke, T. Flora of the Presidency of Bombay. Vol 1.
London: Taylor and Francis; 1903.
Lane 1: Plasmid DNA of Bacillus cereus
2. Chopra R.N., Bose J.P. Cephalandra indica
(Talakucha) in diabetes. Indian Journal of Medical
Research, 1925; 13:11-16.
3. Gupta S.S. Experimental studies on pituitary diabetes
Part III. Effect of indigenous anti-diabetic drugs
against the acute hyperglycemic response of anterior
pituitary extract in glucose fed albino rats. Indian
Journal of Medical Research, 1963; 51(4):716-724.
4. Grover J.K., Yadav S., Vats V. Medicinal plants of India
with anti-diabetic potential. Journal of
Ethnopharmacology, 2002; 81(1):81–100.
5. Jayaweera, D.M.A. Medicinal Plants: (Indigenous and
Exotic) Used in Ceylon, Part I
(Acanthaceae-Burseraceae). Colombo: National Science Council of
Sri Lanka; 1981.
6. Trease, G.E, Evans, W.C. Pharmacognosy. 15th ed.
138-139. 2008.
7. DellaPenna D., Pogson B.J. Vitamin Synthesis in
Plants: Tocopherols and Carotenoids.Annual Review
of Plant Biology, 2006; 57:711-738.
8. Benjamin M.T., Sudol M., Bloch L., Winer A.M.
Low-emitting urban forests: A taxonomic methodology
for assigning isoprene and monoterpene emission
rates. Atmospheric Environment, 1996; 30(9):1437–
1452.
9. Meissburger B., Wolfrum C. The role of retinoids and
their receptors in metabolic disorders. European
Journal of Lipid Science and Technology, 2008;
110(3):191–205.
10. Porfirova S., Bergmüller E., Tropf S., Lemke R.,
Dormann P. Isolation of an Arabidopsis mutant
lacking vitamin E and identification of a cyclase
essential for all tocopherol biosynthesis. Proc. Natl.
Acad. Sci. 2002; 99(19):12495–12500.
11. Littarru G.P., Lambrechts P. Coenzyme Q10: multiple
benefits in one ingredient. Oleagineux Corps gras
Lipides, 2011; 18(2):76-82.
12. McTaggart F., Buckett L., Davidson R., Holdgate G.,
McCormick A., Schneck D., Smith G., Warwick M.
Preclinical and Clinical Pharmacology of
Rosuvastatin, a New 3-Hydroxy-3-Methylglutaryl
Coenzyme A Reductase Inhibitor. The American
Journal of Cardiology, 2001; 87(5A):28B-32B.
13. Salah S.H., Abdou H.S., Abdel Rahim E.A. Modulatory
Effect of Vitamins A, C and E mixtures against
Tefluthrin Pesticide Genotoxicity in Rats. Research
Journal of Agriculture and Biological Sciences, 2009;
5(6):1070-1078.
14. Pathak Y.V., Rao M.N., Dorle A.K. Study of
rosin-glycerol esters as microencapsulating materials. II.
Quantitative correlation between physico-chemical
properties and release characteristics. Journal of
Microencapsulation, 1985; 2(4):327-329.
15. Fang F., Sang S., Chen K.Y., Gosslau A., Ho C.-T., Rosen
R.T. Isolation and identification of cytotoxic
compounds from Bay leaf (Laurus nobilis). Food
Chemistry, 2005; 93:479-501.
16. Still W. C., Kahn M., Mitra A. Rapid Chromatographic
Technique for Preparative Separations with
Moderate Resolution. Journal of Organic Chemistry,
1978; 43(14):2923–2925.
17. Fair J.D., Kormos C.M. Flash column chromatograms
estimated from thin-layer chromatography data.
Journal of Chromatography A, 2008; 1211:49-54.
18. Tanaka Y., Hirasawa H. Sequence analysis of
Polyprenols by 500 MHz 1H-NMR spectroscopy.
Chemistry and Physics of Lipids, 1989; 51(3–4):183–
189.
19. Balayssac S., Trefi S., Gilard V., Malet-Martino M.,
Martino R., Delsuc M.-A. 2D and 3D DOSY 1H NMR, a
useful tool for analysis of complex mixtures:
Application to herbal drugs or dietary supplements
for erectile dysfunction. Journal of Pharmaceutical
and Biomedical analysis, 2009; 50:602-612.
20. Hope K.D., Robinson C.Y., Vaezi M.F., Brouillette J.,
Muccio D.D. 13C NMR assignments of the isoprenoid
chain carbons of retinoids from empirical chemical
shift differences. Magnetic Resonance in Chemistry,
1987; 25(12):1040–1045.
21. Unaldi Coral M.N., Korkmaz H., Arikan B., Coral G.
Plasmid mediated heavy metal resistances in
Enterobacter spp. isolated from Sofula landfill, in
Adana, Turkey. Annals of Microbiology, 2005;
55(3):175-179.
22. Tanaka T., Kuroda M., Sakaguchi K. Isolation and
characterization of four plasmids from Bacillus
subtilis. Journal of Bacteriology, 1977; 129(3):1487–
1494.
23. Lindberg P., Stjernström M., Roeraade J. Gel
electrophoresis of DNA fragments in narrow-bore
capillaries. Electrophoresis, 1997; 18(11):1973-9.
24. Conlon D.R., Blankstein L.A., Pasakarnis P.A.,
determination of high-density lipoprotein
cholesterol by agarose gel electrophoresis. Clin.
Chem. 1979; 25(11):1965-9.
25. Meyers J.A., Sanchez D., Elwell L.P., Falkow S. Simple
agarose gel electrophoretic method for the
identification and characterization of plasmid
deoxyribonucleic acid. Journal of Bacteriology, 1976;
127(3): 1529-1537.
26. Luna V.A., King D.S., Gulledge J., Cannons A.C.,
Amuso P.T., Cattani J. Susceptibility of Bacillus
anthracis, Bacillus cereus, Bacillus mycoides, Bacillus
pseudomycoides and Bacillus thuringiensis to 24
antimicrobials using Sensititre(R) automated
microbroth dilution and Etest(R) agar gradient
diffusion methods. Journal of Antimicrobial
Chemotherapy, 2007; 60(3):555-567.
27. White D.G., Hudson C., Maurer J.J., Ayers S., Zhao S.,
Lee M.D., Bolton L., Foley T., Sherwood J.
Characterization of Chloramphenicol and Florfenicol
Resistance in Escherichia coli Associated with Bovine
Diarrhea. Journal of Clinical Microbiology, 2000;
38(12):4593–4598.
28. Crameri R., Davies J.E., Hutter R. Plasmid Curing and
Generation of Mutations Induced with Ethidium
Bromide in Streptomycetes. Journal of General
Microbiology, 1986; 132:819-824.
29. Wheeler J.W., Shonowo O.O. Mass spectra of bicyclic
terpenoid ketones. Organic Mass Spectrometry,
1974; 9(12):1173–1181.
30. Song Z.Z., Wang B.G., Jia Z.J. Lignan derivatives of
caffeic acids and terpenoids from Messerschmidia
sibirica L. ssp. Indian Journal of Chemistry, 1996;
35(9):955-959.
31. Spengler G., Molnár A., Schelz Z., Amaral L., Sharples
D., Molnár J. The Mechanism of Plasmid Curing in
Bacteria. Current Drug Targets, 2006; 7(7):823-841.
32. Baya A.M., Brayton P.R., Brown V.L., Grimes D.J.,
Russek-Cohen E., Colwell R.R. Coincident plasmids
and antimicrobial resistance in marine bacteria
isolated from polluted and unpolluted Atlantic Ocean
samples. Applied and Environmental Microbiology,
1986; 51(6):1285-1292.
33. Kepka C., Rhodin J., Lemmens R., Tjerneld F.,
Gustavsson P.E. Extraction of plasmid DNA from
Escherichia coli cell lysate in a thermoseparating
aqueous two-phase system. Journal of
Chromatography A, 2004; 23,1024(1-2):95-104.
34. Shehabi A.A., Mahafzah A.M., Al-Khalili K.Z.
Antimicrobial resistance and plasmid profiles of
urinary Escherichia coli isolates from Jordanian
patients. Eastern Mediterranean Health Journal,
2004; 10(3):322-328.
35. Hada H.S., Sizemore R.K. Incidence of Plasmids in
Marine Vibrio spp. Isolated from an Oil Field in the
Northwestern Gulf of Mexico. Applied and
Environmental Microbiology, 1981; 41(1):199-202.
36. Millar M.R., Griffin N., Keyworth N. Pattern of
antibiotic and heavy-metal ion resistance in recent
hospital isolates of Staphylococcus aureus.
Epidemiology and Infection, 1987; 99(2):343–347.
37. Samanta A., Bera P., Khatun M ., Sinha C., Pal P., Lalee
A., Mandal A. An investigation on heavy metal
tolerance and antibiotic resistance properties of
bacterial strain Bacillus sp. isolated from municipal
waste. Journal of Microbiology and Biotechnology
Research, 2012; 2(1):178-189.
38. Nakahara H., Ishikawa T., Sarai Y., Kondo I.
Distribution of resistances to metals and antibiotics
of staphylococcal strains in Japan. Zentralbl Bakteriol
Orig A. 1977; 237(4):470-6.
39. Fontaine T.D., Hoadley A.W. Transferable drug
resistance associated with coliforms isolated from
hospital and domestic sewage. Health Lab Sci. 1976;
13(4):238-45.
How to cite this article: Bolay Bhattacharya, Debmalya Mitra, Arnab De, Partha Sarathi Roy, Amalesh Samanta*; Study of resistance in bacterial environment and comparing drug sensitivity by plasmid curing technique isolating herbal compound; J. Adv. Pharm. Edu. & Res. 2013: 3(3): 226-233.