White Rose Research Online URL for this paper: http://eprints.whiterose.ac.uk/3418/
Article:
Brennan, Alan, Kharroubi, Samer orcid.org/0000-0002-2355-2719, O'Hagan, Anthony et al. (1 more author) (2007) Calculating partial expected value of perfect information via Monte Carlo sampling algorithms. Medical Decision Making. pp. 448-470. ISSN 0272-989X https://doi.org/10.1177/0272989X07302555
[email protected] https://eprints.whiterose.ac.uk/
Reuse
Items deposited in White Rose Research Online are protected by copyright, with all rights reserved unless indicated otherwise. They may be downloaded and/or printed for private study, or other acts as permitted by national copyright laws. The publisher or other rights holders may allow further reproduction and re-use of the full text version. This is indicated by the licence information on the White Rose Research Online record for the item.
Takedown
If you consider content in White Rose Research Online to be in breach of UK law, please notify us by
Universities of Leeds, Sheffield and York
http://eprints.whiterose.ac.uk/
This is an author produced version of a paper to be/subsequently published in Medical Decision Making. (This paper has been peer-reviewed but does not include final publisher proof-corrections or journal pagination.)
White Rose Research Online URL for this paper: http://eprints.whiterose.ac.uk/3418
Published paper
Brennan, Alan, Kharroubi, Samer, O'Hagan, Anthony and Chilcott, Jim (2007) Calculating Partial Expected Value Of Perfect Information Via Monte-Carlo Sampling Algorithms. Medical Decision Making, 27 (4). 448-470.
Calculating Partial Expected Value Of Perfect Information Via Monte-Carlo Sampling
Algorithms.
1
2
3
4
5
6
7
8
9
10
11
12
13
14
15
16
17
18
19
20
21
22
Alan Brennan, MSc(a)
Samer Kharroubi, PhD(b)
Anthony O’Hagan, PhD(c)
Jim Chilcott, MSc(a)
(a) Health Economics and Decision Science, School of Health and Related Research, The University of
Sheffield, Regent Court, Sheffield S1 4DA, England.
(b) Department of Mathematics, University of York, Heslington, York YO10 5DD, England.
(c) Department of Probability and Statistics, The University of Sheffield, Hounsfield Road, Sheffield S3
7RH, England.
Reprint requests to:
Alan Brennan, MSc
Director of Health Economics and Decision Science,
School of Health and Related Research,
The University of Sheffield,
Regent Court,
Sheffield S1 4DA,
England.
ABSTRACT
23
24
25
26
27
28
29
30
31
32
33
34
35
36
37
38
39
40
41
Partial EVPI calculations can quantify the value of learning about particular subsets of uncertain
parameters in decision models. Published case studies have used different computational approaches.
This paper examines the computation of partial EVPI estimates via Monte-Carlo sampling algorithms.
Our mathematical definition shows two nested expectations, which must be evaluated separately because
of the need to compute a maximum between them. A generalised Monte-Carlo sampling algorithm uses
nested simulation with an outer loop to sample parameters of interest and, conditional upon these, an
inner loop to sample remaining uncertain parameters. Alternative computation methods and ‘shortcut’
algorithms are discussed and mathematical conditions for their use are considered. Maxima of
Monte-Carlo estimates of expectations are biased upwards, and we demonstrate that using small samples results
in biased EVPI estimates. Three case studies illustrate (i) the bias due to maximisation, and also the
inaccuracy of shortcut algorithms (ii) when correlated variables are present and (iii) when there is
non-linearity in net-benefit functions. If relatively small correlation or non-non-linearity is present, then the
‘shortcut’ algorithm can be substantially inaccurate. Empirical investigation of the numbers of
Monte-Carlo samples suggest that fewer samples on the outer level and more on the inner level could be
efficient and that relatively small numbers of samples can sometimes be used. Several remaining areas
for methodological development are set out. Wider application of partial EVPI is recommended both for
Acknowledgements: 42
43
44
45
46
47
48
49
50
51
52
The authors are members of CHEBS: The Centre for Bayesian Statistics in Health Economics, University of Sheffield. Thanks also go to Karl Claxton and Tony Ades who were involved in our CHEBS “focus fortnight” event, to Gordon Hazen, Doug Coyle, Myriam Hunink and others for
feedback on the poster at SMDM and to the UK National Coordinating Centre for Health Technology
Assessment which originally commissioned two of the authors to review the role of modelling methods
in the prioritisation of clinical trials (Grant: 96/50/02). Thanks also to Simon Eggington of ScHARR
who programmed the new CHEBS add-in functions for sampling from the Dirichlet and Multi-Variate
Normal distributions in EXCEL. Finally, many thanks to both of the referees whose substantial
INTRODUCTION
53
54
55
56
57
58
59
60
61
62
63
64
65
66
67
68
69
70
71
72
73
74
75
76
77
78
Quantifying expected value of perfect information (EVPI) is important for developers and users of
decision models. Many guidelines for cost-effectiveness analysis now recommend probabilistic
sensitivity analysis (PSA)1,2 and EVPI is seen as a natural and coherent methodological extension3,4.
Partial EVPI calculations are used to quantify uncertainty, identify key uncertain parameters, and inform
the planning and prioritising of future research5. Many recent papers recommend partial EVPI, for
sensitivity analysis rather than alternative ‘importance’ measures6, , ,7 8 9, or for valuing research studies in
preference to ‘payback’ methods5, but do not discuss computation methods in any detail. Some of the
few published EVPI case studies have used slightly different computational approaches10 and many
analysts, who confidently undertake PSA to calculate cost-effectiveness acceptability curves, still do not
use EVPI.
The concepts of EVPI are concerned with policy decisions under uncertainty. A decision maker’s
‘adoption decision’ should be that policy which has the greatest expected pay-off given current information11. In healthcare, we use monetary valuation of health ( ) to calculate a single expected
payoff e.g. expected net benefit E(NB) = * E(QALYs) – E(Costs). Expected value of information
(EVI) is a Bayesian12 approach that works by taking current knowledge (a prior probability distribution),
adding in proposed information to be collected (data) and producing a posterior (synthesised probability
distribution) based on all available information. The value of the additional information is the difference between the expected payoff that would be achieved under posterior knowledge and the expected payoff
under current (prior) knowledge. ‘Perfect’ information means perfectly accurate knowledge i.e. absolute
certainty about the values of parameters, and can be conceptualised as obtaining an infinite sample size,
producing a posterior probability distribution that is a single point, or alternatively, as ‘clairvoyance’ –
suddenly learning the true values of the parameters. For some values of the parameters the adoption
investigating the pay-offs associated with different possible parameter values, and averaging these
results, the ‘expected’ value of perfect information is quantified. Obtaining perfect information on all the uncertain parameters gives ‘overall EVPI’, whereas ‘Partial EVPI’ is the expected value of learning
the true value(s) of an individual or subset of parameters. Calculations are often done per patient, and
then multiplied by the number of patients affected over the lifetime of the decision to quantify
‘population EVPI’. 79
80
81
82
83
84
85
86
87
88
89
90
91
92
93
94
95
96
97
98
99
100
101
102
103
104
Reviews show that several methods have been used to compute EVPI5. The earliest healthcare
literature13 used simple decision problems and simplifying assumptions, such as normally distributed net
benefit, to calculate overall EVPI analytically via standard ‘unit normal loss integral’ statistical tables14,
but gave no analytic calculation method for partial EVPI. In 19984 and 2003
15
, Felli and Hazen gave a
fuller exposition of EVPI method, with a suggested general Monte-Carlo random sampling procedure for
partial EVPI calculation and a ‘shortcut’ simulation procedure for use in certain defined circumstances.
We review these procedures in detail in the next section. In the late 1990s, some UK case studies
employed different algorithms to attempt to compute partial EVPI16,17 18, , but these algorithms actually
computed “expected opportunity loss remaining” given perfect information on a subset of parameters,
which is not the same as partial EVPI and can give substantially different results10,19. In 2002, a UK
event helped to produce work resulting in a series of papers providing guidance on EVI method10,19,20.
UK case studies since that time have used the two level Monte-Carlo sampling approach we examine in
detail here21,22. Coyle at al. have used a similar approach23, though sometimes using quadrature (taking
samples at particular percentiles of the distribution) rather than random Monte-Carlo sampling to speed
up the calculation of partial EVPI for a single parameter7. Development of the approach to calculate
expected value of sample information (EVSI) is also ongoing20,24,25 26, .
The EVPI literature is not confined to health economic policy analysis. A separate literature examines
information to inform decisions on individual patients27,28. Risk analysis is the other most common
application area. Readers with a wider interest are directed to a recent review of risk analysis
applications 105
106
107
108
109
110
111
112
113
114
115
116
117
118
119
120
121
122
123
124
125
126
127
128
129
130
29
, which showed, for example, Hammitt and Shlyakhter30 building on previous authors’
work,31,32,33,34 setting out similar mathematics to Felli and Hazen, and using elicitation techniques to
specify prior probability distributions when data are sparse.
The objective of this paper is to examine the computation of partial EVPI estimates via Monte-Carlo
sampling algorithms. In the next section, we define partial EVPI mathematically using expected value
notation. We then present a generally applicable nested 2 level Monte-Carlo sampling algorithm
followed by some variants which are valuable in certain circumstances. The impact of sampling error on
these estimates is covered including a bias caused by maximisation within nested loops. We lay out the
mathematical conditions when a ‘short-cut’ 1 level algorithm may be used. Three case studies are
presented to illustrate (i) the bias due to maximisation, (ii) the accuracy or otherwise of the shortcut
algorithm when correlated variables are present and (iii) the impact of increasingly non-linear
net-benefit functions. Finally, we present some empirical investigations of the required numbers of
Monte-Carlo samples and the implications for accuracy of estimates when relatively small numbers of samples
are used. We conclude with the implications of our work and some final remarks concerning
implementation.
MATHEMATICAL FORMULATION
Overall EVPI
We begin with some notation. Let,
θ be the vector of parameters in the model with joint probability distribution p(θ).
NB(d,θ) be the net benefit function for decision d for parameters values θ. 131
132
133
134
135
]
Overall EVPI is the value of finding out the true value of the currently uncertain θ. If we are not able to
learn the value of θ, and must instead make a decision now, then we would evaluate each strategy in turn
and choose the baseline adoption decision with the maximum expected net benefit, which we denote
ENB0. ENB0, the expected net benefit given no additional information, is given by
ENB0 = max
[
Eθ{
NB(d,θ)}
d (1)
136
137
138
139
140
141
Eθ denotes an expectation over the full joint distribution of θ, that is in integral notation:
∫
=
θ
θ
f
θ
f
θ
p
θ
d
θ
E
[
(
)]
(
)
(
)
Now consider the situation where we might conduct some experiment or gain clairvoyance to learn the
true values of the full vector of model parameters θ. Then, since we now know everything, we can
choose with certainty the decision that maximises net benefit i.e. max
{
NB(d,θtrue)}
d . This naturally
depends on θ 142
143
144
true, which is unknown before the experiment, but we can consider the expectation of this
net benefit by integrating over the uncertain θ.
Expected net benefit given perfect information = θ
(
max[
NB(d,θ)]
)
d
E (2)
145
146 The overall EVPI is the difference between these two (2)-(1),
EVPI =Eθ
(
max[
NB(d,θ)]
)
max[
Eθ{
NB(d,θ)}
]
d
d − (3)
147
148
149
150
151
152
153
It can be shown that this is always positive.
Partial EVPI
Now suppose that θ is divided into two subsets, θi and its complement θc, and we wish to know the
net benefit is ENB0 again, but now consider the situation where we have conducted some experiment to
learn the true values of the components of θ 154
155
156
157
i
= θitrue. Now θc is still uncertain, and that uncertainty is
described by its conditional distribution, conditional on the value of θitrue. So we would now make the
decision that maximises the expectation of net benefit over that distribution. This is therefore ENB(θitrue)
=
{
}
⎥⎦ ⎤ ⎢⎣
⎡ NB(d, )
max θ θ θ
true
d E c i . Again, this depends on θ
i
true, which is unknown before the experiment, but
we can consider the expectation of this net benefit by integrating over the uncertain θ 158
159 i.
Expected Net benefit given perfect info only on θi =
{
}
⎟⎠ ⎞ ⎜
⎝ ⎛
⎥⎦ ⎤ ⎢⎣
⎡ NB(d, )
max θ θ θ
θi E c i E
d (4).
160
161 Hence, the partial EVPI for θi is the difference between (4) and ENB0, i.e.
EVPI(θi) = Eθ max Eθ θ
{
NB(d,θ)}
max[
Eθ{
NB(d,θ)}
]
d d c i
i ⎟−
⎠ ⎞ ⎜
⎝ ⎛
⎥⎦ ⎤ ⎢⎣
⎡ (5)
162
163
164
165
166
167
168
169
170
171
172
173
174
175
176
This is necessarily positive and is also necessarily less than the overall EVPI.
Equation (5) clearly shows two expectations. The inner expectation evaluates the net benefit over the
remaining uncertain parameters θc conditional on θi. The outer evaluates the net benefit over the
parameters of interest θi. The conditioning on θi in the inner expectation is significant. In general, we
expect that learning the true value of θi could also provide some information about θc. Hence the correct
distribution to use for the inner expectation is the conditional distribution that represents the remaining
uncertainty in θc after learning θi. The exception is when θi and θc are independent, allowing the
unconditional (marginal) distribution of θc to be used in the inner expectation. The two nested
expectations, one with respect to the distribution of θi and the other with respect to the distribution of θc
given θi, may seem to involve simply taking an expectation over all the components of θ, but it is very
important that the two expectations are evaluated separately because of the need to compute a maximum
between them. It is this maximisation between the expectations that makes the computation of partial
177
178
179
180
181
182
183
184
185
186
187
188
189
190
191
192
193
194
195
COMPUTATION
Three techniques are commonly used in statistics to evaluate expectations. The first is when there is an
analytic solution to the integral using mathematics. For instance, if X has a normal distribution with
mean µ and variance 2 then we can analytically evaluate the expectation of functions f(X) = X or X2 or
of exp(X) i.e. E[X] = µ; E[X2] = µ2 + 2; E[exp(X)] = exp(µ + 2/2). This is the ideal but is all too often
not possible in practice. For instance, there is no analytical closed-form expression for E[(1 + X2)-1].
The second common technique is quadrature, also known as numerical integration. There are many
alternative methods of quadrature which involve evaluating the value of the function to be integrated at a
number of points and computing a weighted average of the results35. A very simple example would
evaluate the net benefit function at particular percentiles of the distribution (e.g. at the 1st, 3rd ,5th … 99th
percentile) and average the results. Quadrature is particularly effective for low-dimensional integrals,
and therefore for computing expectations with respect to the distribution of a single or a small number of
uncertain variables. When larger numbers of variables exist, the computational load becomes
impractical. The third technique is Monte-Carlo sampling. This is a very popular method, because it is
very simple to implement in many situations. To evaluate the expectation of a function f(X) of an
uncertain quantity X, we randomly sample a large number, say N, of values from the probability
distribution of X. Denoting these by X1,X2, … ;XN, we then estimate E{f(X)} by the sample mean
∑
== N
n
n
X f N X f E
1 ) ( 1 )} ( {
ˆ . This estimate is unbiased and its accuracy improves with increasing N.
Hence, given a large enough sample we can suppose that is an essentially exact computation
of E{f(X)}. It is the Monte-Carlo sampling approach which we now focus upon. 196
197
198
199
200
201
)} ( { ˆ f X E
Box 1 displays a detailed description of a Monte- Carlo sampling algorithm to evaluate the expectations
when estimating overall and partial EVPI. The process involves two nested simulation loops because
the first term in (5) involves two nested expectations. The outer loop undertakes K samples of θ 202 203 204 205 206 207 208 209 210 211 212 213 214 215 216 i
. In the
inner loop it is important that many (J) values of θc are sampled from their conditional distribution,
conditional on the value for θi that has been sampled in the outer loop. If θi and θc are independent we
can sample from the unconditional distribution of θc. Note that, although the EVPI calculation depends
on the societal value of health benefits λ, the whole algorithm does not need repeating for different λ
thresholds. If the mean cost and mean effectiveness are recorded separately for each strategy at the end
of each inner loop, then partial EVPI is quick to calculate for any λ. When evaluating overall EVPI, the
inner loop is redundant because there are no remaining uncertain parameters and the process is similar to
producing a cost-effectiveness plane36 or a cost-effectiveness acceptability curve37.
We can use summation notation to describe these Monte-Carlo estimates. We define the following:
i k
θ is the k’th random Monte-Carlo sample of the vector of parameters of interest θi,
θc
jk is the jth sample taken from the conditional distribution of θc given that θi = θki. n
θ is the vector of the n’th random Monte-Carlo samples of the full set of parameters θ, and 217
218 D is the number of decision policies.
Estimated overall EVPI =
[
(
)
]
(
⎥⎦ ⎤ ⎢ ⎣ ⎡ −
∑
∑
= = = = L l l toD d N n n toD d LN 1 1
1 1 ) NB(d, 1 max ) NB(d, max
1 θ θ
)
219 , (3s)
Estimated partial EVPI =
[
(
)
]
(
)
⎥⎦ ⎤ ⎢ ⎣ ⎡ − ⎟ ⎟ ⎠ ⎞ ⎜ ⎜ ⎝ ⎛ ⎟⎟ ⎠ ⎞ ⎜⎜ ⎝ ⎛
∑
∑
∑
= = = = = L l l toD d K k J j c jk i k toDd J NBd L
K 1 1 1 1 1
) NB(d, 1 max , , 1 max
1 θ θ θ
, (5s) 220
221
222
223
224
where, K is the number of different sampled values of parameters of interest θi; J, the number of
different sampled values for the other parameters θc conditional upon each given ; L, the number of
different sampled values of all the parameters together when calculating the expected net benefit of the
baseline adoption decision.
i k
225 226 227 228 229 230 231 232 233 234 235 236 237 238 239 240 241
Felli and Hazen4,15 gave a different Monte-Carlo procedure known as MC1 (see Appendix 1). When
compared with Box 1, there are two important differences. The first is that MC1 appears as a single
loop. Felli and Hazen assume that there is an algebraic expression for the expected payoff conditional
on knowing θi, and thus the inner expectation in the first term of (5) can be evaluated analytically
without using an inner Monte-Carlo sampling loop. This is not always possible and the inner loop in
Box 1 provides a generalised method for any net benefit function. Note also that, although the
procedure takes a concurrent random sample of the parameters of interest (θi) and the remaining
parameters (θc), the assumption of an algebraic expression for the expected payoff is still made, and the
sampling of θc is not used to evaluate the inner expectation. The second difference is that MC1 step 2ii
recommends estimating the improvement obtained given the information, immediately as each sample of
the parameters of interest is taken. Our 2 level algorithm can be amended to estimate the improvement
given by the revised decision d*( i) over the baseline adoption decision d* at the end of each outer loop
iteration (see Box 2).
The Box 2 algorithm is based on an alternative formula for partial EVPI, which combines the first and
second terms of (5) into a single expectation.
EVPI(θi) =
{
}
{
}
⎟⎠ ⎞ ⎜ ⎝ ⎛ − ⎥⎦ ⎤ ⎢⎣
⎡ NB(d, ) NB(d*, )
max θ θ θ θ θ θ
θi E c i E c i E
d . (6)
242
243 The summation notation provides a mathematical description of the Box 2 estimate:
EVPI(θi) estimate =
∑
∑
{
(
)
}
∑
{
(
)
= = = = ⎟ ⎟ ⎠ ⎞ ⎜ ⎜ ⎝ ⎛ − ⎥ ⎦ ⎤ ⎢ ⎣ ⎡ K k J j c jk i k J j c jk i k toD
d J NB d J NBd
K 1 1 1 1
, *, 1 , , 1 max
1 θ θ θ θ
}
244
245
246
247
248
, (6s)
With large numbers of samples the estimates provided by the general algorithm (Box 1) and that
computing improvement at each iteration (Box 2) will be equivalent. The difference between them
concerns when to estimate the improvement. In Box 1 we estimate the second term of (5s) just once for
adoption decision conditional on knowing the parameter of interest. If the same numbers of inner and
outer samples are taken, then there is little difference in computation time because the same total number
of samples and net benefit function evaluations are undertaken in both. The potential advantage of Box
2 is that the improvement is computed as exactly zero whenever the revised decision d*( 249 250 251 252 253 254 255 256 257 258 259 260 261 262 i
) = d*.
Because of this, with small numbers of samples the Box 2 algorithm might have some marginal
reduction in noise compared with Box 1. Furthermore, if the net benefit functions are positively
correlated, then the Box 2 algorithm is less susceptible to noise and will provide marginally more
accurate partial EVPI estimates for a given small number of samples. The number of Monte-Carlo
samples required is our next consideration.
Monte-Carlo Sampling Error
Monte-Carlo sampling estimates of any expectations including those in (5) are subject to potential error.
Consider a function f of parameters , for which the true mean E [f( )] is say µ. The estimator
[
∑
= ) = N j j N 1 ^ f( 1 θ µ]
263 264 265 266 267 (7)is an unbiased estimator of the true mean µ. The standard approach to ensuring that a Monte-Carlo expectation is estimated with sufficient accuracy is to increase the number of samples N, until the
standard error of the estimator, S.E.( ), is less than some defined acceptable level. The Monte-Carlo
sampling process provides us with an estimate of the variance of f( ), ^ µ
∑
⎜
⎝
⎛
⎟
⎠
⎞
= − ) − = N j j N 1 2 ^ 2 ^ f( 1 1 µ θσ (8)
268
269 and the estimated standard error of the Monte-Carlo estimator is defined by
N
^ ^ ^
S.E.
s µ⎟= σ
⎠ ⎞ ⎜ ⎝ ⎛
= (9)
The standard error in the Monte-Carlo estimate of an expectation S.E.( )reduces in proportion to the
square root of the number of random Monte-Carlo samples taken. ^ µ 271 272 273 274 275 276 277 278 279 280 281 282 283 284
Applying this approach to estimating the net benefits given current information is straightforward. For
each decision option we can consider f( )=NB(d, ) and denote the estimators of expected net benefit
E [NB(d, )] as , with associated variance estimators and standard errors . Running a
probabilistic sensitivity analysis (as in steps 1 to 3 of Box 1), we can establish the mean and variance
estimators and choose a sample size N to achieve a chosen acceptable level of standard error.
d
^
µ d
^
σ sd
^
However, estimating the potential Monte-Carlo error in partial EVPI computation is more complex
because we have a nested loop when we are repeatedly estimating expectations. In computing partial
EVPI, we have K outer loops, and for each sampled ik we estimate the conditional expected net benefit using J samples of c| ik in the inner loop. We can denote the Monte-Carlo estimator of the expected net
benefit for decision option dconditional on a particular value of the parameters of interest ik, as
(
[
∑
= = J j c jk i k dk NBdJ 1 ^
, ,
1 θ θ
µ
)
]
285
286
287
(10)
Denoting dk as the estimator of the variance in the net benefit conditional on the k’th sample ^
σ i
k, then
the standard error of this Carlo estimate is therefore estimated by:
(
)
(
)
∑
= − − = = ⎟ ⎠ ⎞ ⎜ ⎝ ⎛ = N j dk c jk i k dk dkdk NBd
J J J
s
1 ^ 2 ^ ^ ^ , , ) 1 ( 1 1S.E. µ σ θ θ µ (11)
288
289
290
291
292
We might expect that the standard error of the estimated conditional expected net benefit will be
lower than the overall standard error , because we have learned the value of sample
dk s ^ d s ^ i
k and hence
tolerance level could reduce. However, this will not necessarily always be the case and we give an
example in the case study section when knowing 293
294
295
296
297
298
299
300
301
302
303
304
305
306
307
308
309
310
311
312
i
k. is at a particular value can actually increase the variance in net benefit and the standard error. In general it is worth checking how stable these standard
errors are for different sampled values of the parameters of interest early in the process of partial EVPI
computation.
Having estimated the conditional expected net benefit for each of the D options, we take the maximum.
The partial EVPI estimate is therefore made up of K*D Monte-Carlo expectations, each estimated with
error, within which K maximisations take place. With the maximisation taking place between the inner
and the outer expectations there is no analytic form for describing the standard error in the partial
estimate. Oakley et al. have recently developed a first suggestion for an algorithmic process for this
estimation based on small numbers of runs38. This process of taking the maximum of Monte-Carlo
estimates has one further important effect.
Bias when taking maxima of Monte-Carlo expectations
Although the Monte-Carlo estimate of an expectation is unbiased, it turns out that the estimate of the
maximum of these expectations is biased, and biased upwards. To see this, consider 2 treatments with
net benefit functions NB1( ) and NB2( ) with true but unknown expectations µ1 and µ2 respectively . If
µ1 and µ2 are quite different from each other then any error in the Monte-Carlo estimators
[
]
∑
=)
= N
j
j
N 1
1 ^
NB1( 1
µ and
∑
[
=
)
= N
j
j
N 1
2 ^
NB2( 1
µ
]
313
314
315
316
317
is unlikely to affect which treatment is estimated to
have the highest expected net benefit. However, if µ1 and µ2 are close, then the Monte-Carlo sampling
error can cause us to mistakenly believe that the other treatment has the higher expectation, and this will
tend to cause us to over-estimate the maximum. Mathematically, we have that
E[max{ 1, )] ≥ max{E[ ], E[ ]} = max{E[NB1],E[NB2]}= max{µ ^
µ 2
^
µ 1
^
µ 2
^
Thus, the process of taking the maximum of the expectations (when they are estimated via a small
number of Monte-Carlo samples) creates a bias i.e. an expected error due to Monte-Carlo sampling. 318 319 320 321 322 323 324 325 326
The bias affects partial EVPI estimates because we evaluate maxima of expectations in both the first and
second terms of (5s). For the first term, the process of estimating the maximum of Monte-Carlo
expectations is undertaken for each different sample of the parameters of interest ( ). Each of the K
evaluations is biased upwards and therefore the first term in (5s) is biased upwards. The larger the
number of samples J in the inner loop, the more accurate and less biased the estimator given each
ik. The larger the number of samples K in the outer loop the more accurate the average of the
maximum expected net benefits i.e.
i k θ dk ^ µ
∑
= = K k dk d i K 1 ^ ^ } { max 1 )(θ µ
µ
. If J is small and K is very large then we
will get a very accurate estimate of the wrong i.e. biased partial EVPI. If is the Monte-Carlo
estimator of expected net benefit for decision option d given parameters i , and is the true
expected net benefit for decision option d given parameters i, then the size of the expected bias in the
first term of (5s) is given by the formula: 327 328 329 330 331 ) ( ^ i d µ ) ( i d µ
Expected Bias in first term of (5s) = ⎟⎟⎠
⎞ ⎜⎜ ⎝ ⎛ ⎥⎦ ⎤ ⎢⎣ ⎡ − ⎟ ⎠ ⎞ ⎜ ⎝ ⎛ ⎥⎦ ⎤ ⎢⎣
⎡ ( ) max ( )
max ^ E E i d d i d d i c
i θ θ µ µ
θ (13) 332 333 334 335 336 337 338 339
The magnitude of the bias is directly linked to the degree of separation between the true expected net
benefits. When the expected net benefits for competing treatments are close, and hence parameters have
an appreciable partial EVPI, then the bias is higher.
Because the second term in (5s) is also upwards biased, the overall bias in partial EVPI estimates can be
either upwards or downwards. The size and direction of the bias will depend on the net benefit
reduces the bias of the first term. Increasing the sample size L reduces the bias of the second term. If we
compute the baseline adoption decision’s net benefit with very large L, but compute the first term with
very small number of inner loops J, then such partial EVPI computations will be upward biased. It is
important also to note that the size K of the outer sample in the 2-level calculation does not affect bias.
For overall EVPI, the first term in (3s) is unbiased but the second (negative) term is biased upwards and
hence, the Monte-Carlo estimate of overall EVPI is biased downwards. As with Monte-Carlo error in
partial EVPI estimates, the size of the expected bias cannot generally be calculated analytically. The
investigation of methods to develop an algorithm for this bias estimation is continuing3 8.
340
341
342
343
344
345
346
347
348
349
350
351
352
353
354
355
356
357
358
359
360
361
There are two separate effects of using Monte-Carlo sampling to estimate the first term in (5) – the
random error if J and K are small and the bias if J is small. The bias will decrease with increasing inner
loop sample sizes, but for a chosen acceptable accuracy we typically need much larger sample sizes
when computing EVPI than when computing a single expectation. We investigate some of the stability
of partial EVPI estimates for different inner and outer sample numbers in the case studies. We also
examine a very simple 2 treatment decision problem, in which it is possible to compute the bias in
formula (13) analytically.
The ‘Short-Cut’ 1 Level Algorithm
In some simple models, it is possible to evaluate expectations of net benefit analytically, particularly if
parameters are independent. Suppose NB( )= * 1 – 2* 3, and the parameters 2 and 3 are
independent, so that the expected net benefit can be calculated analytically simply by running the model
with the parameters set equal to their mean values, Eθ
{
NB(d,θ)}
= λ*θ1 −θ2*θ3. Although simple, there are economic models in practice, particularly decision tree models, which are of this form. 362363
In such circumstances, the 2 level partial EVPI algorithm can be simplified to a 1 level process (Box 3).
This performs a one level Monte-Carlo sampling process, allowing parameters of interest to vary,
keeping remaining uncertain parameters constant at their prior means. It is much more efficient than the
two- level Monte-Carlo method, since we replace the many model runs by a single run in each of the
expectations that can be evaluated without Monte Carlo. Mathematically, we compute analytic solutions
for the inner expectations in the 1 365
366
367
368
369
370
371
372
373
st
term of (5) and all of the expectations in the 2nd term of (5). Note
that the expectations of maxima cannot be evaluated in this way. Thus, the expectation in the first term
of (3) and the outer expectation in the first term of (5) are still evaluated by Monte-Carlo in Box 3. Felli
and Hazen4 give a similar procedure, which they term a ‘shortcut’ (MC2) and is identical to MC1
described earlier but with those parameters not of interest set to their prior means i.e. θc=θc
. Note that
a misunderstanding of the Felli and Hazen ‘short cut’ method previously led some analysts to use a quite
inappropriate algorithm, which focussed on reduction in opportunity loss 374
375
376
377
378
379
380
381
16,17
. The level of inaccuracy in
estimating partial EVPI which resulted from this incorrect algorithm is discussed elsewhere1 9.
The 1 level algorithm is correct under the following conditions. Mathematically, the outer level
expectation over the parameter set of interest θi is as per equation (5), but the inner expectation is
replaced with net benefit calculated given the remaining uncertain parameters θc set at their prior mean.
1 level partial EVPI for θi = Eθ
{
max[
NB(d,θ ,θ )]
}
max{
EθNB(d,θ)}
d c
i d
i − (14)
382
383
384
Note that we now have just one expectation, and that the 1-level approach is equivalent to the 2 level
algorithm if (5) ≡ (14), i.e. if
}
{
NB(d, ){
max[
NB(d, , )]}
max i c
d
d c i i
i E E
Eθ θ θ θ ⎟≡ θ θ θ
⎠ ⎞ ⎜
⎝ ⎛
⎥⎦ ⎤ ⎢⎣
⎡ (15)
385
386 This is true if the left hand side inner bracket (expectation of net benefit, integrating over θc|θi) is equal
to the net benefit obtained when θc are fixed at their prior means (i.e. θc =θc ) in the right hand side. 387
Felli and Hazen comment that the 1 level procedure can apply successfully “when all parameters are
assumed probabilistically independent and the pay-off function is multi-linear i.e. linear in each
individual parameter”, in other words condition (15) will hold if: 389
390
391
392
393
394
395
396
397
398
399
400
401
402
403
404
405
406
407
408
409
410
411
412
413
A1. For each d the function NB(d, θ) can be expressed as a sum of products of components of θ
A2. All of the components of θ are mutually probabilistically independent of each other.
Condition (15) will also hold in a second circumstance. It is not necessary for all of the parameters to be independent of each other provided that the net benefit functions are linear. In fact, the 1 level
procedure can apply successfully for any chosen partition of the parameter vector θ into parameters of interest θi , and their complement θc if the conditions below are satisfied:
B1. For each d, the function NB(d, θ) = NB(d, θi, θc) is a linear function of the components of θc,
whose coefficients may depend on d and θi. If θc has m components, this linear structure takes
the form NB(d, θi, θc) = A1(d, θi)×θc(1) + A2(d, θi)×θc(2) + … + Am(d, θi) ×θc(m) + b(d, θi).
B2. The parameters θc are probabilistically independent of the parameters θi.
Thus, provided the net benefit function takes the form in sufficient condition (B1), then the one-level
algorithm will be correct in the cases where there are (a) no correlations at all, (b) correlations only
within θi, (c) correlations only within θc, or (d) correlations within θi and within θc but no correlations
between θi and θc. If the net benefits are linear functions of the parameters, it is only when the
correlations are between members of θc and θi that the 1 level algorithm will be incorrect.
The specifications of the sufficient conditions in (A1,A2) and (B1,B2) above are actually slightly
stronger than the necessary condition expressed mathematically in (15) but it is unlikely in practice that
the one-level algorithm would correctly compute partial EVPI in any economic model for which one or
other of the two circumstances described did not hold. In the next section we consider how accurate the
shortcut 1-level estimate might be as the parameters move from independent to being more highly
414
415
416
417
418
419
420
421
422
423
424
425
426
427
428
429
430
431
432
433
434
435
436
437
438
CASE STUDIES
Case Study Model 1: Analytically tractable model to illustrate effects of bias
Case study 1 has 2 treatments with a very simple pair of net benefit functions, NB1 = 20,000*θ1,
NB2 = 19,500*θ2, where θ1 and θ2 are statistically independent uncertain parameters each with a
normal distribution N(1,1). Analytically, we can evaluate max{E(NB1), E(NB2)} as
max{20000,19500} = 20,000. We compare the analytic results with repeatedly using very small
numbers of Monte-Carlo samples to evaluate the expectations of NB1 and NB2, and illustrate the scale
of the bias due to taking maxima of two Monte-Carlo estimated expectations. In this very simple
example with statistically independent, normally distributed net benefit functions, it is also possible to
derive analytically, both the partial EVPI’s and the expected bias due to taking maxima of Monte-Carlo
estimated expectations.
Case Study 1 Results - Bias
In all of the case study results, the partial EVPI estimates are presented not in absolute financial value
terms but rather relative to the overall EVPI for the decision problem. Thus, if we have an overall EVPI
of say £1400, which we ‘index’ to 100, then a partial EVPI of £350 would be reported as ‘indexed
partial EVPI’ = 25.
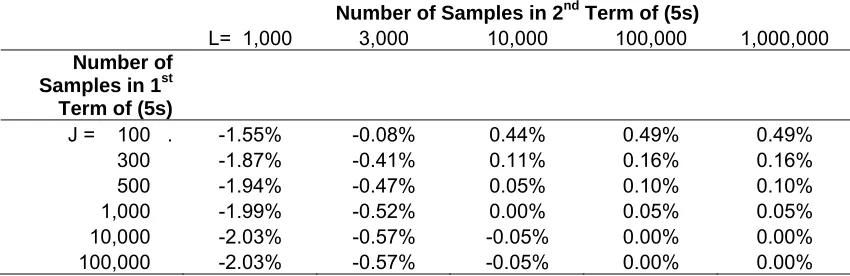
The effect of Monte-Carlo error induced bias in partial EVPI estimates depends upon the numbers of
inner samples J used in the first term (5s) and the number of samples L used to estimated the expected
statistically independent, normally distributed net benefit functions, it is actually possible to derive
analytically, both the partial EVPIs and the bias due taking maxima of Monte-Carlo estimated
expectations (See Appendix 2). Table 3 shows the resulting bias for a range of J and L sample sizes.
When L is small, the second term in (5s) is over-estimated due to the bias. In this case study the effect is
strong enough, for example at L=1000, that the partial EVPI estimate is actually downwards biased for
any value of J over 100. As L is increased the second term converges to its true value. When J is small
and L is large, we can expect the first term in (5s) to be over-estimated and the resulting partial EVPI
estimate to be upwards biased. The bias when J=100 is 0.49% of the true EVPI, and this decreases to
0.1% at J=500 and 0.05% at J=1,000. Note that the actual error in a Monte-Carlo estimated EVPI can be
considerably greater than this on any one run if small numbers of outer samples are used because over
and above this bias we have the usual Monte-Carlo sampling error also in play. 439
440
441
442
443
444
445
446
447
448
449
450
451
452
453
454
455
456
457
458
459
460
461
462
463
Case Study Model 2: Accuracy of 1 level estimate in a decision tree model with correlations
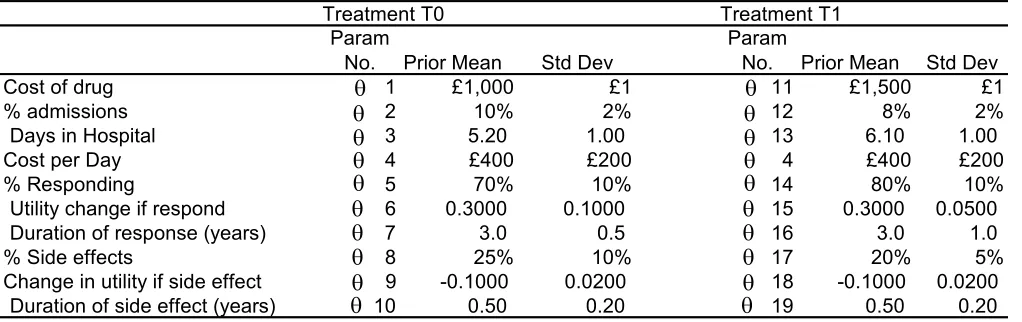
The second case study is a decision tree model comparing two drug treatments T0 and T1 (Table 1).
Costs and benefits for each strategy depend upon 19 uncertain parameters characterised with
multivariate normal distributions. We examine 5 different levels of correlation (0, 0.1, 0.2, 0.3, 0.6)
between 6 different parameters. Zero correlation of course implies independence between all of the
parameters. Correlations are anticipated between the parameters concerning the two drugs’ mean
response rates and the mean durations of response i.e. θ5, θ7, θ14 and θ16 all are correlated with each
other. Secondly, correlations are anticipated between the two drugs’ expected utility improvements, θ6
and θ15. To implement this model we randomly sample the multi-variate normal correlated values
using [R] statistical software39. We also implemented an extension of Cholesky decomposition in
EXCEL Visual Basic to create a new EXCEL function =MultiVariateNormalInv (see CHEBS
464
465
466
467
468
469
470
471
472
473
474
475
476
477
478
479
480
481
482
483
484
485
486
487
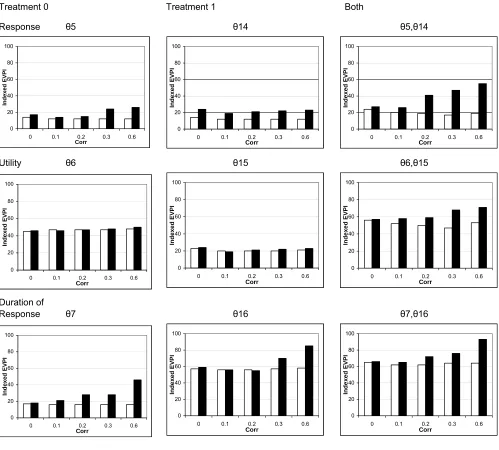
Case Study 2 Results – Effects of Correlation on Accuracy of 1 Level Algorithm
In the circumstance where correlation is zero, Figure 1 shows 1 level and 2 level partial EVPI estimates
for a range of parameter(s) of interest. The estimates are almost equivalent, with the 2 level estimates
just slightly higher than the 1 level estimates for each of the parameter(s) of interest examined. The
largest difference is just 3% of the overall EVPI. This reflects the mathematical results that (a) the 1
level and 2 level EVPI should be equivalent, because the cost-effectiveness model has net benefit
functions that are sum-products of statistically independent parameters, and (b) the 2 level estimates are
upwardly biased due to the maximisation of Monte-Carlo estimate in the inner loop. Note also that
partial EVPI for groups of parameters is lower than the sum of the EVPIs of individual parameters e.g.
utility parameters combined (θ6 and θ15) = 57%, compared with individual utility parameters =
46%+24% = 70%.
If correlations are present between the parameters, then the 1 level EVPI results sometimes substantially
under estimate the true EVPI. The 1 level and 2 level EVPI estimates are broadly the same when small
correlations are introduced between the important parameters. For example, with correlations of 0.1, the
2 level result for the utility parameters combined (θ6 and θ15) is 58%, 6 percentage points higher than
the 1 level estimate. However, if larger correlations exist, then the 1 level EVPI ‘short-cut’ estimates
can be very wrong. With correlations of 0.6, the 2 level result for the utility parameters combined (θ6
and θ15) is 18 percentage points higher than the 1 level estimate, whilst for the response rate parameters
combined (θ5 and θ14) shows the maximum disparity seen, at 36 percentage points. As correlation is
increased the disparity between 2 level and 1 level estimates increases substantially. The results
level EVPI estimates to be accurate and that the second mathematical condition, i.e. that parameters are
statistically independent, is just as important as the first. 488
489
490
491
492
493
494
495
496
497
498
499
500
501
502
503
504
505
506
507
508
509
510
511
512
The 1 level EVPI results should be the same no matter what level of correlation is involved, because the
1 level algorithm sets the remaining parameters θc at their prior mean values no matter what values are
sampled for the parameters of interest. The small differences shown in Fig 1 between different 1 level
estimates are due to random chance of different samples of θi. The 2 level algorithm correctly accounts
for correlation, by sampling the remaining parameters from their conditional probability distributions within the inner loop. It could be sensible to put the conditional mean for θc given θi into the 1 level
algorithm rather than the prior mean, but only in the very restricted circumstance when the elements of
θc
are conditionally independent given θi and the net benefit function is multi-linear. In case study 2,
such a method would not apply for any of the subgroups of parameters examined, because the elements
of the vector of remaining parameters θc are correlated with each other.
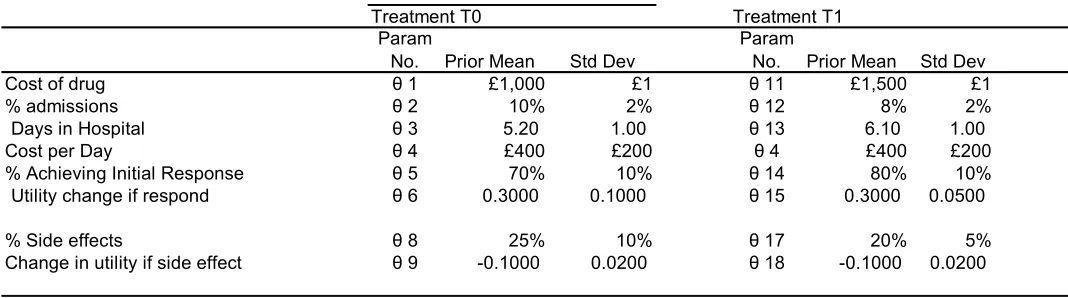
Case Study Model 3: Accuracy of 1 level estimate in an increasingly non-linear Markov model
Case study 3 extends the Case study 2 model incorporating a Markov model for the natural history of
continued response. Table 2 shows that the parameters for mean duration of response (θ7 and θ16) are
replaced with 2 Markov models of natural history of response to each drug with health states
“responding”, “not responding” and “died” (θ20 to θ31). The mean duration of response to each drug is
now a function of multiple powers of Markov transition matrices. To investigate the effects of
increasingly non-linear models, we have analysed time horizons of Ptotal = 3, 5, 10, 15 and 20 periods
in a Dirichlet distribution. To implement the models we sampled from the Dirichlet distribution in the
statistical software R41, and also extended the method of Briggs42 to create a new EXCEL Visual Basic
assuming that each is based on evidence from a small sample of just 10 transitions. We use a Bayesian
framework with a uniform prior of Dirchlet(1,1,1), and thus the posterior transition rates used in
sampling for those “responding” to the health states “responding”, “not responding” and “died” are
Dirichlet(7,4,2) and the equivalent transition rates for non-responders are Dirichlet (1,10,2).. We have
assumed statistical independence between the transition probabilities for those still responding and those
no longer responding and also between the transition probabilities for T1 and T0. 513
514
515
516
517
518
519
520
521
522
523
524
525
526
527
528
529
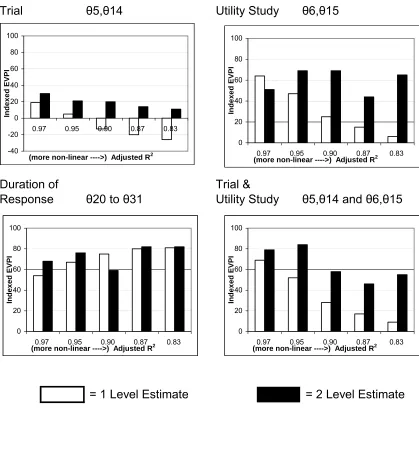
Case Study 3 Results – Effects of Non-Linearity on Accuracy of 1 Level Algorithm
We investigated the extent of non-linearity for each Markov model by expressing the net benefits as
functions of the individual parameters using simple linear regression and noting the resulting adjusted R2
for each. Increasing the number of periods in Markov model (e.g. 3, 5, 10, 15, 20) results in greater
non-linearity (i.e decreasing adjusted R2 = 0.97, 0.95, 0.90, 0.87, 0.83 respectively). Figure 2 shows the
effects on partial EVPI estimates. The 1 level estimates are substantially lower than the 2 level for the
trial ( 5, 14) and utility parameters ( 6, 15) and for their combination. Indeed, the 1 level partial
EVPI estimates are actually negative for the trial parameters ( 5, 14) for the 3 most non-linear case
studies. This is because the net benefit function is so non-linear that the first term in the 1 level EVPI
equation
{
max[
NB(d, | c c)]
}
d
i
Eθ θ θ =θ is actually lower than the second term, max
{
EθNB(d,θ)}
d . Thus,
when we set the parameters we are not interested in (θ 530
531
532
533
534
535
536
537
c
) to their prior means in term 1, the net benefits
obtained are lower than in term 2 when we allow all parameters to vary. Estimated partial EVPI for the
Markov transition probabilities for duration of disease ( i = 20 to 31) show a high degree of alignment
between the 1 level and 2 level methods. This is because, after conditioning on i the net benefit
functions are now linear in the remaining statistically independent parameters. It is very important to
note that even quite high adjusted R2 does not imply that 1 level and 2 level estimates will be equal or
at 0.1, the adjusted R2 is 0.973 but the 2 level EVPI estimate is 30 compared with a 1 level of 19. This
suggests that the 2 level EVPI algorithm may be necessary, even in non-linear Markov models very well
approximated by linear regression. 538
539
540
541
542
543
544
545
546
Results On Numbers of Inner and Outer Samples Required
We can use the Monte-Carlo sampling process to quantify the standard errors in expected net benefits
for a given number of samples quite easily. For example, 1000 samples in case study 2 with zero
correlation provided an estimator for the mean[NB(T0)] = £5,006, with an estimator for the sample
standard deviation [NB(T0)]
0 ^
T
µ
0 ^
T
σ = £2510, giving a standard error of ⎟
⎠ ⎞ ⎜
⎝ ⎛
1000
/
0 ^T
σ = £2.51. The
equivalent figures for T1 are mean estimator £5351, sample standard deviation estimator £2864 and
standard error £2.87. This shows clearly that the 95% confidence intervals for the expected net benefits
(£5006±5 and £5351±6) do not overlap and we can see that 1000 samples is enough to indicate that the
expected net benefit of T1 given current information is higher than that for T0. 547
548
549
550
551
552
553
554
555
556
557
As discussed earlier, it is likely that, conditioning on knowing the value of ik, will give estimators of the
variance in net benefits dk which will be lower than the prior variance because knowing ^
σ d
^
σ i
k means
we are generally less uncertain about net benefits. However, this is not necessarily always the case, and
it is possible that posterior variance can be greater. When estimating EVPI( 7) in case study 2 with zero
correlation, we found for example that our k=4th sampled value ( i4 = 4.4 years) in the outer loop
combined with J=1000 inner samples provided a higher standard error ⎟
⎠ ⎞ ⎜
⎝ ⎛
1000
/
0 ^T
σ = £3.25 as
compared with £2.51. 558
559
We further examined the number of Monte-Carlo samples required for accurate unbiased estimates of
partial EVPI using case study 2, assuming zero correlation, and focusing only on the partial EVPI for
parameters (θ5 and θ14). Figure 3illustrates howthe estimate converges as increasing numbers of inner
and outer samples are used. With very small numbers of inner and outer level samples the partial EVPI
estimate can be wrong by an order of magnitude. For example, with J=10 and K=10, we estimated the
indexed EVPI(θ5,θ14) at 44 compared to a converged estimate of 25.using J=10,000 and K= 1,000.
However, even with these quite small numbers of samples the fact that the current uncertainty in
variables θ5 and θ14 is important in the decision between treatments is revealed. As the numbers of
inner and outer samples used are extended cumulatively in Figure 3, the partial EVPI result begins to
converge. The order of magnitude of the EVPI(θ5,θ14) estimates is stable to within 2 indexed
percentage points once we have extended the sample beyond K=100 outer and J=500 inner samples.
The number of samples needed for full convergence is not symmetrical for J and K. For example, over
K=500 the EVPI(θ5,θ14) estimate converges to within 1 percentage point, but for the inner level, where
there is a 4 point difference between J=750 and J=1000 samples, and it requires samples of J=5,000 to
10,000 to converge to within 1 percentage point. The results suggest that fewer samples on the outer
level and larger numbers of samples on the inner level could be the most efficient approach. 561
562
563
564
565
566
567
568
569
570
571
572
573
574
575
576
577
578
579
580
581
582
583
584
585
Of course, the acceptable level of error when calculating partial EVPI depends upon their use. If
analysts want to clarify broad rankings of sensitivity or information value for model parameters then
knowing whether the indexed partial EVPI is 62, 70 or 78 is probably irrelevant and a standard deviation
of 4 may well be acceptable. If the exact value needs to be established within 1 indexed percentage
point then higher numbers of samples will be necessary.
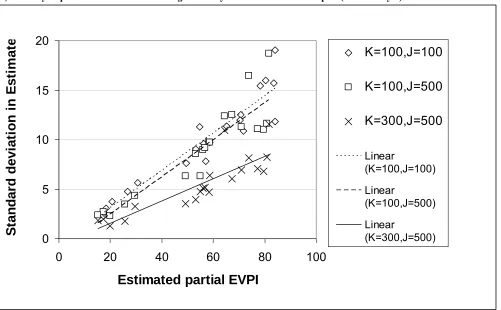
Having seen that K=100, J=500 produced relatively stable results for one parameter set in Case study 2,
samples in four different parameter groups using the 5 models in case study 3 i.e. 20 parameter sets in
total. By repeatedly estimating the partial EVPI, we were able to produce a distribution of results and
hence estimate the standard deviation in the partial EVPI estimates. Figure 4 shows the standard
deviations obtained for different numbers of inner and outer samples. The results show that when we
increase the number of outer samples from (K=100 to K=300, with J set at 500), the standard deviations
fall substantially, on average by a factor of 0.62. This is in line with a reduction in proportion to the
square root of the number of outer samples i.e. reduction in standard deviation ∝ (√100)/(√300)=0.58.
In contrast, the reductions in standard deviation due to increases in the number of inner samples are not
so marked. When we increase the number of inner samples from (J=100 to J=500, with K set at 100),
the standard deviations fall on average by a factor of just 0.89, which is a much smaller reduction than if
reductions were in proportion to the square root of the number of inner samples (√100/√500)= 0.45.
This demonstrates that improving the accuracy of partial EVPI estimates requires proportionately greater
effort on the inner level than the outer. It is also clear that the higher the true partial EVPI, the greater
the level of noise that might be expected. Figure 5 shows ‘confidence intervals’, (± 1.96 * s.d.) for the
partial EVPI estimates with relatively small numbers of samples. Parameters with low EVPI are
estimated with low EVPI even with as small a number of samples as K=100, J=100. Parameters with
much higher EVPI’s are estimated with relatively high EVPI but also have a larger confidence interval
around them. 586
587
588
589
590
591
592
593
594
595
596
597
598
599
600
601
602
603
604
605
606
607
608
609
610
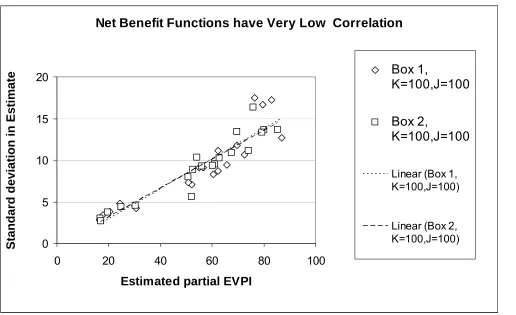
Finally, we used case study 3 to compare the algorithm that computes improvement after each iteration
(Box 2) with the general algorithm (Box 1), to assess whether estimates might exhibit less noise. We
undertook 30 runs using both Box 1 and Box 2 algorithms with K=100 outer and J=100 inner samples.
Figure 6a shows the results for the four different parameter sets and five different time period models.
The results show that standard deviations in the indexed partial EVPI results are almost equivalent for
average reduction in standard deviation in estimates is just 1%. This is because the net benefit functions
in case study 3 are almost uncorrelated (the only linked variable is 4). We then repeated this process,
but this time assumed that the natural history of response using the Markov model was the same for both
treatments. That is, parameter 26= 20, 27= 21, … 31= 25. Because these parameters are now
linked, the net benefit functions for the two treatments are now correlated.(correlation = 0.33, 0.44, 0.59,
0.66 and 0.71 for the models with 3, 5, 10, 15 and 20 total periods respectively). Figure 6b shows that
the standard deviations of the Box 2 algorithm EVPI estimates are now lower than those for Box 1, with
an average reduction in standard deviation in estimates of 9%. The reduction in standard deviation
observed was higher for the models with higher correlations in net benefit (estimated reduction in
standard deviation in partial EVPI estimates = 1%, 6%, 15%, 11%, and 13% respectively). The standard
deviation in partial EVPI estimates is reduced by approximately 2% for every 0.1 increase in the
correlation between the net-benefits. Using a square root of n, rule of thumb, this suggests that using the
Box 2 algorithm might require roughly 4% fewer samples for every 0.1 increase in correlation between
the net-benefits to achieve the same level of accuracy in partial EVPI as the Box 1 algorithm. 611
612
613
614
615
616
617
618
619
620
621
622
623
624
625
626
627
628
629
630
631
632
633
634
635
636
DISCUSSION
This paper describes the calculation of partial EVPI, with the evaluation of two expectations, an outer
expectation over the parameter set of interest and an inner expectation over the remaining parameters. A
generalised algorithm of nested outer and inner loops can be used to compute Monte-Carlo estimates of
the expectations and the maxima required for each outer loop. In specific circumstances, a ‘short-cut’ 1
level algorithm is equivalent to the 2 level algorithm and can be recommended for use in simple models
with linear and independent parameters. If net benefits are non-linear functions of parameters, or where
model parameters are correlated, the 1 level algorithm can be substantially inaccurate. The scale of
inaccuracy increases with non-linearity and correlation, but not always predictably so in scale. Case
case study where over-estimates are also possible1 9. In practice, the 1 level ‘short-cut’ algorithm could be
useful to screen for parameters which do not require further analysis. If parameters do not affect the
decision, our case studies show that their partial EVPI will be very close to zero using both the 2 level
and the 1 level algorithm. Thus, the 1 level algorithm might be used with a relatively small number of
iterations (e.g. 100) to screen for groups of parameters in very large models. The 2 level Monte-Carlo
algorithm is applicable in any model, provided there is computing resource to run a large enough
number of samples. 637
638
639
640
641
642
643
644
645
646
647
648
649
650
651
652
653
654
655
656
657
658
659
660
661
662
The number of inner and outer level simulations required depends upon the number of parameters, their
importance to the decision, and the model’s net benefit functions. The standard error of each
Monte-Carlo estimated expectation in the algorithm reduces in proportion to the square root of samples used but
when this accumulates over many inner and outer loops and the maxima taken, the standard error of
partial EVPI estimates is not generally able to be computed analytically. We recommend analysing the
convergence of estimates to ensure a threshold accuracy of partial EVPI estimates fit for the specific
purpose of the analysis. Our empirical approach, in a series of alternative models, suggests that the
number of inner and outer samples should not in general be equal. In these case studies, 500 inner loops
for each of the 100 outer loop iterations (i.e. 50,000 iterations in total) proved capable of estimating the
order of magnitude of partial EVPI reasonably well in our examples, although it is likely that higher
numbers may be needed in some situations. For very accurate calculation or in computationally
intensive models, one might use adaptive processes to test for convergence in the partial EVPI results,
within a pre-defined threshold.
A further consequence of Monte-Carlo sampling error is the existence of an over-estimating bias in
evaluating maximum expected net benefit across decision options when using small numbers of samples.
This can result in over or under-estimating the partial EVPI depending on the number of iterations used
Monte-Carlo bias outside the EVPI context43. Again, analytical computation of this bias is generally not
possible and analysis of the convergence of estimates as the number of inner samples increases is
recommended. In our case studies the bias appeared as no more than 1or 2 percentage points of the
overall EVPI when using 1000 inner samples. Further theoretical investigation of Monte-Carlo bias in
the context of partial EVPI would be useful and work is ongoing on a theoretical description of the
Monte-Carlo bias in partial EVPI calculation, and on using this theory to develop algorithms to quantify
the inner level sample size required for a particular threshold of accuracy 663
664
665
666
667
668
669
670
671
672
673
674
675
676
677
678
679
680
681
682
683
684
685
686
687
688
38,44 .
The differences between EVPI results using the general algorithm (Box 1) and that computing
improvement at each iteration (Box 2) were relatively small in case study 3 when net benefit functions
had low correlation. If EVPI( i) is small, then even small numbers of samples provide good estimates
using either algorithm. If EVPI( i) is large, then on a high proportion of occasions a different decision
option would be taken i.e. d*( ik)≠d*. Box 1 provides K estimates of E c[NB(d*( ik), )| ik] –
E [NB(d*, )]. In contrast, Box 2 provides K estimates of Ec [{NB(d*( ik), ) – NB(d*, )}| ik]. If the
net benefit functions are highly positively correlated, then the Box 2 algorithm is less susceptible to
noise and provides marginally more accurate partial EVPI estimates for a given number of samples. It is
important also to note that if the net benefit functions are negatively correlated then Box 2 estimates
would display higher variance than Box 1 estimates. From a computation time perspective, a further
refinement to the Box 2 algorithm could also be useful in the circumstance when there are very many
strategies and evaluating the net benefit functions takes appreciable computation time. This refinement
would use as small a number of inner loop iterations as possible to identify with reasonable certainty
which of the many strategies is d*( ik). If d*( ik) = d*, then there is zero improvement and we need no
further calculation. If d*( ik) ≠ d*, then we can use a larger number of inner loop samples just to
estimate the improvement in expected net benefit between the 2 relevant strategies d*( ik) and d*. Such
an adaptive approach can be useful when undertaking large numbers of Monte-Carlo samples becomes