Elsevier Editorial System(tm) for Journal of Environmental Management Manuscript Draft
Manuscript Number: JEMA-D-10-01001R1
Title: A project-based system for including farmers in the EU ETS Article Type: Research Paper
Keywords: EU; Greenhouse gases; Emission Trading System; Agriculture; Organic farming Corresponding Author: associate professor urs brandt,
Corresponding Author's Institution:
First Author: urs s brandt, associate professor
Order of Authors: urs s brandt, associate professor; gert t Svendsen
Archived
at
Dear editor
We now have made the revision according to the comments made by the referee. The details about the revision can be found in the attached file.
Best wishes
Ms. Ref. No.: JEMA-D-10-01001
Title: Should farmers participate in the EU ETS? Permit price, measurement and technology. Journal of Environmental Management
We have now revised the paper according to the proposals of the referees. We have considered all the points made by the referees. Below we provide an overview over our response to all the referees’ comments. (Marked with yellow). We also shortened the paper according to the advice of the editor. If the paper is still too long, we would be willing to remove the appendix.
We want to thank the two referees for valuable comments and suggestings that have improved the paper significantly.
Reviewer 1’s comments
1. The structure of the abstract is not sound enough. The author/authors should write a comprehensive abstract based on the result and discussion.
We have changed the abstract according to the guidelines of the referee
2. Introduction: There are some non-pertinent statements in the Introduction. It should be reduced as the scope of the paper. There are so many facts used in the Introduction without providing the evidences. Please improve it.
We have significantly changed the introduction and made it even more focused. The title has also changed according to the revised main question, i.e. how to develop a project-based system for including farmers in the EU ETS. We have eliminated several paragraphs, including the part that farmers are affected by climate change, and the part of the future plan for the EU TPS market, to strengthen focus in the introduction.
3. Methods: The way of realizing the objectives of the study is not clear. Please improve it.
In the end of the introduction, we have added a large paragraph on the method we employ, namely economic theory. It is now considered how we apply this theory on the research question at hand.
4. Results, and Discussion: Please restructure your results with relevant discussions which will let the readers clearly understand your findings.
We have included a large paragraph in the end of the introduction that describes our methodology, and the main analysis and findings.
5. The conclusion should be more precise.
We have changed the conclusion such that it focuses more on the results and implications of our analysis in relation to a project-based system for including farmers in the EU ETS
Reviewer #2:
(1) Anstract need to be rewritten
Has been done, according to the guidelines of the two referees
(2) In page 2, Last para: Authors argue that there is a research gap in the given topic, in fact it is not solely true. The problem here is that Authors mostly cited reports and websites, they have not gone through journal articles. I ask them to go through journal articles. For example, see Maraseni, T.N., (2009). Should agriculture be included in an emissions trading system? The evolving case study of the Australian Emissions Trading Scheme, International Journal of Environmental Studies. 66 (6). pp 689-704
We have added the following paragraph: The idea of including farmers in a national emission trading system has been launched in Australia (Maraseni 2009; ABARE 2010) but it has not yet been applied to the EU. This is our contribution to the literature.
(3) in page 2, last para: I ask authors to discuss latest debates of United States and many other countries on the inclusion of change in land-use practices under ETS, their references of Svendsen (2003) is too old. I ask them to go Australia ABARE sites for details.
We have added a larger discussion about the inclusion of land-use practices with new and newer references on page 2.
(4) Page 6, Line 171-172: "Therefore, crops which are presently grown throughout Europe experience more positive impacts in Northern Europe compared with Nouthern Europe (Commission, 1996" please correct it.
This has been corrected.
(5) The proposed methodology lacks ground due to two main reasons: (1) It has not considered verification and certification costs, which is the killing factor. Who verifies and who give certificate and how benefits are shared among the group members are discussed; (2) the credits earned from such farming activities may not be saleable to EU ETS, as its reliability is poor. It may be only saleable to voluntary markets.
Our approach will most likely reduce such costs significantly, since it should propose a list of acceptable methods and associated factors of reduction which would then be standard to all farmers. This may create a system without significant certification and verification costs. The list of acceptable methods could be proposed / delivered by the EU. Moreover, this makes the allowances earned in this sector a valid and reliable ‘currency’ in the EU ETS.
(6) Page 14, first para: I do not agree that the reduced tillage increase storage of CO2 in the soil and net changes in the emission of nitrous oxide. Again, the problem is that they have not gone through latest journal articles. I ask them to see following articles
1
A project-based system for including
farmers in the EU ETS
Urs Steiner Brandt
and Gert Tinggaard Svendsen
(Journal of Environmental Management, v17-9-10)
http://ees.elsevier.com/jema/
Abstract
Farmers in the EU do not trade greenhouse gases under the Kyoto agreement. This is an empirical puzzle because agriculture is a significant contributor of greenhouse gases (GHG) in the EU and may harvest private net gains from trade. Furthermore, the US has strongly advocated land-use practices as ‘the missing link’ in past climate negotiations. We argue that farmers have relatively low marginal reduction costs and that consequences in terms of the effect on permit price and technology are overall positive in the EU Emission Trading System (ETS). Thus, we propose a project-based system for including the farming practices in the EU ETS that reduces the uncertainty from measuring emission reduction in this sector. The system encourages GHG reduction either by introducing a new and less polluting practice or by reducing the polluting activity. When doing so, farmers will receive GHG permits corresponding to the amount of reduction which can be stored for later use or sold in the EU ETS.
Keywords: EU; Greenhouse gases; Emission Trading System; Agriculture; Organic farming.
An earlier version of this paper was presented at the European Public Choice Society Conference in Izmir,
Turkey April 2010. We thank Florens Flues and the other participants for helpful comments.
Department of Environmental and Business Economics, University of Southern Denmark, Denmark, usb[a]sam.sdu.dk
Department of Public Policy, Aarhus University, Denmark, gts[a]ps.au..dk
*Manuscript
2 1. Introduction
The EU has committed itself to an ambitious 20 % reduction of greenhouse gases (GHG) by 2020 compared to the 1990 emissions level. Moreover, the EU goal beyond 2012 is tostrengthen, expand and improve climate change initiatives (Commission, 2008). Therefore, there is a strong need to consider more carefully how to integrate as many sectors as possible in these efforts.
One important tool to improve climate change initiatives is emission trading. Thus, the EU launched the world’s first Emission Trading System (ETS) for GHG on January 1 2005 as part of the efforts to comply with the target levels in the Kyoto Protocol. The ETS is a unique innovation in modern environmental regulation, which has been transferred to the EU based on successful American experiences (Svendsen, 1998). In the EU ETS, the ownership of one permit or ‘allowance’ gives the right to emit 1 ton of CO2 equivalents. Once the allowance has been used to show compliance in a
given year, it will be withdrawn from the market. As long as the allowances have not been used to show compliance, they stay in circulation, and all allowances are identical regardless what year they have been issued. A market for trade with carbon permits is an ingenious way to reach the desired target level – the cap and trade ensures that there is an upper limit for total emission and that GHG reduction in terms of carbon equivalents takes place at the cheapest and most cost-effective facility (Markussen and Svendsen, 2005).
The EU ETS implies that trade of GHG allowances (as translated into CO2 equivalents) can take
place between firms in different countries. Almost half of total CO2 emission in the EU is covered
3
remained at a modest level. In other words, Denmark’s GHG permit allocation is lower than it would have been in a normal production year.
There are numerous ways to reduce GHG, e.g. via wind turbines, solar and wave power, bio fuels, energy efficiency measures and – a more recent method – a change in farming techniques. Farmers, however, do not trade GHG under the Kyoto agreement. Why not? We suggest that they should. The idea of including farmers in a national emission trading system has been launched in Australia (Maraseni 2009; ABARE 2010) but it has not yet been applied to the EU. This is our contribution to the literature.
This in spite of the fact that the United States heavily advocated the inclusion of change in land-use practices during the heated climate negotiations with the EU in The Hague, year 2000 (Svendsen, 2003). Furthermore, agricultural productivity may in itself be affected by climate change in the EU as relatively small changes in the climate can have significant impact on agricultural productivity. For instance, current differences in crop productivity between northern and southern Europe are likely to increase under climate change. Exceeding crop-specific high temperature thresholds are likely to result in a significantly higher risk of crop failure in parts of Southern Europe, while Northern Europe may be able to grow a wider range of crops than is currently possible because of a warmer and longer growing season. Therefore, crops which are presently grown throughout Europe experience more positive impacts in northern Europe compared with southern Europe (Commission, 1996). Recently, the Commission has stated, that: ‘In the long run, climatic pressures may lead to further marginalization of agriculture or even to the abandonment of agricultural land in parts of the EU’ (Commission, 2009).
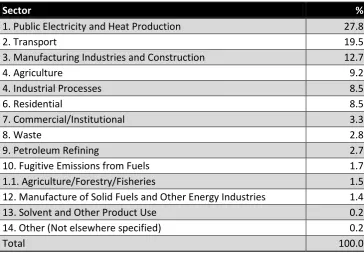
The main GHG emitters in the EU-27 are listed below in Table 1. As seen, agriculture is a significant source of GHG emissions, being responsible for 9.2 % of total GHG emissions in 2005 (Copa-Cogeca, 2008).
4
Table 1 shows that Public Electricity and Heating Production is the greatest GHG emitter in the EU with 27.8 % of total emissions. Transport is second (19.5 %) and manufacturing/construction third (12.7 %). Agriculture ranks number four (9.2 %).
At the moment, three of the great GHG emitters are not covered by the EU ETS, namely 2. Transport, 4. Agriculture and 6. Residential. Thus, while the debate on GHG has mainly focused on the energy, industrial, and residential sectors and households, only very limited attention has been paid to the significant potential to limit GHG emissions in the agricultural sector in spite of the fact that it emits about one tenth of total GHG emissions in the EU-27.
Much uncertainty is involved in the measurement of emission of methane (CH4) and nitrous oxide
(N2O) from farming. This has so far been seen as an obstacle to the inclusion of the farming sector
in the EU ETS (Monni et al., 2007). There are reasons to believe that some of the uncertainties can be effectively reduced with new knowledge (see Olesen, Fog and Svendsen 2010).
Our overall research question is therefore: Is it possible to develop a system that may facilitate the inclusion of farmers in the EU ETS? We will try to develop a framework which may circumvent much of the remaining measurement uncertainty and also makes sense in economic terms.
Our approach is to use economic theory to analyse the stated research question. First of all, we analyse the effect of including new sources into a TPS by considering the changes this implies for the demand and supply curves in such a market. The advantage of this analysis is that it enables us to draw conclusions about the likely development in the allowance price from including the farming industry into the EU-TPS. The effect on the price and its implication for the incentives to develop new technologies are relevant for the ability of the TPS market to deliver sufficiently to the overall climate targets of the EU. Our conclusion on this point is that the benefits of including the farming industry outweigh the small (if any) adverse effects of doing so (in terms of slightly smaller incentives to develop and implement new cleaner technologies).
5
farming techniques. Our analysis suggests that land-based practices can fruitfully be included into the EU-TPS. We propose a dynamic system where the various farming techniques and activities are frequently evaluated and if sufficiently certainty is provided, can be included as valid allowance generating activities.
We answer this research question in the following way: First, we focus on private gains for farmers from participating. If potential private net gains exist, attracting both conventional and organic farmers to the system will be politically more feasible (Section 2). Next, we focus on market consequences. What happens to the market in terms of changes in the permit price (Section 3) and technology (Section 4) when farmers are included? As mentioned, a severe problem regarding agriculture as a diffuse non-point source is the GHG measurement problem. Therefore, in the line of the previous sections, Section 5 proposes a project-based system that attempts to cope with the measurement problem in an economically efficient way. Finally, Section 6 gives the conclusion.
2. Private gains
2.1 Low-hanging fruits
Agriculture mainly emits methane and nitrous oxide besides carbon dioxide. The GHG emissions profile of agriculture, however, is fundamentally different to that of other sectors like industry, households and transport, as it is dominated by methane and nitrous oxide. Methane arises from enteric fermentation by ruminant animals and from manure, while the application of organic and inorganic fertilisers to soil can produce nitrous oxide. These are inherently variable, biological processes (Copa-Cogeca, 2008).
6
options. The mitigation potential of agriculture is estimated to reach 5.5-6 Gt. of CO2 equivalents
per year by 2030. This potential is enormous relative to the emissions of agriculture, which represent 13.5 % of global anthropogenic GHG. 89 % of this potential can be accounted for by soil carbon sequestration; 70 % of the total mitigation potential can be realized in developing countries. Furthermore, significant benefits associated with soil organic carbon storage make sustainable land management a solution to the interrelated issues of poverty, resilience and sustainable development (IFAP, 2009). ‘Over the next decades, adaptation will need to go beyond mere adjustments of current practice’ (Commission, 2009).
Organic farming, in particular, is interesting with respect to the empirical puzzle. First, organic farming is likely to stabilize productivity because it is more resilient to climate change because of efficient nutrient cycles and soil management, and a tendency to promote higher biodiversity. Because organic farming preserves soil fertility and maintains, or even increases, organic matter in soils, this farming technique is in a good position to maintain productivity in the event of drought, irregular rainfall events with floods, and rising temperatures. Soils under organic management retain significantly more rainwater thanks to the ‘sponge properties’ of organic matter (FIBL, 2006).
Second, research conducted over the last decade also indicates that organic farming production methods may have an even higher potential to reduce GHG emissions than conventional farming. To a large extent, this difference in emissions is caused by the non-use of chemical fertilizers. When emission reduction is measured per hectare, the reduction potential appears to be very impressing. Fliessbach (2007) estimates that GHG emissions from organic farming systems are 35-37 % less per hectare compared to organic farming, but when emission reduction is measured on the basis of production output, emissions reductions are significantly lower as a result of lower yields in organic farming. Nevertheless, organic farming still has significant potential for GHG emissions in the arable sector, while the potential is more modest in the livestock sector and negative for vegetables (Halberg, 2008). Furthermore, based upon Danish data, Dalgaard et al. (2002) and Dalgaard et al.
7
significantly lower compared with a situation in which livestock production is adjusted to lower crop yield.
2.2 Grandfathering
Auctioning without compensation is probably not a politically feasible solution. A more ‘soft’ start involving some kind of grandfathering is likely to be more politically successful (Svendsen 1998). Thus, in order to make the system politically attractive to farmers, plentiful permits could be allocated to them initially, as has been done in the first phase for other sources in the EU ETS (ibid.). Farmers would then have the possibility to obtain an economic net gain from participation in the EU ETS. What policy instrument would an economically rational grouping prefer? One rational choice could therefore be the grandfathered permit trading model, i.e. initial free distribution of historical emission rights (Tietenberg, 2000). This is the distribution rule applied in practice so far in the United States and in the Kyoto Protocol.
The distribution rule of grandfathering consists in a free transfer of the property rights to emission rights to polluters. The idea is exemplified in the following way: If a firm emitted 100 tons of carbon equivalents in 1990 and is ‘grandfathered’ its 1990 level, this firm will receive 100 carbon permits, each permit entitling it to emit one ton of carbon equivalents. If its carbon emission is cut by 5 % in 2000 by regulators, the firm’s permit holding will be devalued to 95 permits for 2000. In this respect, the use of grandfathering corresponds to the use of standards (Command-And-Control). Grandfathering maintains the status quo. The only difference between standards and permit trading is the shift in property rights from public authorities to the polluter. Under permit trading, permits would now be transferable, in contrast to standards in which permits are non-transferable. In this way, permit trading may be politically attractive to producers because it offers them historical emission rights freely when based on grandfathering (Daugbjerg and Svendsen, 2001).
8
losers are not represented in the political arena, lobbies representing existing firms will dominate the political decision-making process in their favour (ibid.).
3. New sources and permit price
This section provides a simple graphical presentation of the consequences of including additional sources in an existing ETS. In the ETS, supply and demand determine market price. Note, however, that this not an ordinary market since a source may be either a demander or a supplier, depending on the market price compared to the shadow price of the permit allocation for this source.
FIGURE 1 APP. HERE
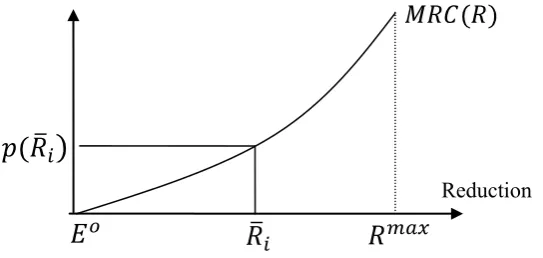
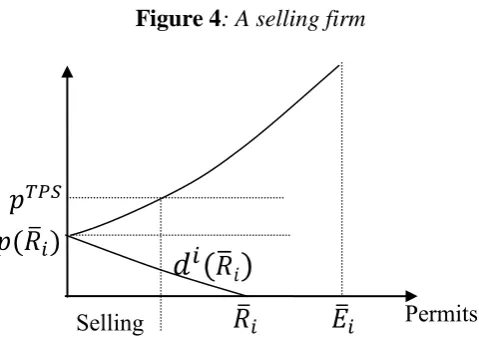
Let be the permit price in the ETS. From an ordinary marginal emissions reduction costs curve (MRC), it is possible to derive the individual firm’s demand and supply for permits, see Figure 1. Here, firm initially has an emission level of . It receives a number of permits given by . Therefore, without any trading, the reduction target for this firm is with a resulting shadow value of the firm’s reduction target, given by . If then the firm sells permits, and if the firm buys permits. From Figure 1, it is easy to derive the supply and demand function for this firm, which is done in Figure 2. Whether a firm is a buyer or a seller depends on the price in the market relative to the shadow price of the reduction constraint for the firm . The maximum demand for the firm is , which is the amount that the firm needs to reduce. By buying permits, it will not have to reduce any. In the same fashion, is the largest number of permits that the firm is able to sell. If it reduces all its emissions, it can sell all the received permits from the regulator.
FIGURE 2 APP. HERE.
Given that the firms (sources) have sufficiently dissimilar marginal reduction costs ( s), we reach an ordinary market supply and demand by adding up the sources’ individual and curves, as seen in Figure 3.
9
Note that the market equilibrium depends on the initial allocation (and number) of permits, since both the demand and the supply functions are functions of (as should be clear from Figure 2).
Given this set-up, we can now analyse the consequences of including new sources into such a market. The overall conclusion is that if the new sources on average have lower than the existing sources, the price in the market tends to fall. If, e.g., agriculture has lower (or lower shadow values), the permit price tends to fall. The implications are that some selling sources turn into buying sources. And there will be a transfer of reduction from the original sources to the new sources. If, on the other hand, agriculture has higher , the price in the market tends to increase. The implications are then the opposite as before. Some buying sources turn into selling sources. And there will be a transfer of reduction from the new sources to the original sources.
4. Incentives to develop new technology
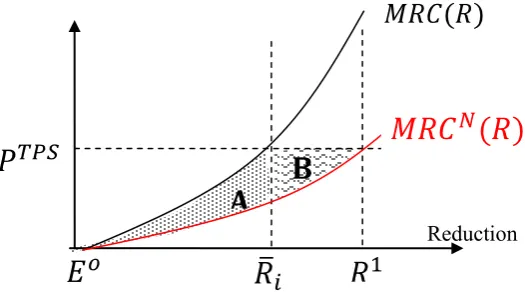
In this section, we will look at the likely consequences of including the farming industry in the ETS in terms of developing new and cleaner technology. What is the property of dynamic cost-efficiency? An additional reason for using an ETS compared to a non-tradable (standard) solution is exactly that the ETS provides larger incentives to develop/apply new, cleaner technologies. To show this, we compare the incentives created by these two instruments. Suppose that a firm is subject to a non-tradable situation with a reduction target of . In the ETS, the firm receives permits such that it also reduces without trade. To compare a situation with ETS and a non-tradable case, let us initially set the permit price such that the firm does not trade at all. This implies that the reductions in the two situations are the same when we look at the original technology. To illustrate the difference, see Figure 4. Here, represents the original technology, while
represents a new and cheaper way of reducing emissions.
10
benefit compared to the non-tradable situations. In this case, there are two effects. First, the firm obtains additional cost savings, and second, it emits less. However, as long as the overall number of permits is fixed, the total emission will not be reduced.
FIGURE 4 APP. HERE.
Given that developing new technology is costly, it is more likely that the new, cleaner technology is more profitable to develop under the ETS system than under the non-tradable situation. There is a caveat to this result. In the above example, the price in the market is assumed constant. But if more firms start adopting this new technology, the price in the market will fall, and the gain from the new technology will be smaller. In the limiting case, in which all firms would experience the same cost reduction from applying the new technology, the situation would be status quo and no additional gain would be experienced compared to the standard.
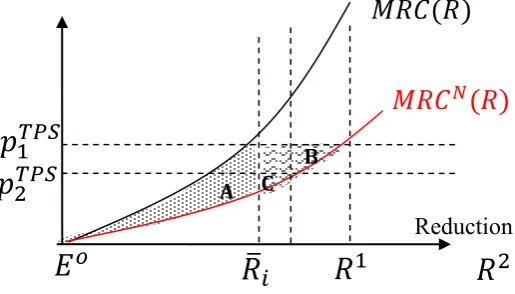
Finally, the inclusion of new sources that reduce the price in the market will lead to a decrease of the incentives to develop new technologies. This final point is illustrated in Figure 5. If the price in the market falls from to , the cost savings in the ETS compared to the non-tradable situation shrinks from area B to area C.
FIGURE 5 APP. HERE.
In conclusion, lower prices in the ETS provide fewer incentives for development and/or application of newer technologies. On the other hand, lower total compliance costs will make implementation of more stringent reduction targets less politically controversial.
5. A system for including farmers into an ETS
11
the total emission from farming). The uncertainty attached to these measurements is considerable. The paper of Monni el al. (2007) in detail describes the great uncertainties related to measuring emissions of nitrous oxide and methane. According to their findings, great uncertainty is attached to N2O emissions from agricultural soil in particular. Annual emission from EU 15 is app. 190 Tg
CO2e, but with great uncertainty, with a lower and upper bound of 95 % confidence interval of -100
to +1000% as a percentage relative to the mean. According to Monni et al. (2007), the reason for this is that emission is caused by complex biological processes with various changing parameters.
On the other hand, new research indicates that recent techniques for measurement, based on already existing data from both conventional and organic farmers, can reduce uncertainties to some extent (see Olesen, Fog and Svendsen, 2010). Moreover, emission inventories are calculated for any sector, including the farming industry. The IPCC (2006) provides a series of reduction factors that are used for this purpose. Applying such an approach to an individual farmer is the centre of the scheme we propose here.
In the following, we propose a system that can be used for including the farmers in the ETS, even though uncertainty and measurement problems exist.
As a starting point, farming contains a number of processes, like keeping animals, or producing crops. Each of these processes can be subdivided into activities like keeping different animals. Finally, for each such activities, different practices exists, like which fodder to give cows. The basic idea of this system is that instead of measuring the emission directly, we calculate the (average) change in emission from the baseline practice to the new practice. The whole idea of the system is that the authorities can in advance specify what practices should be accepted as valid reduction measures. (This could be motivated, e.g., by not including practices that are judged to generate uncertain results). We only want to illustrate our idea, therefore we here only focus on changes in practices and not on changes in activities of processes, but this be included without much complication.
12
initial allocation of allowances to the farmers. Call the allocation rule . As an example, a uniform allocation rule allocates to each farmer at time a number of allowances:
With , and where is the calculated emission in (the end of) the previous period. If , there is no requirement of net reduction from the sector in this period, while for any , there is a requirement of net reduction from the sector in this period.
Now let us look at how to calculate emissions from activities and practices. Let a number of activities be . For each such activity, there is a number of practices, indexed by . Each activity practice pair has an emission factor per unit of measurement (E.g., one cow fed with fat food has an emission factor of , while the emission factor of conventional food is ). If a farmer switches from conventional to fat food, the emission reduction per cow per year is given by: . More generally, we call the units (in the above example a cow) and activity practice pair the emission factor for .
Let us now turn attention to reduction projects of farmer . Such a reduction project in our setting is a change in practice from a baseline (BL) practice to a new practice. We write the change in emission per unit activity as . We introduce time as to indicate that permits are valid in a limited period of time. To simplify, assume that farmer total has reduction projects. 1Reduction from project for farmer is given by , i.e.to make this
model work, we need to specify all the ’s, as this also defines the ’s and all the ’s. (Here, we ignore the case that could also be changed. But this is easily included into the model.). Finally,
total reduction is given by .
How many allowances must farmer hand in at the end of the period? This is calculated in the following way, where means the number of allowances that farmer i must hand in to
the authorities in the end of period t:
13
So for each type of activity, , we calculate the reduction due to changed practices (there could be more than one practice for an activity, or for subsets of this activity). Subsequently, we sum over the reductions for each activity to obtain the total reduction. This sum is then subtracted from the emission level of this source at the beginning of the period. This provides the number of allowances that the farmer must hand in. If this sum is lower than the initial allocation, the source can sell from the remaining allowances. If the sum is larger than the initial allocation (which is possible either when and no reduction undertaken, of , but emission increased), this source must buy additional allowances. In appendix 1, we present an example of how this system works.
TABLE 2 APP. HERE.
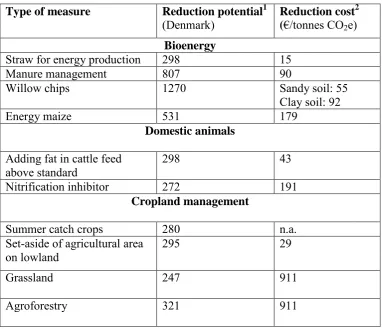
Fødevareministeriet (2008) states that the total potential for reducing emissions from farming in Denmark is estimated to be 3851 MtCO2e per year, which amounts to 31 % of the emission from agriculture and 6 % of the total emission (year 2007). However, incentives to choose new practices depend on (net) costs of these new practices and the . In Table 2, we show the most promising practices in terms of size and costs.
There are, however, even more effective ways of reducing emission, which is not included in Table 2. According to Fødevareministeriet (2008) and Chatskikh et al. (2008), reduced tillage (and direct drilling), which are methods that reduce labour and energy efforts, show a great CO2e reduction
potential. The reductions can mainly be attributed to reduced energy uses, increased storage of CO2
in the soil and net changes in the emission of nitrous oxide. The studies conclude that the total emissions reduction is app. 370 kg CO2/ha, with approximately 90 % stemming from storage. Other
14
This again underlines the strength of our proposed system. As long as too much uncertainty is attached to a method, it should remain outside the system, but it sends signals where to improve research. E.g., VandenByggart et al (2003) analyze data for Canada finding correlation between decreased background levels of soil organic (SOC) and the potential to store SOC when non tillage is adapted. From this they conclude that management like plowing green manures into the soil, and applying N and organic fertilizers were the practices that tended to show the most consistent increases in SOC storage. According to Dalal et al. plowing methods also affect the release of nitrous oxide: For manure management, the most effective practice is the early application and immediate incorporation of manure into soil to reduce direct N2O emissions as well as secondary
emissions from deposition of ammonia volatilised from manure. See also Iqbal (1992) for an earlier study of the connection between denitrification and the soil contend of carbon and Dorland and Beauchamp (1991) for a study of the linkage of denitrification and ammonification. These examples show how new research gives increased knowledge that can be applied for new methods to enter the system.
Our approach will most likely reduce such costs significantly, since it proposes a list of acceptable methods and associated factors of reduction which are then standard to all farmers. This means a system without significant certification and verification costs. The list of acceptable methods could e.g. be proposed and delivered by the EU. Moreover, the system would make the allowances earned in this sector a valid and reliable ‘currency’ in the EU ETS.
At present (May 2010), the price of allowances is app. 13€/tonnes CO2. If comparing this price with
the reduction costs in Table 2, such a price will, all else equal, only imply minor reductions from the farming sector. There are, however, two reasons to expect that this will underestimate the future potential for reductions in the farming sector, if it is included in the EU ETS.
15
Finally, we proposed a scheme that may be considered a project-based approach, in which the regulator in advance makes a list over farming practices that can be used as valid reduction measures in the EU ETS system. This brings about the question of which practices to include? One reasonable criterion would be to only include practices in which the uncertainty is minor. The uncertainty here could relate to measurement uncertainty or simply lack of understanding of the underlying biological/chemical processes. As new research reduces such types of uncertainty or new methods that contain less uncertainty are developed, the list of acceptable practices can be expanded.
6. Conclusion
The EU is facing a great challenge under the Kyoto Protocol in its ambitious efforts to improve climate change initiatives and achieve a 20 % GHG reduction from 1990 to 2020. Crucially, the participation of farmers could be one extra important tool for the European Union to succeed. Overall, the inclusion of both conventional and organic farmers in the EU ETS offers a solution which meets the interests of farmers and the EU as a whole. If the challenge of incorporating agriculture in the EU ETS can be addressed adequately, indeed, the role of farmers in climate policy may become a hot issue during future climate meetings. As a result, the US would probably be much more likely to rejoin the Kyoto agreement (or rather the post-Kyoto agreement), thereby clearing the road for the participation of China and India as well. Until now, the US has strongly advocated land-use practices as ‘the missing link’ in past climate negotiations. Finally, farmers may avoid future production losses as climate change evidently may have a significant economic impact on agriculture in near future.
16
option of grandfathering rather than auctioning would be the first step to attract farmers to the system.
We argued that there were also other strong economic reasons to develop a system for farmers’ participation in the EU ETS. First, the market consequences in terms of the effect on permit price and technology were overall positive. Regarding the effects on the price of allowances, it was not likely that the inclusion of the farming industry would have a significant influence on the price because of its relatively small size compared to the overall emissions. It would, however, imply a larger volume of trading, resulting in cost-efficiency gains. Incentives to development and/or implementation of new and cleaner technologies were, however, also largely affected by expectations of future allowance prices. An increase in the allowance price was to be expected in the future, which would generally spur incentives for technology improvements. This was also likely for the farming industry, making more and more new practices attractive. Note that being in an ETS provides continuous incentives to make new practices cheaper or more effective, even if the price of allowances remains constant (compared to ordinary CAC regulation). Therefore, the estimates of present costs of reductions for the various measures (like the one presented in table 2) typically exaggerated costs for applying these measures in the future.
17 References
ABARE (2010): http://www.abare.gov.au/corporate/about_us/about.html (Access date: Sept 4, 2010).
Baker, M.J. Ochsner, T.E,. Venterea, R.T. and Griffis, T.J., 2007. Tillage and soil carbon
sequestration-What do we really know? Agriculture, Ecosystems and Environment, 118, 1-5. Chatskikh, D., Olesen, J.E, Hansen, E.M., Elsgaard, L. and Petersen, B.M., 2008. Effects of
Reduced Tillage on Net Greenhouse Gas Fluxes from Loamy Sand Soil under Winter Crops in Denmark. Agriculture, Ecosystems & Environment, 128, 117-126.
Commission, 1996. Agriculture and Climate Change,
http://ec.europa.eu/agriculture/envir/report/en/clima_en/report_en.htm. Accessed October 6, 2008.
Commission, 2008. Questions and Answers on the Commission's proposal to revise the EU Emissions Trading System, MEMO/08/35, Brussels, 23 January 2008.
http://europa.eu/rapid/pressReleasesAction.do?reference=MEMO/08/35. Accessed October 6,
2008.
Commission 2009, Adapting to climate change: the European Union must prepare for the impacts to come. White paper, COM (2009) 147.
Copa-Cogeca, 2008. Agriculture to combat climate change. Declaration for the United Nations Climate Change Conference in Poznan, 1st-12th December 2008.
Dalal, R.C., Wang, W., Robertson, P and Parton, W.J., 2003. Nitrous oxide emission from Australian agriculture lands and mitigation options: a review. Australian Journal of Soil Research, 2004, 41, 165-195.
Dalgaard, T., Halberg, N., Fenger, J., 2002. Can organic farming help to reduce national energy consumption and emissions of greenhouse gasses in Denmark? in: van Lerland, E.C. and Lansink, A.O. (Eds.), Economics of sustainable energy in agriculture. Economy and Environment 24. Kluwer Academic Publishers, Dordrecht, pp. 191-204.
Dalgaard, T., Kelm, M., Wachendorf, M., Taube, F., Dalgaard, R., 2003. Energy balance comparison of organic and conventional farming, in: Organic Agriculture: Sustainability, Markets and Policies. Organisation for Economic Co-operation and Development (OECD) and CABI publishing, Wallingford, pp. 127-138.
18
Dorland, S. and Beauchamp, E.G. 1991. De-nitrification and ammonification at low soil temperatures. Canadian Journal of Soil Science, 71, 293-303.
EEA, 2009. Annual European Community greenhouse gas inventory 1990–2007 and inventory report 2009. Submission to the UNFCCC Secretariat. European Environmental Agency, Technical report No 04/2009, version 27 May 2009.
EEA, 2010. EEA Viewer. http://dataservice.eea.europa.eu/pivotapp/pivot.aspx?pivotid=475. Accessed May 10, 2010.
FIBL, 2006. Organic Farming and Climate Change. International Trade Centre UNCTAD/WTO Research Institute of Organic Agriculture (FiBL). Geneva.
Fliessbach, 2007. Organic Farming and Climate Change, Working Paper, Climate Change and Organic workshop at BioFach 2007, <http://www.fibl.org/aktuell/pm/2007/documents/0215-climate-change-proceedings-en.pdf>. Accessed October 6 2008.
Fødevareministeriet, 2008. Landbrug og Klima: Analyse af landbrugets virkemidler til reduktion af drivhusgasser og de økonomiske konsekvenser. December 2008, Copenhagen, Denmark. Analysen er udarbejdet for Fødevareministeriet af Det Jordbrugsvidenskabelige Fakultet, Århus Universitet og Fødevareøkonomisk Institut, Københavns Universitet.
Halberg, N., 2008. Energiforbrug og drivhusgasudledning i økologisk jordbrug, in: Alrøe, H.F. and Halberg, N. (Eds.), Udvikling, vækst og integritet i den danske økologisektor. Foulum: ICROFS, pp. 463-474.
IFAP, 2009. IFAP Declaration: Farmers’ solutions to climate change – proposals for including agriculture in a post-Kyoto agreement,
http://www.ifap.org/en/documents/ClimateChangeFarmersSolutionsDeclaration.pdf. Accessed February 9, 2009.
IPCC, 2006. Guidelines for national greenhouse gas inventories, http://www.ipcc-nggip.iges.or.jp/public/2006gl/index.html. Accessed April 29, 2010.
Iqbal, M., 1992. Potential rates of de-nitrification in 2 field soils in southern England, Journal of Agricultural Science, 118, 223-227.
Markussen, P. and Svendsen, G.T., 2005. Industry Lobbying and the Political Economy of GHG Trade in the European Union. Energy Policy, 33, 245-55.
19
Monni, S., Syri, S., Pipatti, R. and Savolainen, I., 2007. Extension of EU Emissions Trading Scheme to Other Sectors and Gases: Consequences for Uncertainty of Total Tradable Amount. Water Air Soil Pollution. Focus, 7, 529-538.
Oates, W.E. and Schwab, R.M., 1988. Economic Competition Among Jurisdictions: Efficiency Enhancing or Distortion Inducting? Journal of Public Economics, 35, 333-54.
Olesen, J.E., Fog, E. and Svendsen, G.T., 2010. Benefits for European Farmers from Carbon Trading. Paper presented at the Round Table on Organic Agriculture and Climate Change (RTOACC), May 10-11, 2010. Research Institute of Organic Agriculture FiBL, Frick, Switzerland.
Svendsen, G.T., 1998. Public Choice and Environmental Regulation: Tradable Permit Systems in United States and CO2 Taxation in Europe. Edward Elgar, Cheltenham, UK.
Svendsen, G.T., 2003. Political Economy of the European Union: Institutions, Policy and Economic Growth. Edward Elgar, Cheltenham, UK.
Tietenberg, T.H., 2000. Environmental and Natural Resource Economics, fifth ed. Longman Higher Education, Addison Wesley
VandenBygaart, A.J., Gregorich, E.G., Angers, D.A., 2003. Influence of agricultural management on soil organic carbon: a compendium and assessment of Canadian studies. Canadian Journal of Soil Science, 83, 363-380.
20 APPENDIX 1
Example (numbers are totally random).
Consider a situation with three farmers and two activities. Activity 1 has two possible practices, while activity 2 has three practices. So far, all the farmers use the practice that has the highest emission factors.
Assume that F1 uses instead of and that F2 uses instead of . F3 does not change practice over
the period.
Calculate the initial emissions:
sum = 106
Calculation of net reductions:
sum = 20
Let
The first period allocation of allowances is given by:
sum = 95.4
(Baseline) 0.7
0.5
(Baseline) 0.4
0.5
0.2
Farmer U1 U2
F1 30 40
F2 20 50
21 The number of allowances to hand in and the surplus allowances:
Surplus allowances for farmer 1:
Surplus allowances for farmer 2:
Surplus allowances for farmer 3:
22 Figure 1: Marginal reduction curve
23 Figure 2: Individual firms’ demand and supply for permits
24 Figure 3: The market for permits
25 Figure 4: A selling firm
26 Figure 5: Cost reduction of new technology: Comparing ETS with a standard.
27 Figure 6: Lowering of price in the ETS reduces incentives to develop new technology
28
Table 1: GHGemissions from different sectors in the EU-27, 2007.
Sector %
1. Public Electricity and Heat Production 27.8
2. Transport 19.5
3. Manufacturing Industries and Construction 12.7
4. Agriculture 9.2
4. Industrial Processes 8.5
6. Residential 8.5
7. Commercial/Institutional 3.3
8. Waste 2.8
9. Petroleum Refining 2.7
10. Fugitive Emissions from Fuels 1.7
1.1. Agriculture/Forestry/Fisheries 1.5
12. Manufacture of Solid Fuels and Other Energy Industries 1.4
13. Solvent and Other Product Use 0.2
14. Other (Not elsewhere specified) 0.2
Total 100.0
29
Table 2: Potential reduction measures, their size and costs
Type of measure Reduction potential1
(Denmark) Reduction cost
2
(€/tonnes CO2e)
Bioenergy
Straw for energy production 298 15
Manure management 807 90
Willow chips 1270 Sandy soil: 55
Clay soil: 92
Energy maize 531 179
Domestic animals
Adding fat in cattle feed
above standard 298 43
Nitrification inhibitor 272 191
Cropland management
Summer catch crops 280 n.a.
Set-aside of agricultural area
on lowland 295 29
Grassland 247 911
Agroforestry 321 911
Source: Danish ministry of Food, Farming and Fisheries (Fødevareministeriet, 2008 [Our translation]). Note: Numbers do not include any reduction of domestic animals since it is assumed that a reduction in one country region will increase the number of animals elsewhere.
1 Estimated potential for reduction of GHG from farming until 2020 (1000 ton CO2e per year). 2 Numbers are costs to the farmers of implementing the measure. C-storage in soil is not