The Flow Experience: A Rasch Analysis of Jackson’s Flow State Scale
Gershon Tenenbaum and Gerard J. Fogarty University of Southern Queensland
Susan A. Jackson
Queensland University of Technology
Abstract
Stages of the Flow Experience: a Rasch Analysis of Jackson’s Flow State Scale
Flow is an optimal psychological state that has been described at length by Csikszentmihalyi (1990, 1993) and adapted to sport and physical activity settings by sport and exercise psychology researchers interested in identifying and understanding the nature of the experience in these environments. Understanding the experience of the state of flow in sport settings has been the focus of Jackson’s (e.g., Jackson, 1995, 1996; Jackson & Marsh, 1996) research in this area. The present study is an attempt to further describe and explain the process of flow as it may occur in physical activity settings.
Flow has been described by Csikszentmihalyi (1990, 1993) as comprising the following nine dimensions:
1. Challenge-Skill balance. In flow, there is a feeling of balance between the demands of the situation and personal skills.
2. Action-Awareness Merging. Involvement is so deep that there is a feeling of automaticity about one’s actions.
3. Clear Goals. A feeling of certainty about what one is going to do.
4. Unambiguous Feedback. Immediate and clear feedback is received, confirming feelings that everything is going according to plan.
5. Concentration on Task at Hand. A feeling of being really focussed.
6. Sense of Control. The distinguishing charactersitic of this feeling in the flow state is that it happens without conscious effort.
7. Loss of Self-Consciousness. Concern for the self disappears as the person becomes one with the activity.
8. Transformation of Time. Time can be seen as passing more quickly, more slowly, or there may be a complete lack of awareness of the passing of time.
9. Autotelic Experience. Csikszentmihalyi (1990) describes this as the end result of being in flow, a feeling of doing something for its own sake, with no
expectation of future reward or benefit.
Jackson (1996) found support for these dimensions in a qualitative analysis of elite athletes’ flow descriptions. Jackson & Marsh (1996) further argued that a
multimethod approach is need to understand flow, incorporating both qualitative and quantitative research. In particular, they urged the importance of establishing the validity of the various constructs said to underlie the flow experience and relating these dimensions to other psychological states. Toward this end, they developed the 36-item Flow State Scale (FSS) and used conventional item analysis techniques along with confirmatory factor analysis to establish the construct validity of the scale. The main findings of importance to the present study were that nine first-order factors were needed to give a good account of the variance and that a single second-order factor could also be extracted to help explain the correlations among the nine factors. Thus, the FSS provided support for Csikszentmihalyi’s nine correlated factors model of the flow experience as well as a second order “global flow” factor that can be measured by these nine first-order factors.
factors. They noted that there is support for this point of view elsewhere (Jackson, 1996). The second feature was unexpected and had to do with the moderate loading of the Autotelic Experience factor on the second-order factor. This factor is described by Csikszentmihalyi (1990) as central to the flow experience. Jackson and Marsh (1996) concluded that its low loading on the second-order factor ruled out the possibility of its having a central role and that perhaps enjoyment of sport is taken for granted among athletes. Other possible explanations were also forwarded. Interestingly, in a qualitative study of the flow dimensions in athletes (Jackson, 1996), autotelic experience was found to be the most salient, or frequently experienced, dimension.
The question of the relative importance of factors in the global flow
continuum is a difficult one to answer. However, there are techniques that are ideally suited to such questions. One such technique is known as Rasch analysis. Originally developed on measures of cognitive ability (Rasch, 1960), Rasch analysis allows test administrators to gauge the extent to which each item in a test taps an underlying latent trait. It does so by modelling response patterns for the full set of items and testing the goodness of fit for the item pattern as a whole and also the fit for each individual item. The details of this mathematical process will not be described here, instead the reader is referred to introductions by some of the main adherents of Rasch analysis (e.g., Wright & Stone, 1979). What follows is a very basic introduction to some of the main features of Rasch analysis, intended mainly to show that it can be applied to the FSS.
When the Rasch Model is applied to response data, the hierarchy of the items (i.e., item calibrations on the linear continuum) is tested for consistency across the sample of the respondents. Furthermore, the ordering of item values can be compared for defined groups of persons, abilities, attitudes and other characteristics, to
ultimately define the variable. The assumption underlying the model is that the items share a single dimension or trait and that the people are relatively homogeneous with respect to the measured variable. The presence of a strong second order factor in the FSS suggests that it is amenable to Rasch analysis.
When applied to attitudinal data, the model assumes that response Xvi, which
occurs when person v takes item i, is governed by the person’s attitude βv and the
item’s value δi and nothing else. Since both βv and δi share a common linear
continuum, Xvi is a function of their difference (βv - δi). Xvi is probabilistic in nature
and so is the mathematical procedure associated with the model. The logistic function provides a model which makes both linearity of scale and generality of measure possible. In addition, “fit statistics” indicate how much a person deviates in
responding to single items with respect to his/her expected ratings (based on his/her total raw score), and how each single item is rated in relation to its
Method Participants
The first sample was that used by Jackson and Marsh (1996) and is described fully in that paper. Briefly, the sample consisted of 394 athletes from a variety (41) of sports. The sample comprised 264 males and 130 females. A range of participation levels were represented, from recreational to national representatives. The second sample consisted of 398 participants in the 1994 World Masters Games competition. The athletes, 243 males and 155 females, were primarily from Australia (84%), although 13 nationalities were represented in the sample. Four sports made up the sample: track and field, triathlon, swimming, and cycling. The mean age of the participants was 46 (SD = 10.9), and as a group they had participated in their sport from 14-19 years.
Instrument
The Flow State Scale (FSS: Jackson & Marsh, 1996) measures flow in sport and physical activity settings. It consists of 36 items divided into 9 subscales, each representing a different dimension. The 36 items can also contribute to a broad second-order general flow factor. The items were derived from research on the flow state within and outside sport settings and qualitative analysis of interviews with elite athletes. Participants are asked to recall one specific experience that occurred whilst participating in sport or physical activity that constituted an optimal experience. They then respond to the flow items using a 5-point Likert response format where 1
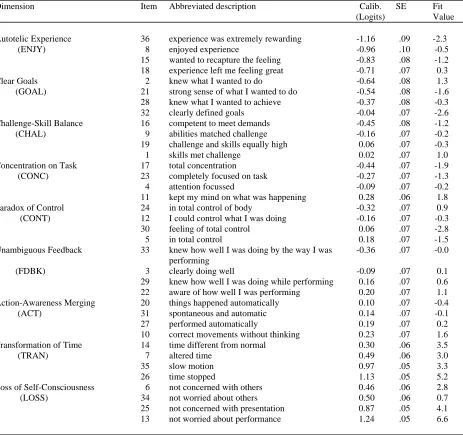
Table 1: The FSS dimensions, abbreviated description, items' calibration and fit
Dimension Item Abbreviated description Calib.
(Logits)
SE Fit Value
Autotelic Experience 36 experience was extremely rewarding -1.16 .09 -2.3
(ENJY) 8 enjoyed experience -0.96 .10 -0.5
15 wanted to recapture the feeling -0.83 .08 -1.2
18 experience left me feeling great -0.71 .07 0.3
Clear Goals 2 knew what I wanted to do -0.64 .08 1.3
(GOAL) 21 strong sense of what I wanted to do -0.54 .08 -1.6
28 knew what I wanted to achieve -0.37 .08 -0.3
32 clearly defined goals -0.04 .07 -2.6
Challenge-Skill Balance 16 competent to meet demands -0.45 .08 -1.2
(CHAL) 9 abilities matched challenge -0.16 .07 -0.2
19 challenge and skills equally high 0.06 .07 -0.3
1 skills met challenge 0.02 .07 1.0
Concentration on Task 17 total concentration -0.44 .07 -1.9
(CONC) 23 completely focused on task -0.27 .07 -1.3
4 attention focussed -0.09 .07 -0.2
11 kept my mind on what was happening 0.28 .06 1.8
Paradox of Control 24 in total control of body -0.32 .07 0.9
(CONT) 12 I could control what I was doing -0.16 .07 -0.3
30 feeling of total control 0.06 .07 -2.8
5 in total control 0.18 .07 -1.5
Unambiguous Feedback 33 knew how well I was doing by the way I was performing
-0.36 .07 -0.0
(FDBK) 3 clearly doing well -0.09 .07 0.1
29 knew how well I was doing while performing 0.16 .07 0.6 22 aware of how well I was performing 0.20 .07 1.1
Action-Awareness Merging 20 things happened automatically 0.10 .07 -0.4
(ACT) 31 spontaneous and automatic 0.14 .07 -0.1
27 performed automatically 0.19 .07 0.2
10 correct movements without thinking 0.23 .07 1.6
Transformation of Time 14 time different from normal 0.30 .06 3.5
(TRAN) 7 altered time 0.49 .06 3.0
35 slow motion 0.97 .05 3.3
26 time stopped 1.13 .05 5.2
Loss of Self-Consciousness 6 not concerned with others 0.46 .06 2.8
(LOSS) 34 not worried about others 0.50 .06 0.7
25 not concerned with presentation 0.87 .05 4.1
13 not worried about performance 1.24 .05 6.6
Statistical Analysis
The Ascore package (Andrich, Sheridan, & Lyne, 1991) was used to estimate the locations and fit statistics for the 36 FSS items. The package can handle various response types, including rating scales, and returns item locations with standard errors, threshold estimates for item categories, and fit statistics for each item and person in accordance with Wright and Masters (1982).
Results
The Rasch analysis was applied to the “flow” scale ratings of 328 participants from the first sample who had “valid” responses. Sixty-two participants were
excluded from the final analysis because there was evidence they had responded in an invalid manner. These invalid responses were mostly cases where extreme responses were given to all items (all 1’s or 5’s), producing fit values > |3.00|. The item values (calibrations) in logits, standard errors (SE), fit statistics and item-trait interaction test of fit values are presented in table 1.
extremely rewarding”). This feeling may thus be experienced very early in the flow experience. The “hardest” item to rate highly (i.e., the majority of respondents rated it low), with a location estimate of 1.24 logits, was item 13 (“I was not worried about my performance during the event”). This feeling comes only when the individual is very much into the flow experience. The rest of the items (i.e., experiences) are spread along the linear “flow” continuum between these two items.
Table 1 also shows that five of the items were possible “misfits”. They were items 13 (“I was not worried about my performance during the event”), item 14 (“The way time passed seemed to be different from normal”), item 25 (“I was not concerned with how I was presenting myself”), item 26 (“I felt like time stopped while I was performing”), and item 35 (“At times, it almost seemed like things were happening in slow motion”). From a psychometric point of view, misfit items might be deleted from the final version of the measurement scale. However, re-examination of the five misfit items revealed that four of the five items (25, 35, 26, and 13) were located at the upper end of the linear continuum, i.e., they were experienced only when persons were very much in the “flow” experience. Also the fifth item (14) was located in this region. It is believed that such experiences may elicit similar responses from persons in different flow modes and, as a consequence, result in exaggerated standardised residuals and large misfit values. Also, deleting these items would result in
shortening the length of the linear scale from 2.4 logits (-1.16 to +1.24) to 1.66 logits (-1.16 to +0.50). This would drastically limit the discrimination of persons who differ substantially in the “flow” experience. Finally, the internal consistency (Cronbach’s Alpha) of the scale was 0.93 and the biserial correlations of these items with the total “flow” score were in the satisfactory range of 0.30 - 0.40. It was decided, therefore, that there were no firm grounds for altering the scale in any way.
Rasch analysis was also applied separately to data generated by elite athletes (international and national calibre) and adult recreational athletes (non-elite) athletes. The item values (calibrations) with respect to gender and athletic calibre were
The analyses and plots clearly indicate that item values (calibrations) remain relatively consistent across both gender and athletic calibre dimensions. However, there were some items that did not fall near to the line in both figures and these are worth mentioning. Items that fall appreciably above the identity line drawn through Figures 1 and 2 are "easier" for female and non-elite athletes respectively. Items that fall appreciably below the line are "easier" for male and elite athletes respectively. From Figure 1 it can be seen that items 36, 8, 18, 20, 31, and 28 all fell above the identity line. The first three of these items help to define the Autotelic Experience factor, the next two help to define Action-Awareness Merging factor. It appears that females find it easier to experience these states than do males. On the bottom side of the identity line, the two most distant items were 1 and 9, both measuring the
Challenge-Skill balance factor, suggesting that males find it easier to endorse
competency type items than do females. Independent t-tests revealed significant (p < .01) differences between males and females on these items. From Figure 2, which compares elite and non-elite athletes, a small number of items were some distance from the identity line (they are marked in the figure) but they did not as a group represent any of the FSS factors. Significant differences between the two samples of athletes were evidenced only for item 29 (Knowing how well one does while
performing) and item 10 (Correct movement without thinking).
By and large, most items from Figures 1 and 2 fell close to the identity line indicating that males and females, as well as high level athletes and recreational athletes, perceive the experiences (i.e., items) of flow in the same linear fashion. Jackson and Marsh’s (1996) finding of differential factor loadings among the flow dimensions can be interpreted by the Rasch model as indicating that some dimensions of flow are more extensively experienced than others, or even that they occur at different points in time in the flow experience. Grouping the items under their factors shows what sections of the linear continuum are covered by each of the factors. To facilitate the interpretation of such a display, items are shown with their respective factors in Table 1.
If factors do represent underlying aspects of flow, then it is reasonable to expect that some of these aspects will be experienced before others. That is, athletes will find it easier to rate them more highly. If that is the case, there will be systematic differences in the location values for items marking different factors; the items for some factors will be at the “easy” end of the continuum, the items for others will be at the opposite end, others will be in the middle. Andrich (1975) gives an illustration of this technique. Figure 3 shows the location of the items grouped under their factorial headings for the full sample.
When grouped in this way, it is apparent that there is an ordering among the factors of the FSS (see Figure 3). The ninth factor, “autotelic experience”, would be felt by most people, an indication that it is very easy to capture the feelings of
Comparison of Sample 1 with Sample 2
A somewhat abbreviated analysis can be presented here, the main purpose being to cross-validate the findings reported with the first sample. If the items are good representatives of the flow experience, their values are expected to remain stable because, as pointed out above, one of the properties of the Rasch analysis is that item estimates are sample free, unless the item has properties of instability. Demonstration of this property in the second data set would argue strongly for the stability of the FSS and provide further confirmation of the sections of the global flow continuum covered by this scale.
The item locations were compared across the two samples used in this study. This comparison is important because the athletes were quite different in many important respects. The first sample (N = 394) comprised mostly younger (mean age = 22) athletes who were either at the peak of their sporting prowess or rapidly approaching this point. The second group (N = 398) comprised mostly older athletes (mean age = 46), not necessarily elite, who were more likely to be engaged in sport simply because they liked to do so. If the item locations are the same across these diverse samples, it provides a substantial basis for interpretation of aspects of the flow experience.
When the data for the second sample were analysed, it was apparent that most of the estimates shared similar sign though somewhat different magnitudes. These similarlities and differences are shown in the scatterplot depicted in Figure 4. Dealing first with the points that did not fall on the identity line, it can be seen that items 8, 15, 18, and 36 were all endorsed more readily (p < .01) by the younger than the older athletes. These items all define the Autotelic Experience factor, suggesting that when they are in the flow experience younger athletes are enjoying their sport more. Of the six items that fell appreciably below the identity line, four of them (2, 21, 28, and 32) define the Clear Goals factor, suggesting that older athletes were more conscious of knowing what they wanted to do and what they wanted to achieve. The differences between the groups on these items were also significant (p < .01), though
young/competitive and older/masters athletes rated the Clear Goals factor higher than most of the other flow dimensions.
Additional flow items where group differences were found included items 13, 25, 20, 31, 14, 22, and 11. Items 13 and 25 were from the Loss of Self-Consciousness dimension, where younger athletes endorsed these items less readily than the older group (1.24 and 0.87 versus 0.78 and 0.40 respectively). The opposite was found for items 20 and 31, which represent the Action-Awareness Merging dimension (0.10 and 0.14 versus 0.50 and 0.52 respectively). Additional significant differences in item locations were obtained for item 14 ("time different from normal": young, 0.30; older, 0.79), item 22 ("aware of how well I was performing": young, 0.20; older, -0.32), and item 11 ("kept my mind on what was happening": young, 0.28; older, -0.09). The magnitudes of these differences, however, were not striking.
These differences aside, it is apparent from this plot that, although not exactly the same, the location estimates did not vary greatly across these two quite different samples. The flow symptoms that pertain to the Autotelic Experience (ENJY) were "easy" to experience, as were the symptoms of Clear Goals (GOAL) and
(CHAL), Concentration on Task at Hand (CONC), and Paradox of Control (CONT). Then Action Awareness (ACT) and Loss of Self-Consciousness (LOSS) were
experienced. Only athletes with high flow experience felt the Transformation of Time (TRAN) symptoms. This result indicates that item locations remain relatively
consistent across different samples of athletes as well as within each sample for elite versus non-elite athletes and males versus females. This is an indication of the generalizability of this scale across sample-types.
Assessment of Location of Experiences Along the Linear Continuum
In the final stages of these analyses, raw scores from the FSS were converted to logits, the units of measurement that result from a Rasch analysis. The conversion is useful because it provides an estimate of where an athlete is located on the flow continuum that has been converted into a true linear scale with a fixed zero point and equal units of measurement. If the “flow” scale items are scored from 0 - 4, rather than from 1 - 5 as they currently are with the FSS, the total score when all items are summed ranges between 0 - 144. However, since raw scores derived in this manner are not placed on a linear continuum, a score that is transformed into logit units by Rasch analysis is preferable if one wants to know the stage of flow achieved. The transformation from raw scores to logits is presented in Appendix A. Note that none of the subjects in the sample scored under a raw score of 63 which is equivalent to -0.35 logits. The mean logit score of the sample was 1.45 logits, which indicates that most of the items were scored highly by most of the persons.
Discussion
The Rasch analyses conducted here highlighted some aspects of the flow experience that have not been clear in previous writings. There is no doubt that Autotelic Experience, as defined by the items of the FSS, is one of the easiest
dimensions of flow to be experienced whereas Transformation of Time, Loss of Self-Consciousness and, to a lesser extent, Action Awareness Merging, are among the least experienced. In other words, autotelic symptoms such as “enjoyed experience”,
“wanted to capture the feeling”, “feeling great”, and “extremely rewarding” tended to be experienced extensively by athletes. Jackson (1996) drew a similar conclusion after her qualitative analysis of athletes’ experiences.
The Rasch analysis of the FSS subscales demonstrated a high degree of
consistency across and within samples, testifying to the reliability and generalisability of the FSS scale. The Rasch analysis has shown that the various dimensions of flow share a relatively consistent pattern that can be viewed in quantitative stages. It allows us to describe the flow state in terms of the unique experiences that are located on the linear continuum.
It would be interesting to use the FSS with athletes who have completed outstanding performances. Some elite athletes were included in the present samples but they were not necessarily questioned after top level performances. Higher levels of endorsement would be expected for the difficult dimensions, such as
In summary, the present study adds another link to the understanding of the flow experience in athletes. As argued by Jackson and Marsh (1996), any attempts to investigate flow are “fraught with difficulties and limitations” (p.32). By examining the placement of the Flow Scale (Jackson & Marsh, 1996) items along a linear continuum, it has been possible to show that the state of flow involves a variety of experiential characteristics that may be experienced to different degrees by different athletes. By contrasting the location of items for elite and non-elite, male and female, and older and younger athletes it has also been possible to show that although overall these groups tend to rate the items similarly, Rasch analysis highlights differences that may well be worth exploring further. For example, we would hypothesise on the bases of the analyses conducted here that when in the flow state, females are more
conscious of enjoyment, males of competency. Older athletes are more conscious of a sense of achieving goals and younger athletes of a sense of pleasure and enjoyment. Intuitively these findings make sense but they require further elaboration and testing.
References
Andrich, D. (1975). The Rasch multiplicative binomial model: Applications to
attitude data. Research Report Number 1. Measurement and Statistics Laboratory, Dept. of Education, University of Westen Australia.
Andrich, D. (1982). An extension of the Rasch model for ratings providing both location and dispersion parameters. Psychometrika, 47, 105-113.
Andrich, D, Sheridan, B., & Lyne, A. (1991). ASCORE: Manual of procedures. Faculty of Education, University of Western Australia.
Csiksentmihalyi, M. (1990). Flow: The psychology of optimal experience. New York: Harper & Row.
Csiksentmihalyi, M. (1993). The evolving self. New York: Harper & Row.
Jackson, S.A. (1996). Towards a conceptual understanding of the flow state in elite athletes. Research Quarterly for Exercise and Sport, 67 (1), 76-90.
Jackson, S.A., & Marsh, H.W. (1995). Development and validation of a scale to measure optimal experience: The Flow State Scale. Journal of Sport and Exercise Psychology, 18, 17-35.
Rasch, G. (1960). Probabilistic models for some intelligence and attainment tests. Copenhagen: Danish Institute for Education Research.
Wright, B.D., & Masters, G.N. (1982). Rating scale analysis. Chicago: Uni of Chicago Press.
Appendix A
Transformation of Total Raw Scores to Logit Scores for Items in FSS
Raw Score No. of Respondents Logit Score SE
63 1 -.32 .17
64 2 -.29 .17
65 1 -.26 .17
66 0 -.23 .17
67 0 -.20 .17
68 1 -.17 .17
69 0 -.14 .17
70 0 -.11 .17
71 1 -.08 .17
72 2 -.05 .17
73 2 -.02 .17
74 1 .01 .17
75 .04 .17
76 2 .07 .17 77 2 .10 .18 78 4 .13 .18 79 1 .16 .18 80 0 .19 .18 81 1 .22 .18 82 2 .25 .18 83 1 .29 .18 84 2 .32 .18 85 6 .35 .18 86 2 .38 .18 87 9 .42 .18 88 5 .45 .18 89 6 .48 .18 90 3 .52 .18 91 7 .55 .19 92 3 .58 .19 93 4 .62 .19 94 5 .66 .19 95 5 .69 .19 96 0 .73 .19 97 4 .76 .19 98 4 .80 .19 99 11 .84 .19 100 5 .88 .20 101 6 .92 .20 102 10 .95 .20 103 5 .99 .20
Appendix A (Con’t.)
Transformation of Total Raw Scores to Logit Scores for Items in FSS
Raw Score No. of Respondents Logit Score SE
104 12 1.04 .20 105 11 1.08 .20 106 15 1.12 .21 107 4 1.16 .21 108 14 1.20 .21 109 10 1.25 .21 110 9 1.29 .21 111 6 1.34 .21 112 7 1.39 .22 113 6 1.43 .22 114 7 1.48 .22 115 10 1.53 .23 116 5 1.58 .23 117 13 1.64 .23 118 4 1.69 .23 119 9 1.75 .24 120 5 1.80 .24 121 6 1.86 .25 122 7 1.92 .25 123 8 1.99 .25 124 8 2.05 .26 125 10 2.12 .26 126 9 2.19 .27 127 3 2.27 .28 128 3 2.34 .28 129 7 2.43 .29
130 7 2.51 .30.
131 4 2.60 .31 132 1 2.70 .32 133 6 2.81 .33 134 5 2.92 .34 135 5 3.04 .36 136 4 3.18 .38 137 4 3.33 .40 138 4 3.51 .43 139 2 3.71 .47 140 1 3.95 .52 141 4 4.26 .59 142 3 4.68 .72
143 2 5.40 1.01
Mean SD