White Rose Research Online URL for this paper:
http://eprints.whiterose.ac.uk/83256/
Version: Published Version
Article:
Lee, AJ, Szymonik, M, Hobbs, JK et al. (1 more author) (2014) Tuning the translational
freedom of DNA for high speed AFM. Nano Research, 8 (6). 1811 - 1821. ISSN 1998-0124
https://doi.org/10.1007/s12274-014-0681-y
[email protected] https://eprints.whiterose.ac.uk/ Reuse
Unless indicated otherwise, fulltext items are protected by copyright with all rights reserved. The copyright exception in section 29 of the Copyright, Designs and Patents Act 1988 allows the making of a single copy solely for the purpose of non-commercial research or private study within the limits of fair dealing. The publisher or other rights-holder may allow further reproduction and re-use of this version - refer to the White Rose Research Online record for this item. Where records identify the publisher as the copyright holder, users can verify any specific terms of use on the publisher’s website.
Takedown
If you consider content in White Rose Research Online to be in breach of UK law, please notify us by
Tuning the translational freedom of DNA for high speed
AFM
Andrew J. Lee1, Michal Szymonik1, Jamie K. Hobbs2, and Christoph Wälti1 ()
1 Bioelectronics, School of Electronic and Electrical Engineering, University of Leeds, Leeds, LS2 9JT, UK 2 Department of Physics and Astronomy, University of Sheffield, Sheffield, S3 7RH, UK
Received:13 August 2014
Revised: 02 December 2014
Accepted: 03 December 2014
© The author(s) 2014. This article is published with open access at Springerlink.com
KEYWORDS
high speed atomic force microscopy (HS-AFM), DNA,
protein,
bionanotechnology
ABSTRACT
Direct observation is arguably the preferred way to investigate the interactions between two molecular complexes. With the development of high speed atomic force microscopy (AFM), it is becoming possible to observe directly DNA-protein interactions with relevant spatial and temporal resolutions. These interactions are of central importance to biology, bionanotechnology, and functional biologically inspired materials. As in all microscopy studies, sample preparation plays a central role in AFM observation and minimal perturbation of the sample is desired. Here, we demonstrate the ability to tune the interactions between DNA molecules and the surface to create an association strong enough to enable high-resolution AFM imaging while also providing sufficient translational freedom to allow the relevant protein-DNA interactions to take place. Furthermore, we describe a quantitative method for measuring DNA mobility, while also determining the individual forces contributing to DNA movement. We found that for a weak surface association, a significant contribution to the movement arises from the interaction of the AFM tip with the DNA. In combination, these methods enable the tuning of the surface translational freedom of DNA molecules to allow the direct study of a wide range of nucleo-protein interactions by high speed atomic force microscopy.
1
Introduction
DNA nanotechnology is a promising approach for the bottom-up construction of sophisticated nano-scale complexes. In combination with methods such as hierarchical assembly using location-specific arrange-ments of proteins upon structural DNA scaffolds [1–3],
it offers significant potential for the development of novel functional materials that are heterogeneously structured at the nano-scale. However, in order to exploit the potential of this technology, a solid understanding of the interactions that drive the bottom-up assembly of nano-scale structures has to be established.
In recent years, a significant understanding of the complex interactions between proteins and nucleic acids in vivo has been developed. When attempting to utilize these interactions outside their native biological context, however, additional factors have to be taken into account. For example, the presence of solid surfaces leads to additional interactions between DNA and proteins, and the presence of unusual topological features in the DNA molecules, for instance branch- points such as those present in DNA origami [4], can have an impact on the interactions. For the full potential of these approaches to be exploited, it is important to understand in detail the relevant interactions in the context that they are to be employed. Arguably, direct observation using atomic force microscopy (AFM) would be the preferred way to study these dynamic protein-DNA interactions in vitro and in the proximity of solid surfaces. However, the dynamic nature of these processes poses significant challenges for AFM investigations and, until recently, time-course studies of such interactions were limited by the acquisition rate of the AFM.
The recent development of high speed atomic force microscopy (HS-AFM), and in particular HS-AFM in fluid, has allowed for the direct examination of discrete biological interactions and nano-scale self-assembly processes in physiological buffer at relevant spatial and temporal resolution [5]. This technology not only enables the confirmation of established hypotheses in biology, such as the hand-over-hand motion of myosin [6], but also has the potential to further the understanding of how protein complexes and nucleic acids interact, something that is critical to all forms of life [7–13]. HS-AFM can also be applied in the study of a wide range of biologically inspired materials.
HS-AFM work builds upon two decades of biological studies with conventional AFM [14] which, to-date, has achieved significant success on model systems such as RNA polymerase [15, 16], bacteriophage Lambda Cro protein [17], DNA photolyase [18], nucleosomes [19], and restriction enzymes [20]. HS-AFM may therefore have a central role to play in bionano- technology and experimental biology, complementing current biochemical techniques and crystallography while elucidating fundamental biological processes.
The sample preparation procedure and its impact on the experiment is a key concern in all forms of microscopy. Here, AFM has distinct advantages over radiative-based alternatives, as it does not require the labeling or modification of delicate biological structures. However, AFM employs a physical probe and therefore requires the deposition of the sample on a solid support surface [14]. Muscovite mica surfaces are typically used as the substrate owing to their perfect cleavage along a <001> plane, yielding large atomically flat areas. Mica consists of layers of an aluminum phyllosilicate lattice ionically bonded through interstitial K+ ions.
Upon cleavage, these K+ ions are highly mobile and
are readily exchanged with divalent cation species at the solid–liquid interface [21]. This exchange results in a positive overcharging of the mica surface, which enables the deposition of molecules that hold a net negative charge, such as DNA [22].
The 2D confinement of the molecules inherently perturbs any biological interaction of interest. It is therefore necessary to mediate a surface absorption that allows the retention of sufficient translational and rotational freedom while securely adhering the molecules against the instantaneous lateral forces imposed by the scanning probe. Additionally, it is necessary to maintain a suitable reduced physiological environment for biological activity to be retained. Previous studies employing methods to modify the mica surface chemically [23], using cyclic dielectric fields [24, 25] and cyclic buffer exchanges [10, 26, 27], have attempted to mitigate confinement effects by cycling the surface between a loose association—
It is well established that upon cleavage of mica layers, the interstitial K+ ions are split between the
two cleavage faces and tend to cluster. The resulting vacant sites are easily filled upon exposure to divalent cations. Transition metal cations such as Ni2+, Co2+,
and Zn2+ bind irreversibly to mica and have been
demonstrated to displace residual K+ ions. They
interact with the hydroxyl groups of mica cooperatively [22, 30], leading to phase-separated domains of positive surface charge [31]. Where transition metal cations are utilized, a strong adhesion between DNA and mica is achieved due to directional bonding of the d-orbitals of the divalent cation. Such deposited DNA molecules adopt a kinetically trapped form [31], sufficient for high-resolution imaging in aqueous buffer.
In contrast, Mg2+ cannot form directional bonds
because it is continually exchanging with residual K+
and H+ ions on the mica surface and in the imaging
buffer. As a consequence, Mg2+ only mediates a
relatively weak and diffuse adhesion between DNA and the mica surface, allowing DNA molecules to adopt an equilibrated form [22, 31–33]. This complex spatial distribution has been rationalized by others [31, 33], where the phase-separated domains of ionic species are represented as an idealized polka dot pattern: An ionic patchwork of evenly distributed positively charged Ni2+ clusters interspersed across a
mica surface undergoing dynamic exchanges between K+, H+, and other cations such as Mg2+.
Previous work has taken advantage of this difference in binding capacities by adjusting the ratio between different monovalent and monovalent-to-divalent ion concentrations in the deposition buffer to alter the surface adhesion of DNA in air [20, 34, 35].
Interestingly, Mg2+ is the primary co-factor for the
majority of enzymes that manipulate all biological polyphosphates including ATP, DNA, and RNA [36]. The transient nature of Mg2+ association allows it to
be utilized, in equilibrium, as both a surface binding agent and enzymatic co-factor. Typically, cellular Mg2+ ranges from 5–20 mM, where 95% is chelated
with proteins and nucleic acids, primarily ATP [36]. However, a concentration below 10 mM is sufficient for most nucleo-protein interactions. In contrast, Ni2+ exhibits little to no physiological role in higher
organisms, enabling its use as a strong surface binding agent.
When employing the idealized polka dot represen-tation, it is possible that pre-incubation of the mica surface with different concentrations of Ni2+ allows for
control over the localized surface-DNA association. If the DNA molecules are now deposited in Mg2+ buffer,
Ni2+ should act to restrain the translational freedom
through a few specific anchor points while Mg2+
mediates a more global and distributed but weak association. Thus, the mobility of a DNA molecule is governed by the number of Ni2+ interactions and is
controlled by the Ni2+ concentration and exposure
time during surface pre-incubation.
By modulating the concentration of Ni2+ for mica
pre-treatment, we demonstrate the ability to control the surface translational freedom of DNA molecules while maintaining a fixed Mg2+ concentration within
the imaging buffer, which can be tailored to optimize the relevant nucleo-protein interactions. This allows us to maintain a transient surface interaction of nucleic acids strong enough for imaging with HS-AFM under fluid, while simultaneously providing enough mobility of the DNA to allow the relevant nucleo- protein interactions to take place. We employ a novel methodology for quantifying DNA mobility and use it to demonstrate our ability to tune the surface interaction from tightly surface-tethered to highly mobile DNA.
2 Results and discussion
2.1 Quantifying the mobility of DNA molecules
In order to establish the methodology for quantifying the mobility of surface-immobilized DNA molecules, mica substrates were pre-incubated with 15 mM Ni2+.
Subsequently, 3.5-kbp DNA molecules were deposited in Tris-Mg buffer and imaged by AFM. A Ni2+
con-centration of 15 mM was expected to provide strong surface adhesion, allowing contrasting small regions of chain mobility to be easily identified. Areas of 1 m2
chain-fitting algorithm. A chain of co-ordinates was fitted to the height peaks in the AFM image, generating a vector representation of the molecule’s conformation (Figs. 1(a) and 1(b)). This method eliminates the noise and image artifacts that arise during high-speed AFM imaging in liquid. Each selected DNA molecule was tracked sequentially through an image series, where fitting was repeated for sections of the chain that deviated from the previous image, allowing their motion to be quantified. Each chain was then divided into >100 equidistant points and a minimization algorithm was used to map corresponding points between successive frames in a time series, mitigating errors in imaging and fitting around the chain ends. The amount of motion for each pair of points could
Figure 1 A schematic diagram depicting the chain fitting and evolution processing from the raw AFM images. (a) Sequential AFM images following a single DNA molecule. (b) Derived chain vectors. (c) Mapping of chain vectors into equidistant points. (d) Point mapping is indicated across a short section of the molecule; the relevant section of the molecule is indicated by the boxes in (c). The scale bar is 100 nm.
then be calculated, averaged, and normalized to yield movement velocities for individual DNA chains or sections of a chain (Figs. 1(c) and 1(d)).
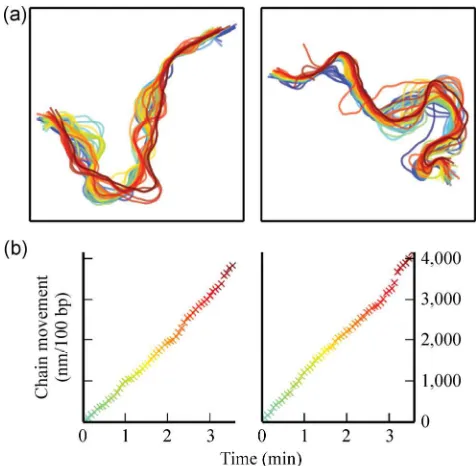
To quantify the lateral motion of each DNA molecule over time, the movements of individual molecules were analyzed. Figure 2(a) shows the time-course of two representative DNA molecules over the course of an image sequence. The time evolution is represented by a color scale, with the darkest red line representing the final state and the lightest blue line the initial state. The total distance travelled by the DNA chain, normalized by the length of the DNA chain, was determined by summing up all the distances travelled by the equidistant points on the chain. The results for the two representative DNA molecules are shown as a function of time in Fig. 2(b). The movements were found to be linear in time and hence, from the graphs in Fig. 2(b), a velocity per unit of DNA in nanometers per 100 base pairs length per second (nm·100 bp–1·s–1)
was then derived as the characteristic quantity to
[image:5.612.314.552.376.609.2]measure lateral mobility (see movie S1 in Electronic Supplementary Material (ESM) for details). This detailed analysis of the lateral motion of DNA molecules reveals a number of intricacies in the surface interaction and the influence of the microscope probe on the sample.
Analyzing the motion of DNA molecules is not a novel concept. A previous study has attempted the direct superposition of sequential images aligned to immobile parts of the molecule [37] or to a reference elsewhere in the frame [38]. Deriving additional details by analysis of vectorized molecules has also been undertaken through hand-tracing methods [39] in order to examine quantities such as elastic bending energies [40] and the influence of the AFM probe [11]. However, such studies lack detail due to the crude alignment and vector derivation methodologies, which yield mobility analyses based on single point mapping of center-of-mass or chain termini only. Consequently, these analyses lack the power to provide the understanding necessary to tune the translational
freedom of DNA and enable relevant nucleo-protein interactions to take place.
2.2 Tuning DNA surface mobility with Ni2+ pre-
incubation
To investigate whether the DNA mobility can be controlled via tuning the interaction of the surface- immobilized Ni2+ ions by varying their density, the
above approach was applied across a range of Ni2+
concentrations from 1 mM to 15 mM (Fig. 3). Varying the ion concentration was chosen over increasing the incubation time, which may lead to unwanted crystallization of Ni-salts. A lower Ni2+ concentration
is expected to lead to a lower density of positively charged sites on the surface, providing fewer pinning points for a DNA molecule and allowing it more translational freedom.
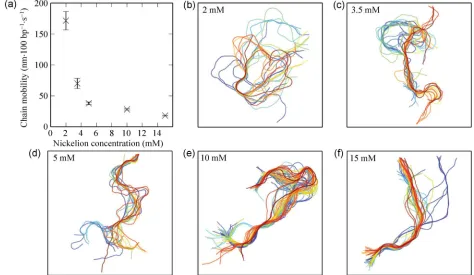
Figure 3(a) shows the chain mobility as a function of Ni2+ concentration. Each point on the graph represents
[image:6.612.67.541.405.680.2]an average across a number of DNA molecules and the error bars represent the standard deviation. It can
be seen that the DNA translational mobility increases significantly with decreasing Ni2+ concentration. Where
the surface concentration of Ni2+ is at the highest
level investigated, large regions of the chain remain stationary through many consecutive images in a series, indicating a very tight surface association (see Fig. 3(f) for an example). In contrast, below 5 mM, the surface Ni2+ becomes sufficiently sparse such that
large stretches of the DNA chain show considerable movement over the duration of the experiment (Fig. 3(d)). This is also reflected in the chain mobility, which was calculated to be 38 ± 2 nm·100 bp–1·s–1 at
5 mM Ni2+, with even larger degrees of freedom found
for 3.5 and 2 mM Ni2+ (70 ± 8 nm·100 bp–1·s–1 and
171 ± 15 nm·100 bp–1·s–1, respectively). For the lowest
Ni2+ concentration investigated (1 mM), a high velocity
of motion was observed (see Movie S2 in ESM), which meant that a meaningful quantification of the mobility was not possible; hence, this concentration is not represented in the graph.
When a particular nucleo-protein interaction is to be observed, it is necessary to be able to image specific molecules continuously over the time course of the reaction. If the surface association is too weak, the DNA molecule may be able to move out of the frame and key events will inevitably be missed. Therefore, optimal binding conditions need to present weak surface associations without large overall translational movements of the DNA across the mica surface, while at the same time allowing individual segments of the DNA molecule to move relatively freely. We concluded from the data presented in Fig. 3 that for the 3.5-kbp DNA molecules used in this study, optimal conditions are achieved at around 5 mM Ni2+, which
results in optimal spatial resolution and chain flexi-bility, with a mobility of 38 ± 2 nm·100 bp–1·s–1. This is
proposed to be sufficient for imaging enzymatic interactions with minimal hindrance from the mica support surface, while the DNA molecules remain relatively immobile within a 1 m2 imaging area. As
a proof-of-concept, we investigated the influence of different translational mobilities on the efficiency of restriction enzyme cleavage of surface-associated DNA. EcoRI was able to cleave DNA deposited on a 5 mM Ni2+ surface, allowing real-time imaging of individual
cleavage events, while on 15 mM Ni2+ surfaces, the
cleavage efficiency was minimal (see Figs. S1 and S2, Table S1 and Movie S3 in the ESM).
We note that while the values quoted here have been normalized with respect to the sequence length, the absolute size of the DNA molecule is of importance. The 3.5-kbp DNA molecules studied above were compared to shorter, 890-bp DNA molecules, which undergo large “worm-like” movements across the surface under comparable conditions (data not shown). Therefore, while the surface preparation can be tuned to produce the desired degree of nucleic acid association, it may be necessary to adjust conditions to account for the length and charge of the particular molecules of study.
2.3 Influence of the HS-AFM probe
AFM images are acquired through the monitoring of the interaction of a sharp solid tip with the surface- immobilized molecules. When imaging biological systems, the tip radius is generally of the same order of magnitude as the surface-immobilized molecules; hence, it can be expected that the interaction is signi-ficant. Furthermore, in the investigation reported here, the DNA molecules are deliberately only weakly associated with the surface, leading to increased impact from the tip-molecule interactions. Vectorization of the chain motion employed here enables behavioral analysis of individual segments of each DNA molecule and allows for the tip-DNA molecule interaction to be analyzed.
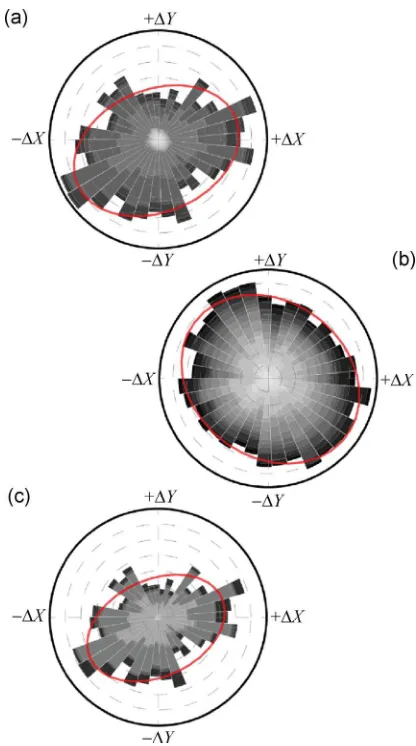
The direction of movement for each DNA chain segment is known and therefore a polar histogram of the magnitude of the movement versus the direction can be plotted for the whole dataset across all Ni2+
Figure 4 Polar histograms indicating the magnitude and directionality of chain movements (a) including all Ni2+ concentrations, (b) including only high Ni2+ concentrations (10 mM and 15 mM), and (c) including only low Ni2+ concentration (2 mM and 3.5 mM). The movements of all segments are binned according to the direction and weighted by the magnitude of the movement. The grey scale delineates the contributions of different DNA chains. The degree of the anisotropy of each histogram is indicated by the elliptical fit to the data (indicated by the red ellipsoid).
When examined more closely, it can be seen that the anisotropy arises mainly from highly mobile DNA molecules that appear on low Ni2+ sample preparations.
Figure 4(b) shows the polar histogram of the magnitude of the movement versus the direction but only with Ni2+ concentrations of 10 mM and 15 mM included. An
anisotropy of only 1.2 is obtained from the fit of the ellipsoid to the data. In contrast, when considering only the very weakly bound DNA molecules, which show significant lateral mobility (2 mM and 3.5 mM Ni2+, Fig. 4(c)), the anisotropy is even more pronounced
than in Fig. 4(a) (anisotropy of 1.5), demonstrating that the anisotropy increases with increasing lateral mobility. Notably, the skew seen in the magnitude data is found to be in line with the image acquisition direction, suggesting that the AFM tip-DNA interaction contributes significantly to the observed motion of loosely bound DNA molecules. Conversely, higher Ni2+
preparations are characterized by smaller magnitude motions and are largely isotropic in nature. This would be consistent with molecules undergoing small conformational changes as a result of thermal fluctua-tions, notably constrained against large translational AFM tip-induced motions.
The lateral forces imparted by the AFM tip naturally perturb the sample of interest and may influence the nucleo-protein interaction. However, the ability to extract detailed information regarding the behavior of molecules during the imaging process may lead to a better understanding of the nature of the observed biological interactions.
2.4 Identification of discrete surface anchor points
To consider the role of Ni2+ within our system, we
adopted the idealized polka dot surface model discussed by others [30, 32]. It is reasonable to assume that the density of surface-associated Ni2+ ions increases
with increasing Ni2+ concentration during incubation.
It has previously been demonstrated that the distri-bution of Ni2+ on the surface is highly non-uniform
[40] and lacks homogeneity [30]. However, it may be possible to gain further insight into the Ni2+/Mg2+-
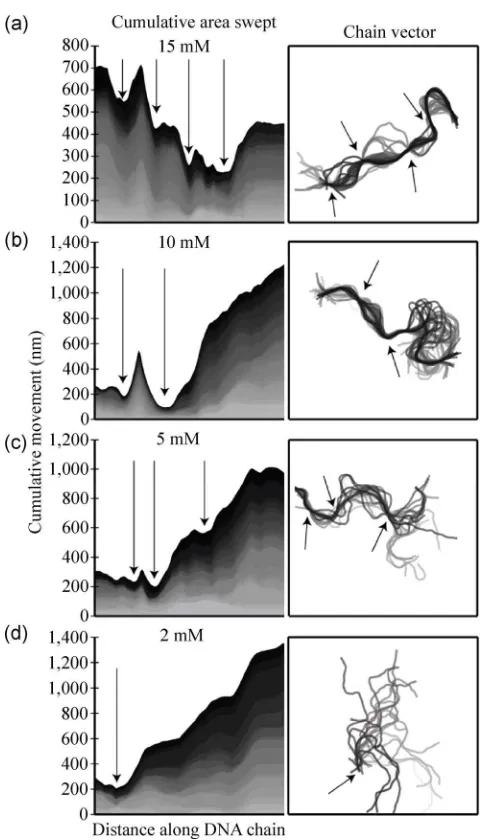
governed surface interactions by identifying regions of specific surface association by examining the motion of the DNA chains. When plotting the cumulative movement for each segment along individual DNA molecules (Fig. 5), a series of minima can be observed (indicated by arrows). Figure 5(a) shows the results for a representative DNA molecule immobilized on a 15 mM Ni2+ pre-incubated surface, and four distinct
Figure 5 Area plots depicting the cumulative movement of chain segments for representative DNA chains for different Ni2+ concentrations (left panels). Distinct regions of the DNA molecule are seen to be anchored at particular locations (indicated by arrows). The density of minima increases with Ni2+ concentrations, suggesting that Ni2+ ions provide specific anchor points on the surface to increase DNA surface association. The grey scale indicates successive frames in a time series. The panels on the right show the chain evolution with the minima location indicated by arrows.
The number of such minima, and hence the number of stationary points, decreases with decreasing Ni2+
concentration (Figs. 5(b)–(d)). We note that all of the molecules imaged on surfaces pre-incubated with
10 mM Ni2+ and in excess of half of the molecules
imaged on 5 mM Ni2+ surfaces show distinct pinning
at one or more locations. Interestingly, in some cases minima disappear over the course of the imaging
sequence, while others appear in subsequent frames, suggesting that specific surface interactions break and re-form continuously. This behavior is more prominent with molecules imaged with Ni2+ concentrations of
5 mM or lower. Although a direct correlation with surface distributions of Ni2+ would be purely speculative
without further in depth studies, the results together with previous findings on the distribution of Ni2+
ions [30, 40] suggest that positively charged Ni2+
domains act as anchor points for the negatively charged DNA chains, with the interstitial regions governed by weak Mg2+ associations, allowing for the desired
mobility.
3 Conclusion
When attempting to observe biological processes in vitro with the HS-AFM, it is essential to ensure
that the measurement only minimally perturbs the interactions of interest. For the investigation of nucleo-protein interactions, the DNA molecules have to be associated with the surface strongly enough to enable stable imaging over relevant timescales, while at the same time providing enough translational freedom to allow the proteins to interact with the DNA with minimal disturbances. A number of different approaches have been reported in the literature for controlling the surface association of DNA molecules. However, none of the existing methods offer the ability to mediate the surface interaction and thus the translational freedom of the DNA to enable large ranges of diverse investigations within the additional constraints of maintaining suitable reduced physiologi-cal conditions. Here, we demonstrated an approach to tune the surface interaction of DNA that fulfills these requirements. Both stable imaging and reaction conditions are orchestrated simultaneously without the need to perturb the system throughout the reaction time-course.
conditions which enable the investigation of a large range of nucleo-protein interactions. The presented analytical approach allowed us to investigate the impact of the AFM tip interactions with the surface- associated DNA. We showed that the overall transla-tional movement of the DNA is mostly isotropic for a stronger surface association, while increasing move-ment in the fast-scanning direction of the AFM tip is observed with decreasing strength of the surface association, indicating that the AFM tip-DNA molecule interaction contributes significantly to the overall movement.
The tools presented here confer the ability to orchestrate and evaluate discrete biological interactions for novel applications in experimental biology and bionanotechnology.
4 Experimental
section
Reagents: Linear DNA (3.5 kbp) was amplified by PCR from a modified pGEM-T plasmid vector [41]. Linear DNA (890 bp) was amplified from lambda phage DNA. Magnesium-acetate, Tris-acetate, and nickel chloride, which were prepared as 100 mM stocks with a pH of 7.4, were all purchased from Sigma Aldrich, St Louis, USA.
4.1 HS-AFM sample preparation
Mica (Agar Scientific, USA) was freshly cleaved and pre-incubated with NiCl2 (20 l) at concentrations
ranging from 1 mM to 15 mM for 1 minute. Excess NiCl2 solution was removed and DNA solution (20 l)
was immediately applied to the mica surface and incubated for 5 minutes. Subsequently, the surface was partially de-wetted. All DNA samples were prepared using 10 mM Tris-acetate (pH 7.4), 10 mM Magnesium- acetate, and 3.5 kbp DNA (10 ng). Mica samples were re-immersed in Tris-Mg buffer (200 l) for imaging, with a small volume (50 l) applied directly to the AFM cantilever.
4.2 HS-AFM imaging in aqueous buffer
All samples were imaged with a Dimension FastScan using FastScan-DX probes (Bruker AXS, USA). All images were collected at a scan rate of 38 Hz and a
resolution of 128 × 128 pixels. The drive amplitude and set point used were typically around 3 V and 200 mV, respectively, but adjusted for optimum resolution as needed.
Image analysis and chain fitting: AFM images were processed with a low-pass filter and a linear vector (chain) was fitted to the intensity peaks of the image using the ImageJ software (http://rsbweb.nih.gov/ij/) with the JFilament plugin [42]. Subsequently, the chains were split into >100 equidistant points and overlaid frame by frame (Fig. 1). Finally, the point- by-point differences between two sequential chains in a series were calculated and averaged to represent the chain movement in nm per 100 bp per second (nm·100 bp–1·s–1). This process is discussed in more
detail in the main text. The cumulative movement of individual segments along DNA molecules was calculated by adding up the distances travelled by the segments between time frames. The distribution of segments along the chains of individual time frames was chosen so that local minima in movement were aligned.
Acknowledgements
This work was funded in part by the EPSRC Centre for Doctoral Training in Molecular Scale Engineering, and WELMEC, a Centre of Excellence in Medical Engineering funded by the Wellcome Trust and EPSRC, under grant number WT 088908/Z/09/Z. The authors would like to acknowledge Alexander Dulebo, Hartmut Stadler and Bruker AXS, Karlsruhe for their time and contribution to this work, and the equipment funding from the BBSRC.
Electronic Supplementary Material: A short movie depicting the chain fitting process through a set of sequential AFM images is supplied as a visual aid to the description given in the results and discussion section (Movie S1). A short movie depicting the surface mobility of 3.5 kbp DNA fragments as a function of surface-immobilized Ni2+ concentration is supplied in
support of Fig. 3 (Movie S2).
and a short movie showing a single cleavage event (Movie S3) are provided.
This information is available in the online version of this article at http://dx.doi.org/10.1007/s12274-014- 0681-y.
Open Access: This article is distributed under the terms of the Creative Commons Attribution License which permits any use, distribution, and reproduction in any medium, provided the original author(s) and source are credited.
References
[1] Sharma, R.; Davies, A. G.; Wälti, C. Directed assembly of 3-nm-long RecA nucleoprotein filaments on double-stranded DNA with nanometer resolution. ACS Nano2014, 8, 3322– 3330.
[2] Sharma, R.; Davies, A. G.; Wälti, C. Nanoscale programmable sequence-specific patterning of DNA scaffolds using RecA protein. Nanotechnology2012, 23, 365301.
[3] Sharma, R.; Davies, A. G.; Wälti, C. RecA protein mediated nano-scale patterning of DNA scaffolds. J. Nanosci. Nanotechnol.2011, 11, 10629–10632.
[4] Rothemund, P. W. K. Folding DNA to create nanoscale shapes and patterns. Nature2006, 440, 297–302.
[5] Ando, T. High-speed atomic force microscopy coming of age. Nanotechnology2012, 23, 062001.
[6] Kodera, N.; Yamamoto, D.; Ishikawa, R.; Ando, T. Video imaging of walking myosin V by high-speed atomic force microscopy. Nature2010, 468, 72–76.
[7] Hansma, H. G.; Bezanilla, M.; Zenhausern, F.; Adrian, M.; Sinsheimer, R. L. Atomic force microscopy of DNA in aqueous solutions. Nucleic Acids Res.1993, 21, 505–512. [8] Hansma, H. G.; Laney, D. E.; Bezanilla, M.; Sinsheimer, R.
L.; Hansma, P. K. Applications for atomic force microscopy of DNA. Biophys. J.1995, 68, 1672–1677.
[9] van Noort, S. J. T.; van der Werf, K. O.; Eker, A. P. M.; Wyman, C.; de Grooth, B. G.; van Hulst, N. F.; Greve, J. Direct visualization of dynamic protein-DNA interactions with a dedicated atomic force microscpe. Biophys. J.1998, 74, 2840–2849.
[10] Thomson, N. H.; Fritz, M.; Radmacher, M.; Cleveland, J. P.; Schmidt, C. F.; Hansma, P. K. Protein tracking and detection of protein motion using atomic force microscopy. Biophys. J.1996, 70, 2421–2431.
[11] Kobayashi, M.; Sumitomo, K.; Torimitsu, K. Real-time imaging of DNA–streptavidin complex formation in solution using a high-speed atomic force microscope. Ultramicroscopy
2007, 107, 184–190.
[12] Gilmore, J. L.; Suzuki, Y.; Tamulaitis, G.; Siksnys, V.; Takeyasu, K.; Lyubchenko, Y. L. Single-molecule dynamics of the DNA-EcoRII protein complexes revealed with high- speed atomic force microscopy. Biochemistry 2009, 48, 10492–10498.
[13] Suzuki, Y.; Shin, M.; Yoshida, A.; Yoshimura, S. H.; Takeyasu, K. Fast microsopical dissection of action scenes played by Escherichia coli RNA polymerase. FEBS Lett. 2012, 586, 3187–3192.
[14] Binnig, G.; Quate, C. F.; Gerber, C. Atomic force microscope. Phys. Rev. Lett.1986, 56, 930–933.
[15] Kasas, S.; Thomson, N. H.; Smith, B. L.; Hansma, H. G.; Zhu, X. S.; Guthold, M.; Bustamante, C.; Kool, E. T.; Kashlev, M.; Hansma, P. K. Escherichia coli RNA polymerase activity observed using atomic force microscopy. Biochemistry 1997, 36, 461–468.
[16] Guthold, M.; Bezanilla, M.; Erie, D. A.; Jenkins, B.; Hansma, H. G.; Bustamante, C. Following the assembly of RNA polymerase-DNA complexes in aqueous solutions with the scanning force microscope. Proc. Natl. Acad. Sci. U. S. A. 1994, 91, 12927–12931.
[17] Erie, D. A.; Yang, G. L.; Schultz, H. C.; Bustamante, C. DNA bending by Cro protein and nonspecific complexes: Implications for protein site recognition and specificity. Science.1994, 266, 1562–1566.
[18] van Noort, J.; Orsini, F.; Eker, A.; Wyman, C.; de Grooth, B.; Greve, J. DNA bending by photolyase in specific and non-specific complexes studied by atomic force microscopy. Nucleic Acids Res.1999, 27, 3875–3880.
[19] Leuba, S. H.; Yang, G.; Robert, C.; Samori, B.; van Holde, K.; Zlatanova, J.; Bustamante, C. Three-dimensional structure of extended chromatin fibers as revealed by tapping-mode scanning force microscopy. Proc. Natl. Acad. Sci. U. S. A. 1994, 91, 11621–11625.
[20] Sorel, I.; Piétrement, O.; Hamon, L.; Baconnais, S.; Le Cam, E.; Pastré, D. The EcoRI-DNA complex as a model for investigating protein-DNA interactions by atomic force microscopy. Biochemistry2006, 45, 14675–14682.
[21] Balmer, T. E.; Christenson, H. K.; Spencer, N. D.; Heuberger, M. The effect of surface ions on water adsorption to mica. Langmuir2008, 24, 1566–1569.
[22] Hansma, H. G.; Laney, D. E. DNA binding to mica correlates with cationic radius: Assay by atomic force. Biophys. J.1996, 70, 1933–1939.
[24] Josephs, E. A.; Ye, T. Electric-field dependent conformations of single DNA molecules on a model biosensr surface. Nano Lett.2012, 12, 5255–5261.
[25] Josephs, E. A.; Ye, T. A single-molecule view of confor-mational switching of DNA tethered to a gold electrode. J. Am. Chem. Soc.2012, 134, 10021–10030.
[26] Piétrement, O.; Pastre, D.; Fusil, S.; Jeusset, J.; David, M.-O.; Landousy, F.; Hamon, L.; Zozime, A.; Le Cam, E. Reversible binding of DNA on NiCl2-treated mica by varying the ionic strength. Langmuir2003, 19, 2536–2539. [27] Abel, G. R.; Josephs, E. A.; Luong, N.; Ye, T. A switchable
surface enables visualization of single DNA hybridization events with atomic force microscopy. J. Am. Chem. Soc. 2013, 135, 6399–6402.
[28] Erdmann, M.; David, R.; Fornof, A.; Gaub, H. E. Electrically controlled DNA adhesion. Nat. Nanotechnol.2010, 5, 154– 159.
[29] Endo, M.; Sugiyama, H. Single-molecule imaging of dynamic motions of biomolecules in DNA origami nanostructures using high-speed atomic force microscopy. Acc. Chem. Res. 2014, 47, 1645–1653.
[30] Hsueh, C.; Chen, H. J.; Gimzewski, J. K.; Reed, J.; Abdel- Fattah, T. M. Localized nanoscopic surface measurements of nickel-modified mica for single-molecule DNA sequence sampling. ACS Appl. Mater. Interfaces2010, 2, 3249–3256. [31] Billingsley, D. J.; Lee, A. J.; Johansson, N. A. B.; Walton, A.; Stanger, L.; Crampton, N.; Bonass, W. A.; Thomson, N. H. Patchiness of ion-exchanged mica revealed by DNA binding dynamics at short length scales. Nanotechnology2014, 25, 025704.
[32] Zheng, J. P.; Li, Z.; Wu, A. G.; Zhou, H. L. AFM studies of DNA structures on mica in the presence of alkaline earth metal ions. Biophys. Chem.2003, 104, 37–43.
[33] Pastré, D.; Piétrement, O.; Fusil, S.; Landousy, F.; Jeusset, J.; David, M.-O.; Hamon, L.; Le Cam, E.; Zozime, A. Adsorption of DNA to mica mediated by divalent counterions: A
theoretical and experimental study. Biophys. J. 2003, 85, 2507–2518.
[34] Ellis, J. S.; Abdelhady, H. G.; Allen, S.; Davies, M. C.; Roberts, C. J.; Tendler, S. J. B.; Williams, P. M. Direct atomic force microscopy observations of monvalent ion induced binding of DNA to mica. J. Microsc.2004, 215, 297–301. [35] Pastré, D.; Hamon, L.; Landousy, F.; Sorel, I.; David, M.-O.;
Zozime, A.; Le Cam, E.; Piétrement, O. Anionic polyelectrolyte adsorption on mica mediated by multivalent cations: A solution to DNA imaging by atomic force microscopy under high ionic strengths. Langmuir2006, 22, 6651–6660. [36] Jahnen-Dechent, W.; Ketteler, M. Magnesium basics. Clin.
Kidney J.2012, 5, i3–i14.
[37] Lyubchenko, Y. L.; Shlyakhtenko, L. S.; Ando, T. Imaging of nucleic acids with atomic force microscopy. Methods2011, 54, 274–283.
[38] Guthold, M.; Zhu, X. S.; Rivetti, C.; Yang, G. L.; Thomson, N. H.; Kasas, S.; Hansma, H. G.; Smith, B.; Hansma, P. K.; Bustamante, C. Direct obsercation of one-dimensional diffusion and transcription by Escherichia Coli RNA polymerase. Biophys. J.1999, 77, 2284–2294.
[39] Bennink, M. L.; Nikova, D. N.; van der Werf, K. O.; Greve, J. Dynamic imaging of single DNA–protein interactions using atomic force. Anal. Chim. Acta2003, 479, 3–15. [40] Suzuki, Y.; Higuchi, Y.; Hizume, K.; Yokokawa, M.;
Yoshimura, S. H.; Yoshikawa, K.; Takeyasu, K. Molecular dynamics of DNA and nucleosomes in solution studied by fast-scanning atomic force microscopy. Ultramicroscopy 2010, 110, 682–688.
[41] Tosch, P.; Wälti, C. Middelberg, A. P. J.; Davies, A. G. Generic technique to generate large branched DNA complexes. Biomacromolecules2006, 7, 677–681.