A PAM50-Based Chemoendocrine Score for
Hormone Receptor
–
Positive Breast Cancer with an
Intermediate Risk of Relapse
Aleix Prat
1,2,3, Ana Lluch
4, Arran K. Turnbull
5, Anita K. Dunbier
6, Lourdes Calvo
7,
Joan Albanell
8, Juan de la Haba-Rodríguez
9, Angels Arcusa
10, Jos
e Ignacio Chac
on
11,
Pedro S
anchez-Rovira
12, Arrate Plazaola
13, Montserrat Mu
noz
~
1,2, Laia Par
e
3,
Joel S. Parker
14, Nuria Ribelles
15, Bego
na Jimenez
~
15, Abdul Aziz Bin Aiderus
5,
Rosalía Caballero
16, Barbara Adamo
1,2, Mitch Dowsett
17, Eva Carrasco
16, Miguel Martín
18,
J. Michael Dixon
5, Charles M. Perou
14,19,20, and Emilio Alba
15Abstract
Purpose:Hormone receptor–positive (HRþ) breast cancer is clinically and biologically heterogeneous, and subgroups with different prognostic and treatment sensitivities need to be identified.
Experimental Design:Research-based PAM50 subtyping and expression of additional genes was performed on 63 patients with HRþ/HER2disease randomly assigned to neoadjuvant multia-gent chemotherapy versus endocrine therapy in a phase II trial. The biology associated with treatment response was used to derive a PAM50-based chemoendocrine score (CES). CES's predictive ability was evaluated in 4 independent neoadjuvant data sets (n¼675) and 4 adjuvant data sets (n¼1,505). The association of CES, intrinsic biology, and PAM50 risk of relapse (ROR) was explored across 6,007 tumors.
Results:Most genes associated with endocrine sensitivity were also found associated with chemotherapy resistance. In the che-motherapy test/validation data sets, CES was independently
asso-ciated with pathologic complete response (pCR), even after adjust-ing for intrinsic subtype. pCR rates of the CES endocrine–sensitive (CES-E), uncertain (CES-U), and chemotherapy-sensitive (CES-C) groups in both data sets combined were 25%, 11%, and 2%, respectively. In the endocrine test/validation data sets, CES was independently associated with response. Compared with ROR,
>90% of ROR-low and ROR-high tumors were identified as CES-E and CES-C, respectively; however, each CES group represented
>25% of ROR-intermediate disease. In terms of survival outcome, CES-C was associated with poor relapse-free survival in patients with ROR-intermediate disease treated with either adjuvant endo-crine therapy only or no adjuvant systemic therapy, but not in patients treated with (neo)adjuvant chemotherapy.
Conclusions:CES is a genomic signature capable of estimating chemoendocrine sensitivity in HRþbreast cancer beyond intrinsic subtype and risk of relapse.Clin Cancer Res; 23(12); 3035–44.2016 AACR.
Introduction
Approximately 70% of invasive breast cancers at diagnosis are hormone receptor–positive and HER2-negative (HRþ/ HER2; ref. 1, 2). However, HRþ/HER2disease is clinically and biologically heterogeneous and further subclassifi
ca-tions are needed to better tailor current and future treat-ments (3–5).
Over the last decade, molecular characterization studies have identified and extensively investigated the two main molecular subtypes within HRþ/HER2 disease (i.e., Luminal A and B;
1Department of Medical Oncology, Hospital Clínic i Provincial, Barcelona,
Spain.2Translational Genomics and Targeted Therapeutics in Solid Tumors, August Pi i Sunyer Biomedical Research Institute (IDIBAPS), Barcelona, Spain.3Translational Genomics Group, Vall d'Hebron Institute of Oncology (VHIO), Barcelona, Spain.4Department of Medical Oncology, Valencia Uni-versity Hospital, Valencia, Spain.5University of Edinburgh Cancer, Research UK Centre, Edinburgh.6Department of Biochemistry, University of Otago, Dunedin, New Zealand.7Department of Medical Oncology, A Coru~na Uni-versity Hospital Complex, A Coru~na, Spain.8Department of Medical Oncol-ogy, Hospital del Mar Medical Research Institute-IMIM and Pompeu Fabra University, Barcelona, Spain.9Department of Medical Oncology, Biomedical Research Institute-IMIBIC, Reina Sofía Hospital Complex, Cordoba, Spain. 10
Department of Medical Oncology, Consorci Sanitari de Terrassa, Barcelona, Spain. 11Department of Medical Oncology, Virgen de la Salud Hospital, Toledo, Spain.12Department of Medical Oncology, Jaen Hospital Complex, Jaen, Spain. 13Department of Medical Oncology, Onkologikoa, Donostia, Spain.14Lineberger Comprehensive Cancer Center, University of North
Car-olina, Chapel Hill, North Carolina.15Department of Medical Oncology, Virgen de la Victoria University Hospital, Malaga, Spain.16GEICAM (Spanish Breast Cancer Research Group), Madrid, Spain.17Academic Department of Biochem-istry, Royal Marsden Foundation Trust, London, United Kingdom.18Instituto de Investigacion Sanitaria Gregorio Mara~non, Universidad Complutense, Madrid, Spain.19Department of Genetics, University of North Carolina, Chapel Hill, North Carolina.20Department of Pathology and Laboratory Medicine, University of North Carolina, Chapel Hill, North Carolina.
Note:Supplementary data for this article are available at Clinical Cancer Research Online (http://clincancerres.aacrjournals.org/).
Corresponding Author:Aleix Prat, Department of Medical Oncology, Hospital Clínic de Barcelona, Casanova 170, 08036, Barcelona, Spain. Phone: 646847709; Fax: 34932100860; E-mail: [email protected]
doi:10.1158/1078-0432.CCR-16-2092
2016 American Association for Cancer Research.
refs. 1, 2, 6). Luminal A tumors have an improved prognosis at 5- and 10-year follow-up compared with Luminal B tumors irrespective of classical clinical–pathologic variables (e.g., tumor size and nodal status) and (neo)adjuvant treatment (i.e., endocrine and chemotherapy; refs. 1, 2, 7, 8). In terms of treatment sensitivity, Luminal A tumors achieve significant lower rates of pathologic complete response (pCR) than Lumi-nal B tumors following neoadjuvant multiagent chemotherapy (9–12). However, less clear is the difference in endocrine sensitivity between the two luminal subtypes (13, 14).
Today, adjuvant endocrine therapy for 5 to 10 years is recommended for all patients with HRþ/HER2 early breast cancer, whereas chemotherapy is recommended for patients with intermediate- and high-risk tumors (15). However, the relationship between therapy and risk warrants further study considering that risk is associated with both factors related to tumor biology and clinical–pathologic features such as tumor size and nodal status, whereas therapy respon-siveness is generally considered to be independent of clinical– pathologic factors.
Materials and Methods
GEICAM/2006-03 clinical trialPretreatment core biopsy samples from patients recruited in the luminal cohort of the GEICAM/2006-03 phase II neoadjuvant clinical trial were evaluated (16). In this study, 95 patients with estrogen receptor (ER)–positive (Allred 3–8), progesterone recep-tor (PR)–positive (Allred 3–8), HER2(according to the ASCO/ CAP guidelines; ref. 17), and cytokeratin 8/18-positive breast cancer were randomly assigned to receive 24 weeks of neoadju-vant chemotherapy or endocrine therapy. Chemotherapy con-sisted of epirubicin combined with cyclophosphamide for 4 cycles followed by docetaxel for 4 cycles. Endocrine therapy consisted of oral exemestane. Premenopausal patients received goserelin for 6 doses.
GEICAM 2006-03 pathologic response endpoint
The 5-point scale Miller and Payne histologic grading system (18) was used to measure tumor response. In this study, the Miller
and Payne scale was reduced to a 3-point scale in order to have a fair number of cases in each category and arm: no response (grades 1 and 2), intermediate response (grade 3), and high response (grades 4 and 5).
GEICAM 2006-03 gene expression analysis
Sixty-three of 95 pretreatment tumor samples were available for gene expression analyses. Total RNA was purified to measure the expression of 543 breast cancer–related genes, 5 housekeeping genes and 14 negative and positive controls using the nCounter platform (Nanostring Technologies; ref. 19). Raw gene expression can be found in Supplementary Material.
Independent/testing data sets
Gene expression and response data were evaluated from 4 independent neoadjuvant data sets (Supplementary Material; refs. 14, 20–24). Gene expression and survival data were evalu-ated from 4 independent data sets of patients with early breast cancer (Supplementary Material; refs. 2, 20, 25, 26).
Intrinsic subtype assignment
All tumors were assigned to an intrinsic molecular subtype of breast cancer (Luminal A, Luminal B, HER2-enriched, Basal-like) and the normal-like group using the research-based PAM50 subtype predictor (27, 28), except for the Malaga cohort where the PAM50 standardized and commercial nCounter-based assay was used. Before subtyping, each individual dataset was normal-ized accordingly as previously reported (29), except for the Malaga cohort that was normalized by Nanostring according to their algorithm. Of note, the Edinburgh microarray-based dataset is composed of ERþ samples-only and proper centering for intrinsic subtyping calling was not possible (30). In this dataset, CES was evaluated as a continuous variable since it is not affected by centering.
Combined cohort of primary breast cancer
To evaluate the relationship between PAM50 subtype calls, prognosis (ROR-P) and CES, we combined PAM50 data from 7 independent and previously reported cohorts (1, 2, 11, 20, 31–33) representing a total of 6,007 primary tumor samples. CES was evaluated in each individual cohort, and a combined matrix was created (Supplementary Material).
Statistical analysis
Biologic analysis of gene lists was performed with DAVID 6.7 annotation tool (34) using the 543-gene list as back-ground. The association between the expression of each gene and Miller–Payne response (3 categories) was assessed by a quantitative Significance Analysis of Microarrays (SAM; ref. 35). In both testing data sets, association between each variable and pCR or clinical/radiological response was assessed by univariate and multivariable logistic regression analyses. The predictive performance of CES was evaluated using receiver operating characteristic (ROC) curve analysis. Estimates of survival were from the Kaplan–Meier curves and tests of differences by the log-rank test. Univariate and mul-tivariable Cox models were used to test the independent prognostic significance of each variable. ReportedPvalues are two sided.
Translational Relevance
Results
GEICAM 2006-03 dataset
Sixty-three pre- and postmenopausal patients were evaluated in this study (Table 1). Most patients presented ductal carcinomas (83%), tumor sizes of 2 to 5 cm (76%), histologic grade 3 tumors (59%), clinical node-negative disease (54%), and luminal disease by PAM50 (84%).
Following chemotherapy, Luminal B tumors showed higher Miller–Payne response than Luminal A disease (mean 2.0 vs. 1.4,
P ¼0.048). However, no difference in response between the two luminal subtypes was observed following endocrine therapy (P¼0.407). In addition, no statistical significant inter-action (P¼0.429) between subtype and treatment (endocrine vs. chemotherapy) for tumor response was observed. Interestingly, the only patient who achieved a pCR (i.e., Miller–Payne grade 5) had a Basal-like tumor and was contained within the chemother-apy arm.
Gene expression association with treatment sensitivity
To understand the biology associated with either chemother-apy or endocrine sensitivity within HRþ/HER2 disease, we explored the association between the expression of 543 breast cancer–related genes and Miller–Payne response in each treat-ment arm. High expression of 70 (12.9%) and 17 (3.1%) genes was found significantly associated (P < 0.05 uncorrected for multiple comparisons) with response after endocrine therapy and chemotherapy, respectively. The gene list associated with endocrine therapy response was enriched for the following
bio-logical processes (Supplementary Material): vasculature develop-ment (e.g., AKT1 and catenin beta 1), tube developdevelop-ment (e.g., FOXA1 and gremlin 1), and cell growth (e.g., androgen receptor andfibroblast growth factor receptor 1). On the other hand, the gene list associated with chemotherapy response was enriched for cell cycle (e.g., EXO1 and MKI67) and extracellular matrix (e.g., netrin 4 and thrombospondin 1).
We then evaluated the interaction between the expressions of each individual gene with response to therapy (endocrine vs. chemotherapy). Interestingly, 41 of the 70 genes associated with response to endocrine therapy, and 8 of 17 genes associated with chemotherapy response, showed a significant interaction with treatment (P<0.05 uncorrected for multiple comparisons). Thus, the biological factors associated with endocrine sensitivity seemed to be associated, at the same time, with chemotherapy resistance, and vice versa. Indeed, an overall inverse pattern was observed between expression of most genes and response to treatment (Fig. 1A).
To further understand the biological factors associated with treatment response, we evaluated the mean expression of genes associated with high endocrine but low chemotherapy sensitivity, or low endocrine but high chemotherapy sensitivity, across 1,034 primary tumors representing all intrinsic molecular subtypes of breast cancer (Fig. 1B). The results revealed that the biology associated with chemoendocrine sensitivity is mostly driven by the Luminal A (i.e., high endocrine but low chemotherapy sen-sitive) versus Basal-like biology (i.e., low endocrine but high chemotherapy sensitive).
Development of a PAM50-based CES
Our previous results suggested that capturing the relative differences in the Luminal A versus Basal-like biology within HRþ/HER2could help better predict endocrine and chemother-apy sensitivity. To capture this biological state in each tumor, we obtained, from the PAM50 classification algorithm, the correla-tion coefficients (CC) of each sample to the PAM50 Luminal A and Basal-like subtype centroids, and then subtracted the 2 values to create the chemoendocrine score (CES¼CC to Luminal A–CC to Basal-like). Thus, samples with a positive score were identified as being more endocrine sensitive than chemotherapy sensitive, whereas samples with a negative score were identified as being more chemotherapy sensitive (CES-C) than endocrine sensitive (CES-E; Fig. 1C). From GEICAM 2006-03 samples, cutoffs based on tertile groups were determined [CES-E vs. CES uncertain (CES-U) group, cutoff¼0.70; CES-U vs. CES-C group, cutoff¼ 0.30]. The interaction of the CES score (as a continuous variable) with treatment in the GEICAM 2006-03 trial provides some evidence of association (P¼0.059).
MDACC-based dataset
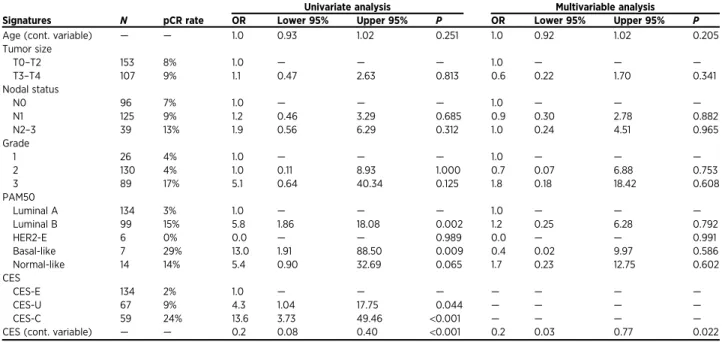
We evaluated a combined dataset of 272 patients with HRþ/HER2 disease treated with anthracycline/taxane-based neoadjuvant chemotherapy across several neoadjuvant trials (Fig. 1D and Table 2). In this dataset, 51.5%, 25.8%, and 22.7% of the samples were identified as CES-E, -U, and -C, respectively. The rates of pCR across the CES-E, -U, and -C groups were 2.4%, 9.0%, and 23.7%, respectively (P<0.0001), and were found to be similar even if non-luminal tumors were removed (2.2%, 8.8%, and 25.0%). The neoadjuvant chemotherapy predictive ability of CES was independent of clinical–pathologic variables and intrinsic subtype (Table 3; Supplementary Table S1). Similar results were
Table 1. Clinical–pathologic characteristics and subtype distribution in the GEICAM 2006-03 study
CT (%) ET (%) P
Number 32 (—) 31 (—) —
Age (mean) 53.7 (—) 52.3 (—) 0.596
Menopausal status
Premenopausal 14 (44%) 14 (45%) 1.000
Postmenopausal 18 (56%) 17 (55%)
Tumor stage
T1 1 (3%) 2 (6%) 0.420
T2 23 (72%) 25 (81%)
T3 8 (25%) 4 (13%)
Mean tumor size (cm) 4.2 3.8 0.278
Node
N0 15 (47%) 19 (61%) 0.501
N1 16 (50%) 11 (35%)
N2 1 (3%) 1 (3%)
Grade
G1 0 (0%) 0 (0%)
G2 8 (25%) 6 (19%) 0.862
G3 18 (56%) 19 (61%)
G4 6 (19%) 6 (19%)
Histologic type
Ductal 26 (81%) 26 (84%) 1.000
Lobular 2 (6%) 2 (6%)
Others 4 (13%) 3 (10%)
Ki-67 IHC (mean) 31.1 33.5 0.720
Miller–Payne response (mean) 2.6 2.2 0.124 PAM50
Luminal A 16 (50%) 13 (42%) 0.564
Luminal B 11 (34%) 13 (42%)
HER2-E 0 (0%) 1 (3%)
Basal-like 2 (6%) 0 (0%)
Normal-like 3 (9%) 4 (13%)
obtained when residual cancer burden (RCB) was used as the endpoint (Supplementary Tables S2 and S3).
Six gene expression-based signatures (i.e., PAM50 proliferation score, ROR-P, genomic grade index, SET index, chemopredictor, DLDA30, and RCB predictor) have been previously reported in this dataset (20). In addition, we applied a microarray-based version of OncotypeDX Recurrence Score (36, 37). Here, we evaluated the performance of CES to predict pCR within HRþ/HER2disease compared with these 7 gene signatures. Interestingly, CES provided the highest aROC (Supplementary Tables S4–S12) either as a continuous variable (aROC¼0.770) or as group categories (aROC ¼ 0.765). The second most predictive signature was the RCB predictor (aROC¼0.740). Of note, the RCB predictor was trained using 165 of 272 (60.7%) HRþ/HER2samples from this dataset (i.e., the train-ing dataset). When these traintrain-ing samples were removed, CES showed a higher performance either as a continuous variable (aROC¼0.805) or as group categories (aROC¼0.786) than the RCB predictor (aROC¼0.640).
Malaga-based dataset
We evaluated a dataset of 180 patients with HRþ/HER2 disease treated with anthracycline/taxane-based neoadjuvant che-motherapy (Table 2). In this dataset, 46.1%, 16.1%, and 37.8% of the samples were identified as CES-E, -U, and -C, respectively. The pCR and RCB 0/1 rates across the CES-E, -U, and -C groups were 2.4%/9.6%, 3.4%/17.2%, and 13.2%/30.9%, respectively (P¼
0.022 and 0.004).
To test the ability of CES to predict chemotherapy response independently of known clinical–pathologic variables and intrinsic subtype, we performed a multivariable logistic regres-sion analysis using RCB (0/1 vs. 2/3) as the endpoint since only 12 samples achieved a RCB 0 (i.e., pCR) in this dataset. The results revealed that CES provided independent predictive infor-mation beyond intrinsic subtype (Table 4), Ki-67 by IHC (Sup-plementary Table S13) and PAM50 ROR score (Sup(Sup-plementary Table S14). The aROC of CES for predicting RCB 0/1 was 0.746. Finally, we observed a significant association between CES and Miller–Payne response data (Supplementary Fig. S1).
Marsden-based dataset: CES and endocrine sensitivity
We evaluated a dataset of 103 postmenopausal patients with HRþdisease treated with anastrozole for 16 weeks in the neoadju-vant setting (Table 2). In this dataset, 23.5%, 34.3%, and 42.2% of samples were identified as CES-E, -U, and -C, respectively. Clinical tumor response (complete and partial response versus stable and progressive disease) was used as the endpoint. No pCR was observed in this dataset. The rates of clinical tumor response across the CES-E, -U, and -C groups were 75.0%, 48.6%, and 44.2%, respectively (P¼0.043). CES was found to be the only variable significantly associated with response (Supplementary Table S15), independently of HER2 status (Supplementary Tables S15–S16).
Edinburgh-based dataset: CES and endocrine sensitivity
We evaluated a dataset of 120 postmenopausal patients with HRþ disease treated with letrozole for at least 12 weeks in the
CES (low to high) Association with Response (OR) 0.10 0.32 1.00 3.16 10.00 MDACC
Malaga
Marsden
Edinburgh
Endocrine Chemotherapy
Higher Miller–Payne response
Lower Miller–Payne Response Interm. Miller–Payne Response Gene Expression Association
Treatment arm
TOP Genes
542 genes
8 9 10 11
7 8 9 10
Mean expression Top 50 genes
TCGA (n = 1,034)
Basal-like HER2E
LumA LumB
A
ZEB1 AR NOTCH3 FOXA1 DEGS2 GANG11 AREG MYBL2 BIRC5
B
Mean expression Top 50 genes
D
C
Chemo
Chemotherapy sensitivity
Endocrine
Endocrine sensitivity
Figure 1.
Gene expression association with either chemotherapy or endocrine therapy sensitivity.A,Association between the expression of each individual gene (n¼542) and Miller–Payne response in each arm of the GEICAM 2006-03 trial. Selected top genes whose expression is found significantly associated with response are shown on the right.B,Mean expression of the top 50 genes associated with endocrine sensitivity (top) and chemotherapy sensitivity (bottom) in the GEICAM 2006-03 trial across the intrinsic subtypes of breast cancer. The RNAseq-based gene expression data have been obtained from The Cancer Genome Atlas breast cancer project data portal (https://gdc.cancer.gov/).C, Significance and scoring
neoadjuvant setting (Supplementary Fig. S2A). Two patients of 120 achieved a complete response. Similar to previous results, CES as a continuous variable was found to be the only variable
significantly associated with a70% reduction in tumor volume by 90 days (Supplementary Fig. S2B), even within HER2-negative disease (Supplementary Fig. S2C).
Table 2. Clinical–pathologic characteristics and subtype distribution of the 4 testing sets
MDACC Malaga Marsden Edinburgh
N(%) N(%) N(%) N(%)
Treatment CT CT ET ET
N 272 180 103 120
HER2 statusa
HER2-negative 272 (100%) 180 (100%) 89 (86%) 31 (69%)
HER2-positive 0 (0%) 0 (0%) 14 (14%) 14 (31%)
Age (mean) 50.1 50.0 53.7 76.1
Menopausal status
Premenopausal NA 108 (60%) 0 (0%) 0 (0%)
Postmenopausal NA 72 (40%) 103 (100%) 120 (100%)
Tumor stage
T0–T1 19 (7%) 18 (10%) 60 (58%) 10 (9%)
T2 142 (52%) 115 (67%) 42 (36%)
T3–T4 111 (41%) 39 (23%) 43 (42%) 63 (55%)
Node
N0 96 (35%) 67 (37%) 61 (59%) 86 (72%)
N1 133 (49%) 61 (34%) 39 (38%) 34 (28%)
N2–N3 43 (16%) 52 (29%) 3 (3%)
Grade
G1 28 (11%) 27 (16%) 15 (15%) 13 (11%)
G2 136 (53%) 96 (57%) 63 (62%) 82 (68%)
G3 91 (36%) 46 (27%) 24 (23%) 25 (21%)
ET response rateb NA NA 53% 72%
CT response rate
pCR breast/axilla 8.8% 6.7% NA NA
PAM50
Luminal A 141 (52%) 54 (30%) 37 (36%) —
Luminal B 102 (38%) 105 (58%) 20 (19%) —
HER2-E 6 (2%) 7 (4%) 12 (12%) —
Basal-like 7 (2%) 14 (8%) 4 (4%) —
Normal-like 16 (6%) — 30 (29%) —
Abbreviations: CT, chemotherapy, ET, endocrine therapy. aEdinburgh dataset has 75 patients without clinical HER2 status.
bThe definition of ET response is different in the Marsden and Edinburgh data sets. Clinical tumor response (complete and partial response vs. stable and progressive disease) was used as the endpoint in the Marsden dataset. Response was evaluated by imaging ultrasound in the Edinburgh dataset. Clinical tumor response was defined as tumor volume shrinkage of at least 70% by 90 days of treatment.
Table 3. CES association with chemotherapy sensitivity in the MDACC-based dataset
Univariate analysis Multivariable analysis
Signatures N pCR rate OR Lower 95% Upper 95% P OR Lower 95% Upper 95% P
Age (cont. variable) — — 1.0 0.93 1.02 0.251 1.0 0.92 1.02 0.205
Tumor size
T0–T2 153 8% 1.0 — — — 1.0 — — —
T3–T4 107 9% 1.1 0.47 2.63 0.813 0.6 0.22 1.70 0.341
Nodal status
N0 96 7% 1.0 — — — 1.0 — — —
N1 125 9% 1.2 0.46 3.29 0.685 0.9 0.30 2.78 0.882
N2–3 39 13% 1.9 0.56 6.29 0.312 1.0 0.24 4.51 0.965
Grade
1 26 4% 1.0 — — — 1.0 — — —
2 130 4% 1.0 0.11 8.93 1.000 0.7 0.07 6.88 0.753
3 89 17% 5.1 0.64 40.34 0.125 1.8 0.18 18.42 0.608
PAM50
Luminal A 134 3% 1.0 — — — 1.0 — — —
Luminal B 99 15% 5.8 1.86 18.08 0.002 1.2 0.25 6.28 0.792
HER2-E 6 0% 0.0 — — 0.989 0.0 — — 0.991
Basal-like 7 29% 13.0 1.91 88.50 0.009 0.4 0.02 9.97 0.586
Normal-like 14 14% 5.4 0.90 32.69 0.065 1.7 0.23 12.75 0.602
CES
CES-E 134 2% 1.0 — — — — — — —
CES-U 67 9% 4.3 1.04 17.75 0.044 — — — —
CES-C 59 24% 13.6 3.73 49.46 <0.001 — — — —
Prognosis, intrinsic subtype, and chemoendocrine sensitivity
To better understand the relationship between prognosis, intrinsic biology, and chemoendocrine sensitivity, we pulled together PAM50 data from many different data sets for a total of 6,007 primary breast cancers representing all subtypes (Fig. 2). The results revealed that in the ROR-low group, 94.9% of cases were identified as CES-E and 100% were of the Luminal A subtype. In the ROR-high, 92.1% of the samples were identified as CES-C; non-luminal and Luminal B subtypes represented 64.3% and 35.7% of the ROR-high/CES-C cases, respectively.
In the ROR-intermediate group, high heterogeneity was observed. In terms of intrinsic biology, Luminal A, Luminal B, and non-Luminal subtypes represented 44.4%, 31.5%, and 24.1%, respectively. In terms of chemo/endocrine-sensitivity, CES-E, CES-U, and CES-C represented 40.6%, 30.3%, and 29.1%, respectively. As expected, the vast majority of
ROR-intermediate/CES-E samples (77.3%) were of the Luminal A subtype.
Survival outcome of CES within HRþ/ROR-intermediate disease
To continue exploring the value of CES within HRþ /ROR-intermediate disease, we evaluated the association of CES with survival outcome in HRþ/ROR-intermediate early breast cancer in 4 independent data sets of patients treated with no adjuvant systemic therapy (n¼189), adjuvant tamoxifen-only (n¼846) or adjuvant chemotherapy and endocrine therapy (n¼322 and
n¼148).
In patients with node-negative disease treated without adjuvant systemic therapy, CES (as a continuous variable or as group categories) was found significantly associated with distant relapse-free survival (Fig. 3A). The hazard ratio between the
Table 4. CES association with chemotherapy sensitivity in the Malaga dataset
Univariate analysis Multivariable analysis
Signatures N RCB0/1 rate OR Lower 95% Upper 95% P OR Lower 95% Upper 95% P
Age (cont. variable) — — 1.0 0.95 1.02 0.331 1.0 0.96 1.07 0.599
Tumor size
T0–T2 133 22% 1.0 — — — 1.0 — — —
T3–T4 39 10% 0.4 0.13 1.25 0.116 0.4 0.09 1.90 0.260
Grade
1 27 7% 1.0 — — — 1.0 — — —
2 96 16% 2.3 0.50 10.82 0.286 1.6 0.26 9.31 0.625
3 46 35% 6.7 1.40 31.82 0.017 3.0 0.40 23.34 0.283
PAM50
Luminal A 54 9% 1.0 — — — 1.0 — — —
Luminal B 105 20% 2.4 0.87 6.91 0.090 0.9 0.19 4.34 0.905
HER2-E 7 14% 1.6 0.16 16.43 0.677 0.1 0.00 3.19 0.188
Basal-like 14 50% 9.8 2.43 39.51 0.001 0.1 0.00 3.40 0.214
CES
CES-E 83 10% 1.0 — — — — — — —
CES-U 29 17% 2.0 0.58 6.54 0.277 — — — —
CES-C 68 31% 4.2 1.72 10.22 0.002 — — — —
CES (cont. variable) — — 0.2 0.09 0.44 <0.001 0.2 0.07 0.76 0.016
100 80 60 40 20 0 2.0
1.0
0
–1.0
–2.0
Luminal B Luminal A HER2-E Basal-like
Subtypes
CES SCORE
PAM50 ROR
ROR-LOW ROR-INTERM ROR-HIGH
CES-C
C
ES-E
Patients,
n
B
A
0 400 800 1,200 1,600 2,000
CES-C CES-U CES-E CES-C CES-U CES-E CES-C CES-U CES-E
ROR-LOW ROR-INTERM ROR-HIGH
Figure 2.
CES-C group versus the CES-E group was 2.68 (95% confidence interval, 0.163–0.858). Similar results were obtained in the data-set where patients were treated with adjuvant tamoxifen-only (Fig. 3B). However, CES (as a continuous variable or as group categories) was not found significantly associated with survival outcome in 2 independent cohorts of patients treated with (neo) adjuvant chemotherapy and endocrine therapy (Fig. 3C and D).
Discussion
Our results are thefirst to confirm, in a randomized setting, an inverse relationship of endocrine and chemotherapy sensi-tivity in ERþbreast cancer. Previous evidence has suggested an inverse relationship of proliferation- and ER-related biological processes regarding endocrine and chemotherapy sensitivity of
ERþ breast cancer. For example, two independent studies showed an inverse correlation between a 200-gene ER reporter score, or between TAU expression, an ER-related gene, and endocrine sensitivity and chemosensitivity (38, 39). In addi-tion, high recurrence score measured by Oncotype DX (Geno-mic Health, Inc.) predicted little or no benefit from adjuvant tamoxifen therapy in the NSABP-B14 trial, but at the same time also predicted substantial benefit from adjuvant CMF chemo-therapy in the NSABP-B20 trial (40, 41). These resultsfit with our results showing that virtually all patients with ROR-high disease are identified as CES-C; however, our data also highlight that within ROR-high/CES-C disease not all ERþ/HER2 sam-ples are luminal (i.e., Luminal A or B) since non-luminal disease (i.e., Basal-like and HER2-enriched) can also be identified. According to our results (Fig. 2), the chemotherapy benefit of
5 4
3 2
1 0
0.0
0
.2
0.4
0
.6
0.8
1
.0
Relapse-free survival probability
Log rank P < 0.0001
6 4
2
0 8
0.0
0
.2
0.4
0
.6
0.8
1
.0
6 5 4 3 2 1
0 7
0.0
0
.2
0.4
0
.6
0.8
1
.0
Log rank P = 0.971
8 6 4 2
0 10
0.0
0
.2
0.4
0
.6
0.8
1
.0
Log rank P = 0.909
CES-E
CES-C CES-U
Disease-free survival probability
Distant relapse-free survival
probability
Years
Years
Years
Years
B
A
D
C
Distant relapse-free survival
probability
Log rank P < 0.0001
Figure 3.
ROR-high/non-luminal tumors within HRþ/HER2 disease is likely even greater than ROR-high/Luminal B tumors.
Our results also suggest that a main driver of endocrine therapy sensitivity and chemotherapy sensitivity within ERþ/HER2 dis-ease is the Basal-like versus Luminal A intrinsic biology. To capture both biological states in each individual sample, we calculated the correlation coefficients of each sample to both PAM50 centroids (i.e., Luminal A and Basal-like) and then sub-tracted both coefficients. Thus, instead of choosing a gene signa-ture (e.g., a proliferation-based signasigna-ture) of the many signasigna-tures that can discriminate between both subtypes in one way or another, we decided to incorporate into a score the Basal-like versus Luminal A intrinsic state of each tumor as identified by the PAM50 subtype predictor. Of note, the PAM50 genes were orig-inally selected for their ability to capture the intrinsic biology displayed by 1,900 genes (i.e., the so-called intrinsic gene list). In fact, in the TCGA, intrinsic subtype defined by PAM50 captured the vast majority of the biological diversity displayed by most molecular data types analyzed (1).
From a clinical perspective, our results support current breast cancer guidelines for the systemic treatment of early HRþ/HER2 breast cancer. On the one hand, patients with a low-ROR score and a low tumor burden (i.e.,<10% risk of distant relapse at 10 years) are recommended to be treated with endocrine therapy-only (42). Indeed, our results suggest that these patients have tumors that are highly endocrine sensitive and have low chemo-therapy sensitivity. On the other hand, patients with high-risk HRþ/HER2 disease are recommended to be treated with endocrine therapy and chemotherapy. According to our anal-ysis, this group is the one with high chemotherapy benefit and low endocrine benefit. Regarding endocrine therapy in this group, the main issue is that we do not have survival data suggesting that CES-C tumors do not benefit at all from endo-crine therapy. Therefore, withdrawal of a potentially efficacious treatment strategy such as endocrine therapy in a patient with an ERþtumor (as defined by the ASCO/CAP guidelines) that is identified as CES-C or ROR-high should not be recommended today, although in patients whose tumors contain low levels of ER (1% to 10%), ASCO/CAP recommend to discuss the pros and cons of endocrine therapy. A large randomized adjuvant trial involving thousands of patients to answer this particular question is unlikely to happen.
Although the clinical implications of CES in low- and high-risk HRþ/HER2disease are minimal, the observation that interme-diate-risk HRþ/HER2disease, which represents30% of newly diagnosed breast cancer, is biologically heterogeneous with a range of chemotherapy sensitivities might have implications for the interpretation of two ongoing prospective clinical trials. In the TailorX phase III trial, 4,500 patients with HRþ/HER2 node-negative early breast cancer with intermediate RS have been randomly assigned to adjuvant chemotherapy or no chemother-apy. According to our analysis, this intermediate group might be composed of at least 3 groups with different chemotherapy sensitivities. Of note, the CES-U group seems to be a genuine gray area where decisions regarding the need of chemotherapy might be difficult. A similar situation might occur in the RxPON-DER phase III clinical trial where patients with HRþ/HER2early breast cancer, and 1-3-positive lymph nodes, with low/interme-diate risk are being randomly assigned to adjuvant chemotherapy or not. A potential explanation is that OncotypeDX RS, as well as other prognostic gene expression-based tests, such as PAM50 ROR
or MammaPrint (43), have been specifically designed or trained to predict outcome and not intrinsic tumor biology or treatment sensitivity. Although a strong negative correlation is observed between ROR (risk) and CES (drug sensitivity), there are sub-stantial differences between them at the individual level (40% discordance).
There are several caveats to our study. First, this is a retrospective study involving heterogeneous patient populations and the results need to be confirmed in a prospective clinical trial(s). Second, although the data presented here validate CES from a clinical perspective, further analytical validation will be needed, since in most data sets, except the Malaga set, the research-based version of PAM50 was used. However, the fact that CES (as a continuous variable and the 2 cutoff points) predicted pCR in the Malaga set suggests that analytical validation of this biomarker is feasible. Third, we did not evaluate the association of CES with survival data from a randomized clinical trial of adjuvant che-motherapy versus no adjuvant cheche-motherapy, or adjuvant endo-crine therapy versus no adjuvant endoendo-crine therapy. Thus, the predictive value of these signatures was evaluated only in the neoadjuvant setting where different tumor response endpoints were evaluated, most of which have been associated with patient survival (18, 44). Fourth, some of the signatures evaluated in the MDACC-based dataset, such as OncotypeDX recurrence score or genomic grade index, were derived from microarray-based data and thus are not the commercially available versions. Fifth, we were not able to demonstrate a consistent association of CES with endocrine response in HRþ disease after excluding the HER2-positive cases. In the Edinburgh dataset, HER2 status was not available for all patients. Although we derived an ERBB2 expres-sion-based surrogate definition of HER2 status and showed that CES is independently associated with response, this was not prespecified and does not meet REMARK guidelines. In addition, the association of CES with endocrine response did not reach statistical significance (P¼0.09) in patients with HRþ/HER2 disease in the Marsden dataset. Finally, patients from each of the data sets received different anthracycline/taxane-based chemo-therapy regimens, schedules, and doses, and thus the ability of the signatures to predict response to particular chemotherapeutics or treatment regimens could not be tested.
Another important consideration of our study is that we did not attempt to identify an optimal cutoff(s) for CES but rather focused on the association of the continuous expression of CES with each endpoint. The main reason is that different gene expression-based platforms and protocols were used in each cohort and, thus, standardization of a biomarker cutoff point would have been difficult to achieve and most likely unreliable. In any case, the fact that all four testing sets gave very similar associations, and were found independently of the platform/protocol used, argues in favor of a robustfinding.
To conclude, CES is a single genomic signature capable of measuring chemoendocrine sensitivity in HRþ/HER2 breast cancer beyond intrinsic subtype, other genomic signatures, and the standard pathology variables. CES could be of particular clinical value in patients with HRþ/HER2 intermediate-risk disease where the benefit of adjuvant multiagent chemotherapy is unclear.
Disclosure of Potential Conflicts of Interest
advisory board member for Novartis, Pfizer, and Roche. J.S. Parker is listed as a co-inventor on a pending patent on the PAM50, which is owned by University Genomics, LLC and licensed to Nanostring. M. Dowsett reports receiving speakers bureau honoraria from Myriad, and is a consultant/advisory board member for Genoptix and Nanostring. C.M. Perou is an employee of, holds ownership interest (including patents) in, and is a consultant/advisory board member for Bioclassifier LLC. No potential conflicts of interest were disclosed by the other authors.
Disclaimer
The funders did not have any role in the study design, conduct, or decision to submit the manuscript for publication.
Authors' Contributions
Conception and design:A. Prat, J. Albanell, P. Sanchez-Rovira, B. Adamo, C.M. Perou, E. Alba
Development of methodology: A. Prat, P. Sanchez-Rovira, B. Jimenez, M. Martín, C.M. Perou
Acquisition of data (provided animals, acquired and managed patients, provided facilities, etc.):A. Plazaola, N. Ribelles, B. Jimenez, M. Dowsett, M. Martín, J.M. Dixon, C.M. Perou, E. Alba
Analysis and interpretation of data (e.g., statistical analysis, biostatistics, computational analysis):A. Prat, L. Calvo, J.I. Chacon, P. Sanchez-Rovira, M. Mu~noz, L. Pare, J.S. Parker, A.A. Bin Aiderus, B. Adamo, E. Carrasco, M. Martín, C.M. Perou, E. Alba
Writing, review, and/or revision of the manuscript: A. Prat, A. Lluch, A.K. Dunbier, L. Calvo, J. Albanell, J. de la Haba-Rodríguez, A. Arcusa, J.I. Chacon, P. Sanchez-Rovira, M. Munoz, J.S. Parker, B. Jimenez, R. Caballero,~ B. Adamo, M. Dowsett, E. Carrasco, M. Martín, J.M. Dixon, C.M. Perou, E. Alba Administrative, technical, or material support (i.e., reporting or organizing data, constructing databases):A.K. Turnbull, P. Sanchez-Rovira, B. Jimenez, R. Caballero
Study supervision:P. Sanchez-Rovira, E. Alba
Acknowledgments
This work was supported by funds from the NCI Breast SPORE program (P50-CA58223-09A1), by RO1- CA148761 (C.M. Perou), by Instituto de Salud Carlos III - PI13/01718 (A. Prat), by a Career Catalyst Grant from the Susan Komen Foundation (A. Prat), by Breast Cancer Now (formerly Breakthrough Breast Cancer), by the Royal Marsden NIHR Biomedical Research Centre, by Banco Bilbao Vizcaya Argentaria (BBVA) Foundation (A. Prat), and by the Breast Cancer Research Foundation. This work was also supported by funds from FEDER (RETICC): RD12/0036/0076 (J. Albanell), RD12/0036/0051 (J. Alba-nell), RD12/0036/0070 (A. Lluch), and RD12/0036/0076 (M. Munoz).~
The costs of publication of this article were defrayed in part by the payment of page charges. This article must therefore be hereby markedadvertisementin accordance with 18 U.S.C. Section 1734 solely to indicate this fact.
Received August 20, 2016; revised October 22, 2016; accepted November 7, 2016; published OnlineFirst November 30, 2016.
References
1. TCGA. Comprehensive molecular portraits of human breast tumours. Nature 2012;490:61–70.
2. Prat A, Cheang MCU, Martín M, Parker JS, Carrasco E, Caballero R, et al. Prognostic significance of progesterone receptor–positive tumor cells with-in immunohistochemically defined luminal A breast cancer. J Clin Oncol 2013;31:203–9.
3. Ades F, Zardavas D, Bozovic-Spasojevic I, Pugliano L, Fumagalli D, de Azambuja E, et al. Luminal B breast cancer: molecular characterization, clinical management, and future perspectives. J Clin Oncol 2014;32: 2794–803.
4. Prat A, Perou CM. Deconstructing the molecular portraits of breast cancer. Mol Oncol 2011;5:5–23.
5. Prat A, Ellis MJ, Perou CM. Practical implications of gene-expression-based assays for breast oncologists. Nat Rev Clin Oncol 2012;9:48–57. 6. Perou CM, Sorlie T, Eisen MB, van de Rijn M, Jeffrey SS, Rees CA, et al.
Molecular portraits of human breast tumours. Nature 2000;406: 747–52.
7. Martín M, Prat A, Rodríguez-LescureA, Caballero R, Ebbert MW, Mun arriz B, et al. PAM50 proliferation score as a predictor of weekly paclitaxel benefit in breast cancer. Breast Cancer Res Treat 2013;138:457–66.
8. Prat A, Carey LA, Adamo B, Vidal M, Tabernero J, Cortes J, et al. Molecular features and survival outcomes of the intrinsic subtypes within HER2-positive breast cancer. J Natl Cancer Inst 2014;106;pii:dju152. doi: 10.1093/jnci/dju152.
9. Usary J, Zhao W, Darr D, Roberts PJ, Liu M, Balletta L, et al. Predicting drug responsiveness in human cancers using genetically engineered mice. Clin Cancer Res 2013;19:4889–99.
10. von Minckwitz G, Untch M, Blohmer J-U, Costa SD, Eidtmann H, Fasching PA, et al. Definition and impact of pathologic complete response on prognosis after neoadjuvant chemotherapy in various intrinsic breast cancer subtypes. J Clin Oncol 2012;30:1796–804.
11. Prat A, Parker JS, Fan C, Perou CM. PAM50 assay and the three-gene model for identifying the major and clinically relevant molecular subtypes of breast cancer. Breast Cancer Res Treat 2012;135:301–306.
12. Prat A, Fan C, Fernandez A, Hoadley KA, Martinello R, Vidal M, et al. Response and survival of breast cancer intrinsic subtypes following multi-agent neoadjuvant chemotherapy. BMC Med 2015;13:1–11.
13. Ellis MJ, Suman VJ, Hoog J, Lin L, Snider J, Prat A, et al. Randomized phase ii neoadjuvant comparison between letrozole, anastrozole, and exemestane for postmenopausal women with estrogen receptor–rich stage 2 to 3 breast cancer: clinical and biomarker outcomes and predictive value of the
baseline PAM50-based intrinsic subtype—ACOSOG Z1031. J Clin Oncol 2011;29:2342–9.
14. Dunbier AK, Anderson H, Ghazoui Z, Salter J, Parker JS, Perou CM, et al. Association between breast cancer subtypes and response to neoadjuvant anastrozole. Steroids 2011;76:736–40.
15. Goldhirsch A, Winer EP, Coates AS, Gelber RD, Piccart-Gebhart M, Thurli-€ mann B, et al. Personalizing the treatment of women with early breast cancer: highlights of the St Gallen international expert consensus on the primary therapy of early breast cancer 2013. Ann Oncol 2013. 16. Alba E, Calvo L, Albanell J, De la Haba JR, Arcusa Lanza A, Chacon JI,
et al. Chemotherapy (CT) and hormonotherapy (HT) as neoadjuvant treatment in luminal breast cancer patients: results from the GEICAM/ 2006-03, a multicenter, randomized, phase-II study. Ann Oncol 2012;23:3069–74.
17. Wolff AC, Hammond MEH, Schwartz JN, Hagerty KL, Allred DC, Cote RJ, et al. American Society of Clinical Oncology/College of American pathol-ogists guideline recommendations for human epidermal growth factor receptor 2 testing in breast cancer. J Clin Oncol 2006;25:118–45. 18. Ogston KN, Miller ID, Payne S, Hutcheon AW, Sarkar TK, Smith I, et al. A
new histological grading system to assess response of breast cancers to primary chemotherapy: prognostic significance and survival. Breast 2003; 12:320–7.
19. Geiss GK, Bumgarner RE, Birditt B, Dahl T, Dowidar N, Dunaway DL, et al. Direct multiplexed measurement of gene expression with color-coded probe pairs. Nat Biotech 2008;26:317–25.
20. Hatzis C, Pusztai L, Valero V, Booser DJ, Esserman L, Lluch A, et al. A genomic predictor of response and survival following taxane-anthracycline chemotherapy for invasive breast cancer. JAMA 2011;305:1873–81. 21. Prat A, Galvan P, Jimenez B, Buckingham W, Jeiranian HA, Schaper C, et al.
Prediction of response to neoadjuvant chemotherapy using core needle biopsy samples with the Prosigna assay. Clin Cancer Res 2016;22:560–6. 22. Dunbier AK, Anderson H, Ghazoui Z, Folkerd EJ, A'Hern R, Crowder RJ, et al. Relationship between plasma estradiol levels and estrogen-responsive gene expression in estrogen receptor–positive breast cancer in postmen-opausal women. J Clin Oncol 2010;28:1161–7.
23. Smith IE, Walsh G, Skene A, Llombart A, Mayordomo JI, Detre S, et al. A Phase II placebo-controlled trial of neoadjuvant anastrozole alone or with gefitinib in early breast cancer. J Clin Oncol 2007;25:3816–22. 24. Turnbull AK, Arthur LM, Renshaw L, Larionov AA, Kay C, Dunbier AK, et al.
25. Fan C, Prat A, Parker JS, Liu Y, Carey LA, Troester MA, et al. Building prognostic models for breast cancer patients using clinical variables and hundreds of gene expression signatures. BMC Med Genomics 2011;4: 1–15.
26. Prat A, Parker JS, Fan C, Cheang MCU, Miller LD, Bergh J, et al. Concordance among gene expression-based predictors for ER-positive breast cancer treated with adjuvant tamoxifen. Ann Oncol 2012;23: 2866–73.
27. Parker JS, Mullins M, Cheang MCU, Leung S, Voduc D, Vickery T, et al. Supervised risk predictor of breast cancer based on intrinsic subtypes. J Clin Oncol 2009;27:1160–7.
28. Nielsen TO, Parker JS, Leung S, Voduc D, Ebbert M, Vickery T, et al. A comparison of PAM50 intrinsic subtyping with immunohistochemistry and clinical prognostic factors in tamoxifen-treated estrogen receptor-positive breast cancer. Clin Cancer Res 2010;16:5222–32.
29. Prat A, Lluch A, Albanell J, Barry WT, Fan C, Chacon JI, et al. Predicting response and survival in chemotherapy-treated triple-negative breast can-cer. Br J Cancer 2014;111:1532–41.
30. Prat A, Ellis MJ, Perou CM. Practical implications of gene-expression-based assays for breast oncologists. Nat Rev Clin Oncol 2011;9:48–57. 31. Curtis C, Shah SP, Chin S-F, Turashvili G, Rueda OM, Dunning MJ, et al.
The genomic and transcriptomic architecture of 2,000 breast tumours reveals novel subgroups. Nature 2012;486:346–52.
32. Horak CE, Pusztai L, Xing G, Trifan OC, Saura C, Tseng L-M, et al. Biomarker analysis of neoadjuvant doxorubicin/cyclophosphamide followed by ixa-bepilone or paclitaxel in early-stage breast cancer. Clin Cancer Res 2013; 19:1587–95.
33. Fan C, Prat A, Parker J, Liu Y, Carey L, Troester M, et al. Building prognostic models for breast cancer patients using clinical variables and hundreds of gene expression signatures. BMC Med Genomics 2011;4:3.
34. Dennis G, Sherman BT, Hosack DA, Yang J, Gao W, Lane HC, et al. DAVID: database for annotation, visualization, and Integrated discovery. Genome Biol 2003;4:R60.
35. Tusher VG, Tibshirani R, Chu G. Significance analysis of microarrays applied to the ionizing radiation response. Proc Natl Acad Sci U S A 2001;98:5116–21.
36. Fan C, Oh DS, Wessels L, Weigelt B, Nuyten DSA, Nobel AB, et al. Concordance among gene-expression–based predictors for breast cancer. N Engl J Med 2006;355:560–9.
37. Paik S, Shak S, Tang G, Kim C, Baker J, Cronin M, et al. A multigene assay to predict recurrence of tamoxifen-treated, node-negative breast cancer. N Engl J Med 2004;351:2817–26.
38. Symmans WF, Hatzis C, Sotiriou C, Andre F, Peintinger F, Regitnig P, et al. Genomic index of sensitivity to endocrine therapy for breast cancer. J Clin Oncol 2010;28:4111–9.
39. Andre F, Hatzis C, Anderson K, Sotiriou C, Mazouni C, Mejia J, et al. Microtubule-associated protein-tau is a bifunctional predictor of endo-crine sensitivity and chemotherapy resistance in estrogen receptor–positive breast cancer. Clin Cancer Res 2007;13:2061–7.
40. Paik S, Shak S, Tang G, Kim C, Baker J, Cronin M, et al. A multigene assay to predict recurrence of tamoxifen-treated, node-negative breast cancer. N Engl J Med 2004;351:2817–26.
41. Paik S, Tang G, Shak S, Kim C, Baker J, Kim W, et al. Gene expression and benefit of chemotherapy in women with node-negative, estrogen receptor–
positive breast cancer. J Clin Oncol 2006;24:3726–34.
42. Harris LN, Ismaila N, McShane LM, Andre F, Collyar DE, Gonzalez-Angulo AM, et al. Use of biomarkers to guide decisions on adjuvant systemic therapy for women with early-stage invasive breast cancer: American Society of Clinical Oncology Clinical Practice Guideline. J Clin Oncol 2016;34:1134–50.
43. van 't Veer LJ, Dai H, van de Vijver MJ, He YD, Hart AAM, Mao M, et al. Gene expression profiling predicts clinical outcome of breast cancer. Nature 2002;415:530–6.