1
Performance-based validation of climatic zoning for building
1energy efficiency applications
23
Angélica Walsh
1, Daniel Cóstola
2,3, Lucila Chebel Labaki
1 41 - UNICAMP State University of Campinas, Brazil 5
2 -University of Strathclyde, Scotland, United Kingdom 6
3-IMED – Faculdade Meridional, Brazil 7
8 9
Abstract 10
Climatic zoning for building energy efficiency applications is an important element in building energy policy and 11
regulations. There are several methodologies available to conduct climatic zoning, providing significantly different results. 12
Currently, there are no procedures to assess the validity of a proposed climatic zoning, hindering the decision to use one 13
particular climatic zoning methodology instead of another. This paper introduces a quality index and a procedure to support 14
the validation of climatic zoning. The procedure is based on building performance simulation results concerning the 15
building stock that is targeted in the climatic zoning policy or program. Simulation results are used to calculate a new index, 16
the Mean Percentage of Misclassified Areas (MPMA), which assesses the quality of the zoning under analysis. The 17
capabilities of this procedure were demonstrated by the evaluation of four alternatives for the climatic zoning of Nicaragua, 18
obtained using different methodologies and previously reported in the literature. The building stock used in this case study 19
is composed of a few archetypes based on typical naturally ventilated dwellings in this country. Simulations were conducted 20
using the program EnergyPlus for a total of 328 locations in Nicaragua. Degree-hours of discomfort based on the adaptive 21
model of ASHRAE Standard 55 were used as a performance indicator. Results indicate that zoning obtained using cluster 22
analysis and cooling degree-days may misclassify 1 out of 5 areas in Nicaragua (MPMA around 18% to 20%). This study 23
concludes that the validation procedure and proposed index are useful for highlighting qualities and deficiencies of existing 24
climatic zoning methods, particularly when these methods are used in less conventional applications, such as for policy 25
making targeting naturally ventilated dwellings in tropical climates. The application of this procedure in more than 50 26
countries which adopt climatic zoning is foreseen as the next step in his area, substantially affecting the prescription of 27
building materials and components worldwide. 28
29
Keywords: Climatic zoning, building energy efficiency, cluster analysis, degree-days methodology. 30
31
2
1
Introduction
1
Climatic zoning is an important tool in building energy policy and regulations [1–3]. This tool has been implemented in at 2
least 54 countries which are responsible for more than 85% of world primary energy consumption [4]. There are several 3
approaches available to conduct climatic zoning [5] [6,7] and choosing the most suitable methodology for a given country 4
has proven to be a hard task [4]. This difficulty has important implications in the global energy policy scenario [8–10] as 5
many labelling programs [11], standards [12] [13] and regulations [14] rely on such methodologies. In the tropical context, 6
energy conservation strategies derived from climatic zoning will have a substantial impact on the future ofglobal energy 7
use, as the population and energy demand grows faster in this region than anywhere else in the world [15,16] [17]. 8
The complexity of the proper selection of climatic zoning methodologies has been demonstrated in various studies 9
[1][7][18]. A recent comparison of three widely used methodologies for climatic zoning (degree-days, cluster analysis and 10
administrative divisions), carried out for Nicaragua, a tropical country in Central America [7], could not identify the most 11
adequate methodology for the zoning of this country. A qualitative analysis showed that all methodologies have particular 12
strengths and deficiencies [7]. In quantitative terms, this recent comparison could not offer any indication of the correctness 13
of the zoning generated from each methodology, but the study made an attempt to quantify the level of agreement of results 14
obtained using different methodologies. Results indicate that methodologies agree on the classification of 63% of the 15
territory analysed, while the remaining 37% were placed in different zones depending on the methodology applied [7]. 16
These results, along with an extensive literature review of climatic zoning methodologies [4], highlight the need for a 17
procedure to assess in quantitative terms the validity of climatic zoning for building energy efficiency applications, 18
supporting the choice for a particular climatic zoning methodology. 19
A variety of climatic zoning methodologies have been used for many years in several fields (e.g. predict thermal 20
expectations of tourists [19], areas suitable for crops [20,21], wind power [22]). The variety of applications of climatic 21
zoning implies that a given set of climatic zones must be validated for a specific purpose, as zones that may suit well one 22
application (e.g. agriculture) may have major deficiencies if applied to another purpose. To the best of the 23
authors' knowledge, in the field of climatic zoning for building energy efficiency applications, no attempt to conduct a 24
systematic validation has been reported in literature to date. Climatic zoning results are usually assumed to be correct and 25
valid per se, being directly applied to building energy regulations (as schematically represented in Figure 1a). The approach 26
in Figure 1a is based on a weather centred definition where climatic zones are: 27
“regions which exhibit similar meteorological conditions for the main weather parameters which affect the 28
3 The definition above concentrates the entire analysis on the climate itself. The actual heating and cooling energy 1
requirements of buildings are seldom analysed to define climatic zones. Climatic zoning methodologies using this approach 2
are based on expected levels of similarity in climate variables within the zone, adopting particular statistical tools and 3
assumptions in their analysis. Each methodology adopts a variety of assumptions (often based on clear and valid reasoning), 4
being impossible to favour one methodology over another. As analyses only address climatic variables, there is no attempt 5
to characterize, in terms of performance, the complex interaction between climate and building stock over the course of the 6
year. With no information on performance, it is impossible to take an informed decision on the validity of assumptions 7
adopted by each climatic zoning methodology. Therefore, the weather centred definition is not particularly suitable if one 8
intends to validate the climatic zoning, inquiring on the match between climate and building performance variations 9
throughout the territory. 10
An alternative scenario to the climate-centred definition is shown in Figure 1b, where validation of climatic zoning 11
precedes its application in building energy regulations. This scenario is based on a building performance centred definition, 12
which is also valid for prescriptive-based approaches. In this scenario, climatic zones are: 13
regions in which a set of performance indicators regarding relevant buildings show (1) significant variation 14
between identical buildings located in distinct zones and (2) small variation between identical buildings located 15
at different points within the same zone, resulting from variations in climatic conditions. 16
This definition facilitates the evaluation of assumptions adopted by each climatic zoning methodology, as the effect of 17
these assumptions on the energy performance of a relevant set of buildings is the key element of this approach. If the 18
assumptions are adequate, identical buildings in different zones will have very clear and distinct performance and identical 19
buildings within the same zone will have similar performance (complying with the definition above). Under this definition, 20
climatic zoning can still be carried out with no performance data, e.g. using the degree-days methodology. However, the 21
validity of the resulting climatic zoning can only be demonstrated if performance data is available for all relevant points in 22
each zone, considering a set of relevant buildings (the production of performance data using simulation is discussed in detail 23
in this paper). Based on these building performance data, policymakers can evaluate if the magnitude of variations within 24
and among zones is acceptable (or not), closing the cycle in Figure 1b. The paper proposes a metric to facilitate this 25
decision-making process. 26
The present study heavily relies on two previous research studies Ref. [4] and [7]. Ref [4] is a review paper that 27
compares the features addressed by various methods for climatic zoning. By doing so, it exposes the large range of options 28
4 methodologies to a given country, to contrast results or to provide a recommendation on the suitability of each climatic 1
zoning methodology. 2
Ref [7] makes a first attempt to compare (in qualitative terms) the outcomes of key climatic zoning methodologies when 3
applied to a given country (in this case Nicaragua was chosen for reasons described in the paper). Ref [7] shows that each 4
methodology produces substantially differing results, but highlights that, based on present knowledge, it was not possible to 5
state which was the most suitable. Ref [7] indicates the need for a quantitative assessment method, enabling a fair scientific 6
comparison of climatic zoning results created using different methodologies. 7
This study addresses this need and proposes a methodology based on the intensive use of building performance 8
simulation results to support the assessment of climatic zoning. The use of simulation to drive climatic zoning [24][25] and 9
to define the most appropriate design guidelines for each climate [26][27][28] has grown in the recent past, but to the 10
best of the authors' knowledge there is no structured procedure reported in literature to use simulation for assessing the 11
validity of climatic zones. Even though there is a strong relation between the climatic zoning methodologies and the 12
definition of the suitable strategies to achieve certain performance, the procedure proposed in this paper only addresses the 13
validation of climatic zoning. Due to its complexity, this procedure is considered as a preliminary step needed to define 14
building energy policies, recommendations and requirements for each climatic zone. Using this method, one can compare 15
several candidates for climatic zoning, produced using various methods, and indicate which one better suits the region under 16
study (taking into consideration the types of buildings to be constructed there and the relevant performance indicators 17
chosen for the analysis). The procedure is described in detail in Section 2. The capabilities of this procedure are 18
demonstrated in Section 3 by assessing the validity of four alternatives for the climatic zoning of Nicaragua (for policies 19
targeting the thermal performance of naturally ventilated dwellings). Results are discussed in Section 4 and conclusions are 20
summarized in Section 5. 21
2
Climatic zoning validation procedure
22
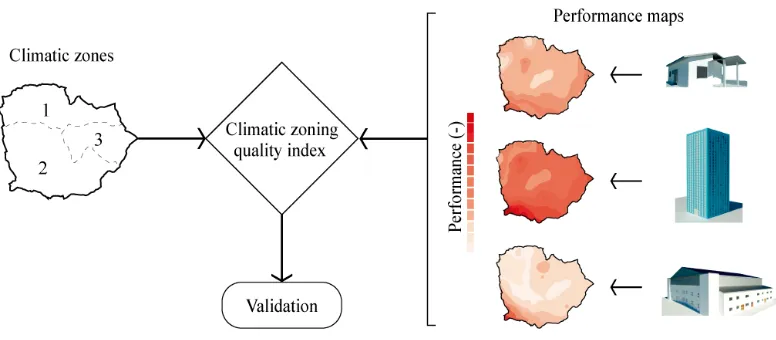
The validation procedure of climatic zoning proposed in this paper consists of quantifying the level of mismatch between 23
climatic zones and building performance. To conduct such a procedure, maps representing the performance of building 24
stock targeted in the climatic zoning are compared with climatic zoning boundaries using suitable climatic zoning metric(s), 25
as schematically depicted in Figure 2. The procedure assumes a climatic zoning is available for validation, therefore this 26
section further describes the other two elements in Figure 2: a) the production of performance maps for relevant archetypes 27
using building simulation (Section 2.1) and b) a new climatic zoning quality index capable of summarizing, in a single 28
meaningful value, the level of disagreement between the zoning under validation and the variation of building performance 29
5 2.1 Building performance maps
1
Performance maps show how a set of chosen indicators, such as energy consumption or thermal comfort, vary throughout 2
the territory (country or region) for given archetype buildings, for a typical year of climatic data. These maps can be 3
produced using building performance simulation, addressing each relevant archetype in the building stock and adopting 4
climate files for various locations in the territory. This section addresses the main elements required for the production of 5
such maps, which are listed in Figure 3 and briefly discussed in the next paragraphs. 6
Building archetypes, representing to a certain extent the building stock, are essential to validate climatic zoning using 7
the procedure proposed in this paper. Building stock modelling for energy purposes is an active field [29–31][32] and stock 8
models range from a few archetype buildings [26,33] to large ensembles with detailed information on relevant buildings 9
[34].The procedure to assess the validity of climatic zoning results is applicable to both simple or complex building stock 10
models, as long as the stock model properly represents real cases in the region subject to climatic zoning. At the moment, 11
few countries have reliable models describing their building stock and research in stock modelling and climatic zoning is 12
expected to evolve in the near future, supporting validation activities addressed in the present paper [35] [36,37].In spite of 13
difficulties of finding reliable descriptions of the building stock, there are some promising initiatives in place to close this 14
gap. A case worth mentioning is the stock model of commercial buildings in the USA produced by the Department of 15
Energy, composed of sixteen archetypes covering the main features encountered in real buildings in this country [38]. These 16
archetypes could be used to validate, for example, the climatic zoning proposed by ASHRAE to the USA territory or the 17
climatic zoning proposed by the state of California [12,39], which show remarkable differences, as discussed in Ref. [4]. In 18
cases where such detailed stock models are not available, the validation of climatic zoning must address the identification of 19
a few typical buildings to be used in the analysis (developing a preliminary low-resolution stock model). While low 20
resolution stock models are not ideal, they provide the starting point for an iterative process of refinement that eventually 21
leads to stock models of adequate resolution. This iterative refinement can be observed in a series of energy simulation 22
activities for energy policy in Brazil, where the description of the building stock has substantially evolved in the course of a 23
decade of work [33,40,41]. 24
The energy performance of archetypes in the building stock is strongly influenced by occupant behaviours and controls 25
[29,42] [43] . Adequate assumptions must be adopted about occupancy pattern, set point temperatures, internal heat gains 26
and schedules. Scientific data to support the adoption of such assumptions is not often available and some level of field 27
work may be required to investigate these factors prior to the validation of climatic zoning. 28
Several building performance indicators can be applied in the context of this validation procedure. Building performance 29
6 can be adopted in the simulations. Countries with buildings with no HVAC can have climatic zoning based on thermal 1
comfort (performance goal) which can be expressed by a number of performance indicators, such as hours of discomfort 2
based on a reference temperature or based on adaptive thermal comfort models [44]. These performance indicators have 3
important implications for building energy demand [45,46]. Greenhouse gases emissions can also be used as a performance 4
indicator in cases where multiple sources of energy with different CO2 footprints are available and environmental impact is 5
a primary concerning in energy policy. In energy grids operating close to their maximum capacity, energy load in peak 6
hours can be used as the performance indicator to drive climatic zoning. Policymakers must define a priori the goals of 7
climatic zoning and the adequate performance indicators at the building level to evaluate them. 8
Building energy performance can be evaluated using a variety of simulation programs. This validation procedure is 9
applicable for both simplified compliance programs [11,47,48] and for state-of-the-art dynamic integrated energy simulation 10
programs [27,49–54]. The only requirements are that these programs have been validated and are capable of providing 11
results for the chosen performance indicator. Due to the large number of simulations needed in the validation of climatic 12
zoning, it is essential that the simulation program supports command line entries to allow the automation of simulations and 13
result analysis. 14
Weather data is a key input data for simulation and for this validation procedure [55,56] [57]. Building energy 15
simulation requires hourly data of multiple variables for the 8760 hours of the year and this sort of information is not often 16
available in the desired spatial resolution in the entire territory/country under consideration. Finding high-quality data with 17
large spatial coverage is a major challenge in the application of this validation procedure. Interpolated data using weather 18
stations, satellite images and results from weather models, e.g. by Autodesk and Meteonorm [58–60], can be used when 19
high-quality measured data is not available. The accuracy of interpolated data must be evaluated on case to case basis by 20
comparing high-quality data samples with interpolated data for the same location. 21
This validation procedure requires large numbers of simulations, as each archetype in the building stock must be 22
simulated for all relevant points in the territory. In cases like this, quality assurance becomes a key issue. Discussing quality 23
assurance measures in large batches of simulations is beyond the scope of this paper, but the need for a strategy to check 24
results and minimize error in large simulation sets must be addressed in the validation study. In-depth analysis of a small 25
sample of simulation results can be adopted as a basic quality assurance measure. The visual inspection of automatically 26
produced plots and indicators for each simulation can be also used to detect obvious anomalies in results (such problems in 27
the implementation of HVAC controls or unrealistic outputs generated by mistakes in the automation script). These checks, 28
even the most basic ones, are essential to provide some degree of confidence to simulation results and consequently to the 29
7 Simulation results for each archetype must be georeferenced using a geographical information system program to 1
produce buildings performance maps. Then, the use of suitable metrics is necessary to combine in a simple index the vast 2
amount of performance data available for the several archetypes in the building stock, placed in the several locations used in 3
the analysis. 4
2.2 A climatic zoning quality index: Mean percentage of misclassified areas (MPMA) 5
To the best of the authors' knowledge,metrics to assess the quality of a given climatic zoning have not been reported in the 6
literature. This section proposes a quality index for this purpose, based on the premise that, in an ideal scenario, each 7
climatic zone has a unique climate, which leads to a unique performance for a particular archetype. By this, minimum 8
overlap should be observed in the building performance of an identical archetype building placed in different zones. The 9
quality index introduced in this section quantifies such overlap, indicating to what extent the climate in each zone is unique 10
and which leads to a particular building performance. 11
Before introducing this new climatic zoning quality index, it is useful to review the nature of building performance data 12
in performance maps. Let´s consider the case of a building performance map showing annual energy consumption for 13
heating and cooling for a particular archetype (obtained using simulation for hundreds of locations in the territory subject to 14
zoning). Such a performance map can be post processed using histograms for each zone as depicted in Figure 4a and 4b. 15
These histograms show the number of points in space inside each zone where the archetype has a given energy 16
consumption. Figure 4a shows that due to climatic variations throughout Zone 1, the energy consumption of this archetype 17
varies between 60 and 130 kWh/m2.yr and the most frequent energy consumption among the points of this zone is around 18
100 kWh/m2.yr. Figure 4b shows that Zone 2 has a more severe climate and the energy consumption of the same archetype 19
in this zone goes up to 200 kWh/m2.yr. Figure 4b also shows that Zone 2 has larger climatic variations than Zone 1 which 20
leads to a wider spread of energy consumption in this zone. Energy consumption in Zone 2 shows values as low as 90 21
kWh/m2.yr and the most frequent energy consumption in the zone is around 135 kWh/m2.yr. In the ideal scenario, each zone 22
would have a distinct climate, leading to distinct building energy consumption, but this is not the case seen in Figure 4. 23
These two zones do have distinct characteristics, but it is clear that some overlap in energy consumption can be observed, as 24
highlighted in Figure 4c, in the region of annual energy consumption between 90 and 130 kWh/m2.yr. Understanding this 25
energy consumption overlap is a key element to quantify the success of the climatic zoning strategy. 26
Figure 5a highlights two parts of the histogram from Figure 4c: performance bins with no overlap between zones and 27
performance bins with overlap. Bins with no overlap, such as energy consumption from 60 to 90 kWh/m2.yr and from 130 28
to 200 kWh/m2.yr are correctly placed in Zones 1 and 2 respectively, as the distinct climates in these two zones lead to 29
8 kWh/m2.yr, indicate the existence of several points in both zones with similar energy consumption. For each performance 1
bin, it is possible to identify a zone with a higher frequency and a zone with a lower frequency of occurrence of points 2
showing this particular energy consumption. Bins close to 90 kWh/m2.yr, for example, show a majority of points in Zone 1 3
(solid red bar), with minor occurrences of points in Zone 2 (hatched grey bars). In the region between 115 and 130 4
kWh/m2.yr, it is more frequent to find points in Zone 2 (solid grey bars) in contrast to minor occurrences of points in Zone 1 5
(hatched red bars). The solid bars in the graph identify what can be assumed as the most appropriate classification for points 6
in a given performance bin. The hatched bars, depicted more clearly in Figure 5b, identify points in space that should have 7
been classified in another zone, i.e. as misclassified points. Misclassified points are those which would better fit in another 8
zone considering the relation between climate and building performance. These points can be defined as the ones where the 9
building performance for a particular archetype is closer to the performance typically found in another zone rather than 10
being close to the performance found in the majority of points within its allocated zone. 11
For any particular archetype, it is possible to calculate the percentage of misclassified areas for a given set of climatic 12
zones. This provides a quantitative indication of the match between the climate of each zone and the corresponding 13
performance found in buildings exposed to this climate. The sum of bars in Figure 5b indicates that the percentage of 14
misclassified areas corresponds to 10% of the area of the territory, considering this particular climatic zoning methodology 15
and the archetype under analysis. These areas are identified in Figure 5c. 16
It is worth mentioning that the percentage of misclassified areas must be calculated for different archetypes representing 17
the building stock, as different buildings show different sensitivity to each climatic variable. While one archetype with high 18
window-to-wall ratio may be very sensitive to solar radiation, another archetype with an evaporative cooling system may be 19
particularly sensitive to variations in relative humidity. The climatic zoning is meant to be applicable to a wide range of 20
buildings in the stock, therefore it is natural that the percentage of misclassified areas will vary depending on the archetype 21
analysed. Consider the example of Figure 6a, where values of the percentage of misclassified areas are presented for three 22
different archetypes for a particular climatic zoning under validation. In this case, a limited number of archetypes is used for 23
simplicity, so results can be easily presented in a graph such as Figure 6b. In reality, hundreds of archetypes will often be 24
used to properly describe the building stock of a certain territory. To address this, the Mean Percentage of Misclassified 25
Area (MPMA) is introduced as the key quality index to support the validation of climatic zoning results. MPMA can 26
combine the results of percentage of misclassified areas for all archetypes, providing a single value to indicate the overall 27
agreement between climatic zoning and performance for a given building stock (as shown in Figure 6c). In the case of 28
Figure 6c, the MPMA is 10%, i.e. one out of 10 areas in the territory was misclassified in the climatic zoning under 29
9 informed decision about the suitability of a climatic zoning (with its MPMA) for a given building energy policy. Validation 1
is, after all, a qualitative process supported by quantitative evidence. 2
This section described the proposed validation procedure, discussed the production of building performance maps and 3
introduced a quality index to assess a climatic zoning. The use of this procedure is exemplified in the next sections in a case 4
study of potential climatic zoning alternatives for Nicaragua. 5
3
Case study: Methodology
6
3.1 Climatic zonings for Nicaragua 7
Climatic zonings previously developed using the following four methodologies were adopted here [7]: degree-days 8
based on ASHRAE guidelines (Figure 7a), cluster analysis using three and four zones ( Figure 7b and c respectively) and 9
administrative divisions taken as climatic zones (Figure 7d). Degree-days and cluster analysis were based on weather data 10
for building energy simulation from Autodesk Green Building Studio [59]. This data is based on a combination of 11
observational data and weather modelling at a spatial resolution of approximately 20km [59] using the Rapid Update Cycle 12
(RUC) [61] and Mesoscale Meteorological Model version 5 (MM5) [62]. Weather data for 328 locations were used in the 13
zoning and a number of quality assurance measures were taken regarding the data processing to avoid errors in the 14
manipulation of such large datasets (e.g. comparison with climatic data from other sources showing a standard deviation of 15
air temperature ±5%, visual inspection of data plots for each variable and location, data analysis of intermediate results 16
during data processing) [7]. The four climatic zonings depicted in Figure 7 have many similarities but also present very 17
distinctive features as they disagree on the classification of 37% of Nicaragua’s territory [7]. There are solid arguments to 18
take or refuse each one of them as the ideal candidate for climatic zoning of Nicaragua [7] and the validation procedure 19
proposed here can cast light on this complex decision-making problem which is currently open. 20
3.2 Building performance maps 21
This section describes assumptions and settings adopted in building energy simulations carried out for this study, where four 22
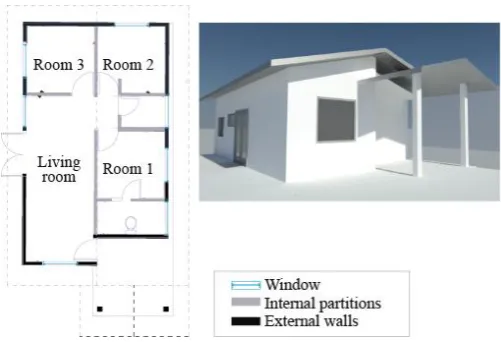
archetype buildings were addressed. The number of archetypes was kept small to facilitate the understanding of results by 23
the reader; the validation procedure is equally applicable to large numbers of archetypes [26]. In this case study, all four 24
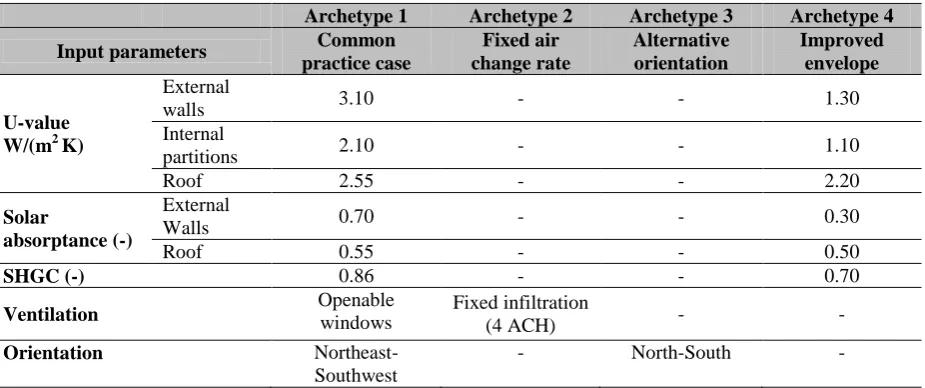
archetypes are based on the same geometry, a typical dwelling commonly found in Nicaragua (Figure 8) and validated 25
through field measurements [63]. The properties of each archetype are summarized in Table 1. Archetype 1 represents the 26
base case. Archetype 2 was simulated with a fixed air change rate to represent a simplification often adopted in energy 27
assessment for labelling of dwellings in tropical countries [11,64]. Archetype 3 represents an alternative orientation over the 28
North-South axis, which entails the largest facades of the dwelling being more exposed to solar heat gains. Archetype 4 29
10 may hinder its usage. Occupancy patterns and internal gains were based on previous studies [65]. In spite of using the same 1
archetypes for simulations in all parts of the country, this study does not imply that any single building (or set of properties) 2
is able to provide adequate performance in all climatic zones. There is an implicit understanding that once the climatic 3
zoning is validated, a subsequent study will investigate optimum properties for each zone. 4
Residential buildings in Nicaragua often do not have HVAC therefore energy consumption is not a suitable performance 5
indicator in this study. Hence, thermal comfort was adopted as the building performance indicator. The number of degree-6
hours of discomfort per year in the main zones of the building (Room 1, Room 2, Room 3 and the Living room in Figure 8) 7
was calculated according to 80% acceptability limits of the adaptive comfort model on ASHRAE Standard 55 -2013 8
[66,67]. Results for these zones were used to calculate the average number of degree-hours of discomfort per year in the 9
dwelling, which was used in the performance maps and calculation of MPMA. 10
Simulations were conducted using the program EnergyPlus[27,68,69] for 328 locations in Nicaragua, the same locations 11
adopted in the development of climatic zonings depicted in Figure 7; weather data in the simulations was also the same used 12
in the zoning. Archetypes with natural ventilation were simulated using the airflow network capability available in 13
EnergyPlus software, based on recommendations from previous studies [17,70]. Pre and post-processing were fully 14
automated using MatlabR14, including quality assurance measures to prevent errors during data manipulations (by using in-15
depth analysis of results for a sample of archetypes and locations). Simulation results of each archetype were then 16
georeferenced using ArcGIS 10.5. For each climatic zoning alternative in Figure 7, performance data was coupled to the 17
corresponding climatic zones. Subsequently, the frequency distribution based on performance results was calculated and 18
analysed. The percentage of misclassified areas of each zone was then identified and the MPMA calculated. 19
4
Results of the case study
20
4.1 Building performance maps 21
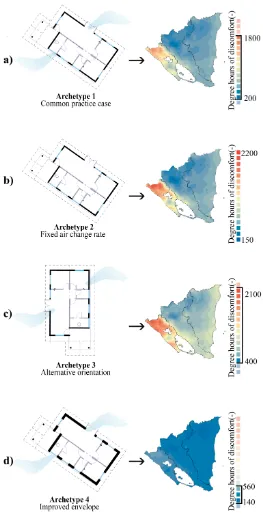
This section discusses the results of simulations depicted in performance maps for each archetype. This analysis must be 22
conducted prior to the validation of climatic zoning to assure the consistency of building performance data. Figure 9 shows 23
four performance maps based on simulations results (degree-hours of discomfort per year) for the archetypes described in 24
Table 1. In spite of remarkable differences in the magnitude of performance illustrated in Figure 9, the areas in the country 25
with best or worst performance are consistent for the various archetypes. Regions presenting the highest values of degree-26
hours of discomfort are predominantly located in the Pacific region (red colours in Figure 9 a, b and c, and light blue in 27
11 discomfort are mainly encountered in the north central and north Atlantic region (dark blue in all the maps), which have 1
higher altitudes than the rest of the country. 2
Figure 9a and 9b present a very similar performance pattern as the corresponding archetypes only differ in the 3
ventilation configuration. Archetype 1 was simulated with natural ventilation and Archetype 2 was simulated with a fixed 4
infiltration of 4 ACH [11,64,71]. The ranges of performance of map a varies from 200 to 1800 degree-hours of discomfort 5
while in map b, discomfort ranges from 150 to 2200 hours. This difference implies that the peak values of degree-6
hours of Figure 9b (Archetype 2) reached up to 22% more than Figure 9a (Archetype 1). This difference is considerable and 7
it demonstrate that simplifications (e.g. assumed air change rate) adopted in labelling schemes for naturally ventilated 8
buildings in hot countries, or hot periods of the year, may mask the effect of climate on building performance, putting at risk 9
the effectiveness of building regulations derived from those programs. 10
Figure 9c illustrates the performance of Archetype 3. Its orientation over the north-south axis increases the exposure of 11
the largest facades of the dwelling to solar heat gains. Therefore, when compared with the Figure 9a, the number of degree-12
hours of discomfort is significantly higher. These results are consistent with the low level of insulation in these archetypes, 13
which makes solar heat gains a highly relevant factor for building performance. Archetype 4 (Figure 9d), shows a 14
remarkable improvement in energy performance due to its improved envelope, with degree-hours of discomfort varying 15
from 140 to 560 degree-hours of discomfort per year. 16
4.2 In-depth analysis of Archetype 2 and the climatic zoning based on cooling degree days 17
This section provides an in-depth analysis of results of one archetype and one climatic zoning, in order to exemplify the 18
calculation of the percentage of misplace areas in this case study. The analysis in this section contrasts CDD-10 climatic 19
zones (Figure 7a) with the performance map for Archetype 2 (Figure 9b). 20
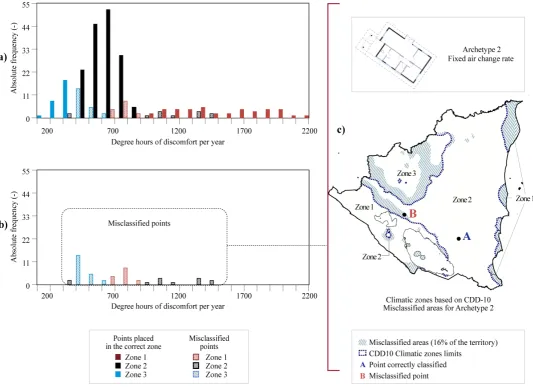
Figure 10a shows histograms of frequency distribution of performance results in each CDD-10 climatic zone. Nicaragua 21
is divided into three zones according to the CDD-10 method. Zone1, which is the hottest zone of the country, is mainly 22
located in the Pacific Coast and fragments of the Atlantic Coast. In this zone, the performance of Archetype 2 covers a very 23
wide range of values, from 700 to 2200 degree-hours of discomfort (Figure 10a - bars in dark red and hatched red/white). In 24
this zone, it is difficult to identify a dominant range of performance as results show a widespread distribution. Such large 25
spread is consistent with climatic variation in the zone described in Ref. [7]. Zone 2, located in the Atlantic and Central 26
regions, is the largest zone in the country. This zone also presents a wide range of performance results for this archetype, 27
from 350 to 1500 degree-hours of discomfort (Figure 10a – bars in black and hatched black/white). However, results in this 28
zone are less spread than in Zone 1 and there is a clear peak in performance between 600 and 700 degree-hours of 29
12 simulation results (partly due to its small extension), varying from 150 to 600 degree-hours of discomfort for Archetype 2 1
(Figure 10a – bars in blue and hatched blue/white). The performance with higher frequency observed in this zone is around 2
300 degree-hours of discomfort per year. 3
In spite of each zone showing a distinct overall performance for Archetype 2, there are significant overlaps between the 4
bars in Figure 10a. This overlap is highlighted in Figure 10a using solid and hatched bars. In the figure, solid bars represent 5
areas within each zone that are considered correctly placed, while hatch bars represent cases belonging to misclassified 6
areas. Let’s take, for example, bars regarding the performance of 700 degree-hours of discomfort per year. The majority of 7
the areas where Archetype 2 shows such performance are placed in Zone 2 (solid black bar in Figure 10a). However, in a 8
few areas of Zone 1 and 3, this archetype also shows performance around 700 degree-hours of discomfort per year (hatched 9
bars in red and blue respectively). These areas in Zones 1 and 3 are considered misclassified, as the performance in these 10
areas is closer to the one in Zone 2 rather than to the typical performance in Zones 1 and 3. 11
Figure 10b presents the frequency bars of misclassified points for Archetype 2 in the three zones of the CDD-10 climatic 12
zoning. The sum of points represented by these bars gives the percentage of misclassified areas for this particular archetype 13
in this climatic zoning, which is equal to 16%. This is the main output of this section and the process must be repeated for 14
other archetypes and climatic zonings under validation. Section 4.3 addresses the combination of such results in the 15
calculation of the MPMA for each climatic zoning. However, before proceeding with the calculation of MPMA, it is 16
important to analyse the overall spatial distribution of misclassified areas and enquire about the possible physical causes for 17
differences in performance observed in the simulations (as a quality assurance measure in the validation process). 18
The bars in Figure 10b correspond to actual locations in the territory; these locations are identified in the map on Figure 19
10c. In the map, three major misclassified areas can be observed: 20
In Zone 1, the areas located in the Atlantic Coast are identified as misclassified, as performance results in that 21area are closer to predominant performance in Zone 2. 22
The boundary between Zones 1 and 2 shows a large misclassified area, originally placed in Zone 2, but 23showing performance of Archetype 2 much closer to the one found in Zone 1. 24
Zone 3 has a large misclassified area, where the performance is closer to the one found in Zone 2 rather than 25the performance found in the rest of Zone 3. 26
The reasons for such misclassification reside in the complex interaction between several climatic variables and the many 27
energy flow paths in the building, interaction that is not captured by the CDD-10 method for climatic zoning (based only on 28
13 the performance of Archetype 2 in two locations in Nicaragua, in order to exemplify the nature of such interactions and 1
bring physical meaning to the misclassifications seen in Figure 10. 2
Points A and B in Figure 10c are both located in the same CDD-10 Climatic Zone (Zone 2), however they exhibit 3
substantially different performance results. Point A is placed in an area correctly classified as Zone 2, while Point B is 4
placed in a misclassified area. Figure 11 illustrates a set of comparison between these two points. Figure 11a shows a plot of 5
building performance results (x-axis) versus CDD-10 data used by the climatic zoning method (y-axis). In this figure, Point 6
A fits into the predominant performance range of Zone 2, while Point B has the same range of performance of several points 7
classified as Zone 1 instead. Figure 11a shows a strong (but far from perfect) correlation between CDD-10 and degree-hours 8
of discomfort per year. Differences observed between Points A and B in terms of CDD-10 are in the order of 1% (5711 in 9
Point A and 5849 in Point B), while the difference in degree-hours of discomfort is in the order of 35% (751 in point A to 10
1156 in point B). CDD-10 neglected several climatic variables such as solar radiation, wind speed and direction; to a certain 11
extent daily temperature amplitude is also neglected. These features of CDD-10 can mask significant climatic variations 12
between two locations. In the example of Points A and B, the global solar radiation is significantly higher in Point B when 13
compared to Point A (around 20% on average over the year). This difference leads to 10 to 28 % higher heat gains through 14
windows when Archetype 2 is place at Point B in comparison with Point A (as exemplified in Figure 11b for a given room 15
and month of the year). This difference in heat gains translates into higher operative temperature inside the dwelling, 16
directly affecting the number of degree-hours of discomfort per year (as exemplified in Figure 11c). 17
This section provided an in-depth analysis of results for a particular archetype, considering the validation of a particular 18
climatic zoning for Nicaragua. The next section provides the overall results of percentage of misclassified areas for the four 19
archetypes and MPMA for all climatic zoning under validation in this case study. 20
4.3 Results of overall performance of the four climatic zoning alternatives under validation 21
The use of different building archetypes in the climatic zoning process is fundamental, as each building has a different 22
sensitivity to climatic variations due to its particular properties and shape. These different sensitivities lead to variations in 23
the percentage of misclassified areas for each archetype in the validation of a given climatic zoning. Results of percentage 24
of misclassified areas for each archetype adopted in this research are summarized in Figure 12, considering each one of the 25
climatic zoning alternatives in Figure 7. In spite of small variations, results are consistently around 15 and 25% for zonings 26
based on clustering with three or four zones and for CDD-10. Climatic zoning based on administrative divisions has the 27
worst results when compared to other zoning alternatives, which highlights the capabilities of this validation procedure for 28
14 depth analysis of results for each archetype, under each of the climatic zoning alternative (similar to the contents of Section 1
4.2) is not included in the paper and can be accessed in Ref. [63]. The following overall trends can be observed in Figure 12: 2
Buildings with less interaction with the climate show a lower percentage of misclassified areas (e.g. Archetype 2 3which has a fixed air change rate instead of natural ventilation which is strongly correlated to wind speed and 4
direction); 5
Misclassified areas tend to be higher in cases having a narrower range of performance results (e.g. Archetype 4 – 6improved envelope); 7
Building orientation plays a significant role in the misclassified areas results, as it changes the interaction between 8the building envelope and solar radiation (particularly visible in the comparison of results of Archetypes 1 and 3 in 9
the CDD-10 climatic zoning). 10
Results indicate that the performance of each climatic zoning alternative depends on the climatic features addressed by 11
this zoning methodology in relation to the characteristics of the building stock. An example to illustrate this statement is the 12
case of Archetype 4, which has an improved envelope and natural ventilation. This archetype shows the lowest level of 13
misclassification in 4-Cluster climatic zoning (17%) when compared with the other methodologies (20%, 24% and 34% 14
misclassification in Figure 12). This is related to the features captured by this climatic zoning, which defines a 4th zone in 15
Nicaragua close to the lake region due to its particular wind speed, humidity and daily amplitude [7]. These features are 16
ignored by the other climatic zoning alternatives, which show a single zone for the entire Pacific coast. As Archetype 4 17
benefits from such climatic features, the definition of a zone in this region of the country reduces the occurrence of 18
misclassified areas for this particular building. The other archetypes with typical envelopes are less sensitive to these 19
climatic features and for these archetypes the 4-Cluster climatic zoning does not show improved results when compared to 20
3-Cluster zoning. This example highlights the strong interaction between climatic zoning, building stock and energy 21
performance and indicates the need to tailor climatic zoning to particular applications in order to obtain optimum results. 22
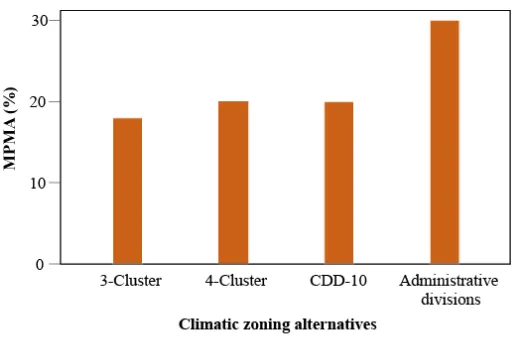
Based on results from Figure 12, the Mean Percentage of Misclassified Areas was calculated for each methodology 23
(Figure 13). The 3-Cluster Climatic Zoning presented the lowest MPMA (18%) and the Administrative divisions, the 24
highest (30%). The climatic zonings based on 3-Cluster, 4-Cluster and CDD-10 have similar MPMA, around 20%. This 25
means that around one out five points would be wrongly classified by these three climatic zoning methodologies. CDD-10 26
or cluster methodology can all be applied if a policy maker judges this level of misclassified areas is acceptable, otherwise 27
15 The climatic zoning alternatives for Nicaragua were only used in this paper to demonstrate the capabilities of the 1
validation procedure. These alternatives are not meant to be used in policymaking prior to validation with a larger sample of 2
the building stock (and with clear goals for the climatic zoning under validation). 3
5
Conclusions
4
Based on the data and analysis provided in this paper, the following general conclusions can be drawn: 5
The proposed performance-based procedure to assess the validity of climatic zoning is the first method to compare 6
climatic zoning candidates using objective and quantitative methods. 7
This methodwas capable of quantifying the level of agreement between climatic zoning and building performance. 8
Results indicate a considerable number of misplaced areas in a climatic zoning based on the degree-day method; 9
Results indicate the equivalent validity of the degree-day and cluster methods for climatic zoning in a tropical 10
climate aimed at buildings without HVAC. 11
The quality index for climatic zoning validation introduced in this paper, the Mean Percentage of Misclassified 12
Areas (MPMA), provides a clear indication of the mismatch between zoning and building performance. 13
These general conclusions are further corroborated by the following detailed conclusions from the case study focused on 14
domestic buildings with no HVAC in a tropical country. 15
MPMA increases for high performance archetypes, in which performance variation over the territory tends to be 16
narrower. 17
All tested climatic zoning methodologies tend to perform better regarding archetypes with small interaction with 18
climate (such as archetypes with fixed air flow rates rather than naturally ventilated). 19
The best case result among the climatic zoning methodologies assessed in this study (3-cluster analysis) presented 20
a MPMA of 18 %, i.e. 1 out of 5 points is wrongly placed in a climatic zone it does not belong to. The same level 21
of misclassification is also observed in climatic zoning based on CDD-10. 22
The performance-based validation of climatic zoning was able to identify the least accurate climatic zoning method 23(based on administrative divisions) which had the highest MPMA – 30%. 24
The case study results highlight the strong interaction between climatic zoning, building stock and energy 25
performance and indicates the need to tailor climatic zoning to particular applications in order to obtain optimum 26
results. 27
Future studies should investigate the application of building performance simulation in the development of the climatic 28
16 performance variations in the zones (acceptable variations within the zoning), (b) zoning resolution (number of zones), (c) 1
definition of zone boundaries under uncertainty and its implications in policy-making, as well as (d) continuity constraints 2
in zoning (usage of continuous zones or zones fragmented throughout the territory). This work has a direct impact in the 3
building environment,as it can be used to validate the many existing climatic zoning methods implemented in more than 50 4
countries worldwide [4]. 5
Acknowledgement
6
This study was partially supported by the Brazilian National Council for the Improvement of Higher Education (CAPES) 7
[grant number 15283127], the São Paulo State Research Foundation (FAPESP) [grant number 2017/14617-0]and the 8
Brazilian National Council for Scientific and Technological Development (CNPq) [grant number 311641/2013-0]. 9
References
10
[1] Briggs RS, Lucas RG, Taylor ZT. Climate classification for building energy codes and standards. ASHRAE Trans.,
11
Atlanta, USA: ASHRAE; 2003.
12
[2] Wang J, Zhai ZJ, Jing Y, Zhang C. Influence analysis of building types and climate zones on energetic, economic
13
and environmental performances of BCHP systems. Appl Energy 2011;88:3097–112.
14
[3] Zhang LY, Jin LW, Wang ZN, Zhang JY, Liu X, Zhang LH. Effects of wall configuration on building energy
15
performance subject to different climatic zones of China. Appl Energy 2017;185:1565–73.
16
[4] Walsh A, Cóstola D, Labaki LC. Review of methods for climatic zoning for building energy efficiency programs. 17
Build Environ 2017;112:337–350. 18
[5] Yang L, Lam JC, Tsang CL. Energy performance of building envelopes in different climate zones in China. Appl
19
Energy 2008;85:800–17.
20
[6] Moral FJ, Pulido E, Ruíz A, López F. Climatic zoning for the calculation of the thermal demand of buildings in 21
Extremadura (Spain). Theor Appl Climatol 2016. 22
[7] Walsh A, Cóstola D, Labaki LC. Comparison of three climatic zoning methodologies for building energy efficiency 23
applications. Energy Build 2017;146:111–21. 24
[8] M. Carpio, Jódar J, Rodíguez ML, Zamorano M. A proposed method based on approximation and interpolation for
25
determining climatic zones and its effect on energy demand and CO2 emissions from buildings. Energy Build
26
2015;87:253–64.
27
[9] Ware DW, Bozorgchami P. Energy efficiency comparison-California’s Building Energy Efficiency Standards and
28
the IECC and ASHRAE standard 90.1. CEC; 2013.
29
[10] Ren H, Zhou W, Gao W. Optimal option of distributed energy systems for building complexes in different climate
30
zones in China. Appl Energy 2012;91:156–65.
31
[11] Fossati M, Scalco VA, Linczuk VCC, Lamberts R. Building energy efficiency: An overview of the Brazilian 32
residential labeling scheme. Renew Sustain Energy Rev 2016;65:1216–31. 33
[12] ANSI/ASHRAE/IES. ANSI/ASHRAE/IES Standard, 90.1-2013. Energy Standard for buildings except low-rise 34
residential buildings 2013;2013:404–636. 35
[13] Bektas Ekici B, Aytac Gulten A, Aksoy UT. A study on the optimum insulation thicknesses of various types of
36
external walls with respect to different materials, fuels and climate zones in Turkey. Appl Energy 2012;92:211–7.
37
[14] Rodríguez-Soria B, Domínguez-Hernández J, Pérez-Bella JM, Del Coz-Díaz JJ. Review of international regulations
38
governing the thermal insulation requirements of residential buildings and the harmonization of envelope energy
39
loss. Renew Sustain Energy Rev 2014;34:78–90.
17
[15] Wan KKW, Li DHW, Pan W, Lam JC. Impact of climate change on building energy use in different climate zones
1
and mitigation and adaptation implications. Appl Energy 2012;97:274–82.
2
[16] Goetzler W, Guernsey M, Young J, Fuhrman J, Abdelaziz O. The future of air conditioning for buildings –
3
Executive summary. DOE/EE-1394; 2016.
4
[17] Rackes A, Melo AP, Lamberts R. Naturally comfortable and sustainable: Informed design guidance and 5
performance labeling for passive commercial buildings in hot climates. Appl Energy 2016;174:256–74. 6
[18] Borah P, Singh MK, Mahapatra S. Estimation of degree-days for different climatic zones of North-East India.
7
Sustain Cities Soc 2015;14:70–81.
8
[19] Lin T-P, Matzarakis A. Tourism climate information based on human thermal perception in Taiwan and Eastern 9
China. Tour Manag 2011;32:492–500. 10
[20] Araya A, Keesstra SD, Stroosnijder L. A new agro-climatic classification for crop suitability zoning in northern 11
semi-arid Ethiopia. Agric For Meteorol 2010;150:1057–64. 12
[21] Van Wart J, van Bussel LGJ, Wolf J, Licker R, Grassini P, Nelson A, et al. Use of agro-climatic zones to upscale 13
simulated crop yield potential. F Crop Res 2013;143:44–55. 14
[22] Mohammadi K, Mostafaeipour A, Sabzpooshani M. Assessment of solar and wind energy potentials for three free 15
economic and industrial zones of Iran. Energy 2014;67:117–28. 16
[23] MPWT/DGU and UNDP/GEF. Climatic zoning for buildings in Lebanon. Project capacity building for the adoption 17
and application of thermal standards for buildings. 2005. 18
[24] de la Flor FJS, Lissén JMS, Domínguez SÁ. A new methodology towards determining building performance under
19
modified outdoor conditions. Build Environ 2006;41:1231–8.
20
[25] ADEREE. Les éléments techniques du projet de la réglementation thermique du bâtiment au Maroc. Rabat, Maroc: 21
ADEREE; 2011. 22
[26] Glazer J. FINAL REPORT ASHRAE 1651-RP Development of maximum technically achievable energy targets for 23
commercial buildings. Illinois: 2015. 24
[27] Crawley DB. Building performance simulation: a tool for policymaking. University of Strathclyde, 2008. 25
[28] Bodach S, Lang W. Design guidelines for energy-efficient hotels in Nepal. Int J Sustain Built Environ 2016;5:411– 26
34. 27
[29] Azar E, Menassa CC. A comprehensive framework to quantify energy savings potential from improved operations 28
of commercial building stocks. Energy Policy 2014;67:459–72. 29
[30] Kavgic M, Mavrogianni A, Mumovic D, Summerfield A, Stevanovic Z, Djurovic-Petrovic M. A review of bottom-30
up building stock models for energy consumption in the residential sector. Build Environ 2010;45:1683–97. 31
[31] Swan LG, Ugursal VI. Modeling of end-use energy consumption in the residential sector: A review of modeling 32
techniques. Renew Sustain Energy Rev 2009;13:1819–35. 33
[32] Corgnati SP, Fabrizio E, Filippi M, Monetti V. Reference buildings for cost optimal analysis: Method of definition
34
and application. Appl Energy 2013;102:983–93.
35
[33] Triana MA, Lamberts R, Sassi P. Characterisation of representative building typologies for social housing projects 36
in Brazil and its energy performance. Energy Policy 2015;87:524–41. 37
[34] Kazas G, Fabrizio E, Perino M. Energy demand profile generation with detailed time resolution at an urban district
38
scale: A reference building approach and case study. Appl Energy 2017;193:243–62.
39
[35] Reinhart CF, Cerezo Davila C. Urban building energy modeling - A review of a nascent field. Build Environ 40
2016;97:196–202. 41
[36] Chen Y, Hong T, Piette MA. Automatic generation and simulation of urban building energy models based on city
42
datasets for city-scale building retrofit analysis. Appl Energy 2017;205:323–35.
43
[37] Buffat R, Froemelt A, Heeren N, Raubal M, Hellweg S. Big data GIS analysis for novel approaches in building
44
stock modelling. Appl Energy 2017;208:277–90.
18 [38] Deru M, Field K, Studer D, Benne K, Griffith B, Torcellini P, et al. U. S. Department of Energy Commercial 1
Reference Building Models of the National Building Stock. 2011. 2
[39] California Energy Commission, CEC. California Energy Maps. Webpage 2016. 3
http://www.energy.ca.gov/maps/renewable/building_climate_zones.html (accessed April 4, 2017). 4
[40] Carlo J, Lamberts R. Development of envelope efficiency labels for commercial buildings: Effect of different 5
variables on electricity consumption. Energy Build 2008;40:2002–8. 6
[41] Melo AP, Cóstola D, Lamberts R, Hensen JLM. Development of surrogate models using artificial neural network 7
for building shell energy labelling. Energy Policy 2014;69:457–66. 8
[42] Carpino C, Mora D, Arcuri N, De Simone M. Behavioral variables and occupancy patterns in the design and 9
modeling of Nearly Zero Energy Buildings. Build Simul 2017;10:875–88. 10
11
[43] Ahn KU, Kim DW, Park CS, de Wilde P. Predictability of occupant presence and performance gap in building
12
energy simulation. Appl Energy 2017;208:1639–52.
13
[44] Silva AS, Ghisi E, Lamberts R. Performance evaluation of long-term thermal comfort indices in building simulation 14
according to ASHRAE Standard 55. Build Environ 2016;102:95–115. 15
[45] Yang L, Yan H, Lam JC. Thermal comfort and building energy consumption implications - A review. Appl Energy
16
2014;115:164–73.
17
[46] Guillén-Lambea S, Rodríguez-Soria B, Marín JM. Comfort settings and energy demand for residential nZEB in
18
warm climates. Appl Energy 2017;202:471–86.
19
[47] Building Research Establishment (BRE). UK’s National calculation method for non domestic buildings 2016. 20
http://www.uk-ncm.org.uk/index.jsp (accessed December 9, 2016). 21
[48] Kokogiannakis G, Strachan P, Clarke J. Comparison of the simplified methods of the ISO 13790 standard and 22
detailed modelling programs in a regulatory context. J Build Perform Simul 2008;1:209–19. 23
[49] ESRU. ESP-r 2016. http://www.esru.strath.ac.uk/Programs/ESP-r.htm (accessed December 9, 2016). 24
[50] EQUA. IDA Indoor Climate and Energy 2016. http://www.equa.se/en/ida-ice (accessed December 9, 2016). 25
[51] Crawley DB, Lawrie LK, Pedersen CO, Liesen RJ, Fisher DE, Strand RK, et al. EnergyPlus: a new-generation 26
building energy simulation program. Proceeedings Build Simul 1999;1:81–88. 27
[52] IES 2016. https://www.iesve.com/ (accessed December 9, 2016). 28
[53] OSMC. OPENMODELICA 2016. https://www.openmodelica.org/ (accessed December 9, 2016). 29
[54] Mendes N, Oliveira RCLF, dos Santos GH. Energy efficiency and thermal comfort analysis using the the 30
Powerdomus hygrothermal simulation tool. Ninth Int. IBSA Conf. Simul. 2005, vol. 9th, 2005, p. 755–62. 31
[55] Burleyson CD, Voisin N, Taylor ZT, Xie Y, Kraucunas I. Simulated building energy demand biases resulting from
32
the use of representative weather stations. Appl Energy 2017:1–13.
33
[56] Cui Y, Yan D, Hong T, Xiao C, Luo X, Zhang Q. Comparison of typical year and multiyear building simulations
34
using a 55-year actual weather data set from China. Appl Energy 2017;195:890–904.
35
[57] Crawley DB. Which weather data should you use for energy simulations of commercial buildings? In: ASHRAE, 36
editor. ASHRAE Trans., vol. 104, Atlanta: 1998, p. 498–515. 37
[58] Bern C-, Huguenin-landl B, Studer C. Handbook part I : Software Global Meteorological Database Version 7 38
Software and Data for Engineers , Planers and Education 2017. 39
[59] Malkin S. Weather data for building energy analysis. Weather Forecast 2008:1–12. 40
[60] Hensen JLM, Lamberts R. Building performance simulation for design and operation. Spon Press. New York: 2011. 41
[61] Benjamin SG, Dévényi D, Weygandt SS, Brundage KJ, Brown JM, Grell G a., et al. An hourly assimilation– 42
Forecast cycle: The RUC. Mon Weather Rev 2004;132:495–518. 43
19 NCAR Tech Note NCAR/TN-398+STR 1994:121.
1
[63] Walsh A. Zoneamento bioclimático para edificações baseado no desempenho térmico. UNICAMP, 2017. 2
[64] Melo AP, Cóstola D, Lamberts R, Hensen JLM. Assessing the accuracy of a simplified building energy simulation 3
model using BESTEST: The case study of Brazilian regulation. Energy Build 2012;45:219–28. 4
[65] Walsh A, Cóstola D, Labaki LC. Improving thermal comfort using cost-effective passive strategies. Lessons from a 5
single-floor detached dwelling in Nicaragua. Proc. 9th Wind. Conf. Mak. Comf. Relev., Windsor, UK: NCEUB; 6
2016, p. 7–10. 7
[66] ANSI/ASHRAE. Thermal Environmental Conditions for Human Occupancy Standard 55-2013. vol. ASHRAE Sta. 8
2013. 9
[67] McGilligan C, Natarajan S, Nikolopoulou M. Adaptive comfort degree-days: A metric to compare adaptive comfort 10
standards and estimate changes in energy consumption for future UK climates. Energy Build 2011;43:2767–78. 11
[68] Crawley DB, Lawrie LK, Winkelmann FC, Buhl WF, Huang YJ, Pedersen CO, et al. EnergyPlus: Creating a
new-12
generation building energy simulation program. Energy Build 2001;33:319–31.
13
[69] Henninger RH, Witte MJ. EnergyPlus testing with building thermal envelope and fabric load tests from
14
ANSI/ASHRAE Standard 140-2007. US Dep Energy 2010:132.
15
[70] Pereira HA da C, Melo AP, Versage R, Sorgato M, Lamberts R. Manual de simulação computacional de edifícios 16
naturalmente ventilados no programa EnergyPlus –Versão 8.0 2013. 17
Figures
[image:20.595.105.493.504.674.2]Figure 1 . Climatic zoning methodological flow a) current approach and b) proposed approach
2 Figure 3 . Key elements in the production of building performance maps
[image:21.595.34.577.73.257.2]3 Figure 5 . Histograms of performance for one archetype presenting a) overlap between zones, b) misclassified points
and c) misclassified areas.
[image:22.595.40.576.495.700.2]4 Figure 7 . Climatic zoning options obtained using the following methodologies: a) degree-days, b) 3-cluster c),
4-cluster and d) administrative divisions.
[image:23.595.171.422.376.547.2]5 Figure 9 . Building performance maps for the four archetypes showing variation in the number of degree-hours of
6 Figure 10 Overlap between zones based on CDD10 for Archetype 2, a) frequency distribution of simulation results,
7 Figure 11 Comparison of two locations classified in the same zone by the CDD-10 methodology but having different
performances for Archetype 2, a) correlation between CDD-10 and performance results, b) monthly heat gain through the window in Room 2 and c) operative temperature inside Room 2 (March 31st).
[image:26.595.34.556.387.680.2]Tables
Table 1 . Thermal properties of common practice case (archetype 1) and changes in properties of additional archetypes (in comparison to archetype 1)
Archetype 1 Archetype 2 Archetype 3 Archetype 4
Input parameters Common
practice case
Fixed air change rate
Alternative orientation
Improved envelope
U-value W/(m2 K)
External
walls 3.10 - - 1.30
Internal
partitions 2.10 - - 1.10
Roof 2.55 - - 2.20
Solar
absorptance (-)
External
Walls 0.70 - - 0.30
Roof 0.55 - - 0.50
SHGC (-) 0.86 - - 0.70
Ventilation Openable windows Fixed infiltration
(4 ACH) - -
Orientation
Northeast-Southwest
- North-South -